© 2013 Faculty of Geography UGM and The Indonesian Geographers Association
ASSESSING THE EFFECTS OF LAND USE CHANGE ON RUNOFF
IN BEDOG SUB WATERSHED YOGYAKARTA
Aris Prasena
BAPPRDA PROV DIY kompleks Kepatihan Danurejan, Yogyakarta
D.B. Pikha Shrestha
Faculty of Geo-Information and Earth Observation, University Of Twente
ABSTRACT
The study was to assess the effects of land use change on runoff in the Bedog sub watershed. Soil and Water Assessment Tool-Water Balance (SWAT-WB) hydrological modeling was used to predict runoff for years of 2001, 2006, and 2010. Land use in Bedog has rapidly changed in last few decades due to agglomeration process in Yogyakarta City. Coverage of mixed garden decreased during period of 2001-2010 despite still as predominant land use in total. On the other side, change detection analysis revealed that there was an increase of settlements coverage from 9.51% to 13.79% in the same period. Sensitivity analysis revealed that soil properties were the most sensitive parameters on runoff generation. Calibration was performed for years of 2001, 2006, and 2010 and the result shows an acceptable performance in runoff simulation. Changes in land use were responsible for an increase in the annual runoff between 3.42% 4.67%. This study showed that dynamics of runoff can be predicted by forecasting and simulating future land use.
Key Words: Remote sensing, Geographic Information System (GIS), land use change, Soil and Water Assessment Tool-Water Balance (SWAT-WB), runoff.
ABSTRAK
Penelitian ini bertujuan untuk menganalisis dampak dari perubahan penggunaan lahan terhadap limpasan di sub DAS Bedog. Pemodelan hidrologi berupa Soil and Water
Assessment Tool-Water Balance (SWAT-WB) digunakan untuk memprediksi limpasan
selama tahun 2001, 2006, dan 2010. Penggunaan lahan di Bedog dengan cepat berubah dalam beberapa dekade terakhir akibat proses aglomerasi di Kota Yogyakarta. Lahan berupa kebun campuran berkurang selama periode 2001-2010, meskipun lahan tersebut masih merupakan penggunaan lahan dominan secara keseluruhan. Di sisi lain, analisis deteksi perubahan menunjukan bahwa terjadi peningkatan cakupan permukiman dari 9,51% menjadi 13,79% pada periode yang sama. Analisis sensitivitas menunjukkan bahwa sifat tanah merupakan parameter yang paling sensitif dalam menghasilkan limpasan. Kalibrasi yang dilakukan selama bertahun-tahun 2001, 2006, dan 2010 menunjukkan kinerja yang dapat diterima dalam simulasi limpasan. Perubahan penggunaan lahan berdampak pada peningkatan limpasan tahunan antara 3,42% - 4,67%. Studi ini menunjukkan bahwa dinamika limpasan dapat diprediksi dengan peramalan dan simulasi penggunaan lahan di masa depan.
Kata Kunci: Penginderaan jauh, Sistem Informasi Geografis (GIS), perubahan penggunaan
INTRODUCTION
Changes in land use and land cover have occurred from prehistoric times till present [Ellis, 2010]. Mankind has changed land
surface in attempts to improve the availability of space, and enhance security of basic natural resources. The phenomena of land use changes and its consequences to the environment are important to be observed in attempts to implementing sustainable development.
Agglomeration of Yogyakarta as the centre of economic activities and education services in Yogyakarta Province has witnessed rapid development of buildings, infrastructure, and changes of land use from non-urban to urban features. As a consequence land use change took place, growth of settlement in Bantul, Sleman, and Yogyakarta increased 7.16% in period of 1994-2000 while on the other hand areas of paddy field decreased from 46.31 % to 39.49 % [BAPPEDA of Yogyakarta Province, 2007].
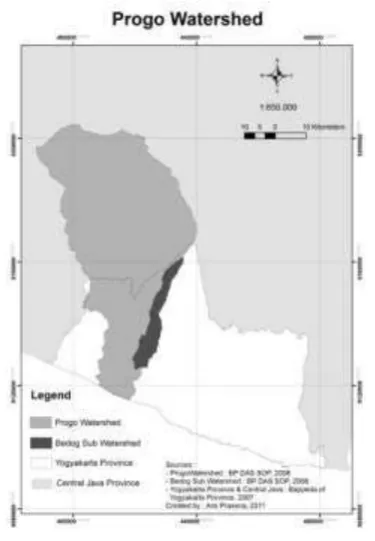
Bedog is part of Progo watershed which one of urbanized watersheds (figure 1). The middle stream of Bedog is part of agglomeration Yogyakarta which determined as national growth pole. It has role as centre of economic and education activities. On the other hand, most part of upper area and downstream has different characteristic as an agriculture areas that contribute in food security program.
Middle part of Bedog as urban fringe of Yogyakarta has witnessed urbanization and changes in land use.
Figure 1. Map of Progo watershed
As consequence, extensive changes from non-urban into urban features possibly generate higher runoff that will increase flood risk both in the area of Yogyakarta agglomeration and in the lower part of watershed.
The main objective of this research is to assess the effects of land use change on runoff in Bedog sub watershed, Yogyakarta Province, Indonesia.
The specific objectives of this research are:
1. To identify the existing land use pattern.
2. To analyze pattern and magnitude of land use change 2001-2010. 3. To determine runoff using a model. 4. To analyze the relation between land use change and runoff dynamic.
[Lambin and Geist, 2006]. This is also
supported by deforestation in tropical countries [Pagiola, 2000] and extensively
application of agricultural intensification in productive land using fertilizers, pesticides and irrigation systems in recent decades.
In Indonesia, the loss of natural forest in Sumatra, Kalimantan, Sulawesi, and Irian Jaya between 1985 and 1997 is over 19 million ha of forest, including 6.7 million ha in Sumatra and 8.5 million ha in Kalimantan [Pagiola, 2000]. This amount
is an average annual rate in those two islands of 1.26 million ha per year.
Yunus, [2008] points out that
industrialization has become main driving force for rapid urbanization since most of manufacturing industries tend to be located around city centre to minimize production cost. Lambin and Geist, [2006]
argue that urbanization affects land in rural areas through the ecological footprint of cities includes, agricultural land in peri-urban areas for residential, infrastructure, and amenity uses, which blurs the distinction between cities and rural.
Land use change due to urban growth has occurred in Yogyakarta Province. Konig et al., [2010] point out that population
density in the Yogyakarta increased by 84% (from 532 to 979 persons per km2) in 1970-2000. This rapid growth resulted in urban-rural expansions of built-up areas by 13% (1990–2006). In period of 1993-2006, growth of built-up areas and new rural settlements was doubled, while agricultural land decreased by 25%.
Hydrological cycle is a conceptual model of how water moves around between the earth and atmosphere in different states as a gas, liquid or solid [Davie, 2008]. Washington State Department of Ecology
[1986] suggests that the hydrologic cycle begins when water evaporates into the atmosphere that can be derived from
vegetation, soil, lakes, rivers, snowfields and oceans.
Precipitation which covers all forms of water being released by the atmosphere is the beginning of a whole chain of events that occurs in watersheds and the source of water that replenishes soil moisture, stream flows, lakes, glaciers, etc [Salas, 2006]. According to Washington State
Department of Ecology, [1986]
precipitation falls on the earth and either percolates into the soil or flows across the ground.
The term runoff incorporates the movement of liquid water above and below the surface of the earth [Davie,
2008]. Surface runoff is part of the rainfall that flows over the surface of the soil to the rivers, lakes, and oceans [Asdak,
1995]. Runoff mechanisms that contribute to stream flow can be distinguished as overland flow, through flow/lateral flow, and groundwater flow [Davie, 2008].
Overland flow is the water which runs across the surface of the land before reaching the stream. Lateral flow is the water which runs the subsurface, occurs in the shallow subsurface, predominantly, although not always, in the unsaturated zone. Groundwater flow is in the deeper saturated zone.
Factors affecting runoff are factors related to climate, particularly rainfall and characteristics of watershed [Asdak, 1995].
The rate and volume of runoff is determined by duration, intensity, and distribution of rainfall while characteristics of watershed are shape, morphometry, topography, geology, and land use (type and vegetation density).
Land use change plays role as main factor in hydrological cycle. Giertz et al., [2004]
has less infiltration rate than forest, thus causes higher surface runoff and soil loss rates.
Research based on model simulation on the hydrological parameters [Pei-Jun Shi et al., 2007] points out that urbanization
could lead to higher runoff, greater flood peak discharge and shorter runoff confluence times, and thus greater risk of flood disasters. The urbanization phenomena will increase the impervious area, which is identified as main factor in increasing direct runoff [Nie et al., 2011].
According to Davie, [2008] urban areas
have a greater extent of impervious surfaces than in most natural landforms. Consequently the amount of infiltration excess (Hortonian) overland flow is high. Urban areas are often designed to have a rapid drainage system, taking the overland flow away from its source. Where extensive urbanization of a catchment occurs, flood frequency and magnitude increases.
Remote sensing refers to the activities of recording, observing, and perceiving objects or events which in far-away places. In a more specific definition, remote sensing is a science and technology to acquire information about the earth’s surface and atmosphere using sensors onboard airborne or space borne platforms [Weng, 2010].
Geographic Information System (GIS) was
a tool of automated mapping and data management. It has evolved into a capable spatial data-handling and analysis technology and, more recently, into geographic information science [Weng,
2010]. The basic concept of GIS is
location and spatial distribution and relationship of geographic phenomena.
The integration of remote sensing and GIS technologies has been applied widely and recognized as an effective tool for analysis [Weng, 2010]. Remotely sensed data can
be used to extract thematic information to
create GIS layers [Weng, 2010]. Thematic
information provides descriptive data about earth surface features and can be diversified as areas of interest, such as soil, vegetation, water depth, and land cover/land use. Thematic information can be generated through visual interpretation of remotely sensed data or computer-based digital image analysis.
Soil & Water Assessment Tool-Water Balance (SWAT-WB) is a modified version
of the USDA's Soil & Water Assessment Tool watershed model (SWAT). This
model uses a physically based soil water balance to model surface runoff instead of using the traditional Curve Number method [White et al., 2009]. The
hydrologic cycle is simulated by the water balance equation:
Where, and are the final and initial soil water content respectively (mm), R = daily rainfall (mm), Q = daily
approaches to determine stream flow; Curve Number, and the Green-Ampt deficit for each soil profile for each day of simulation. This saturation deficit is termed for the available soil storage
Where is available soil storage, EDC is
The porosity is a constant value for each soil type or land mapping unit (HRUs) in SWAT-WB. Ashagre, [2009] suggests that
by dividing areas into hydrologic response unit, θ will varies by the day for each of HRUs and determined by SWAT’s soil moisture routines. The effective depth,
EDC, a calibration parameter ranging from
zero to one, is used to represent the portion of the soil profile used in calculating the saturation deficit.
The available storage, τ, is calculated each day prior to the start of any rain event. Once precipitation starts, a portion of the rain, equal in volume to τ, will infiltrate the soil. If the rain event is larger in volume than τ, the soil profile will be saturated and surface runoff will occur. If the rain event is less than τ, the soil will not be saturated and there will be no surface runoff [White et al., 2009].
The study area is Bedog sub watershed (15528 ha) which is part of Progo watershed (69648 ha). Bedog is located in the eastern part of Progo and administratively lay across two districts in Yogyakarta Province (Sleman and Bantul) and the city.
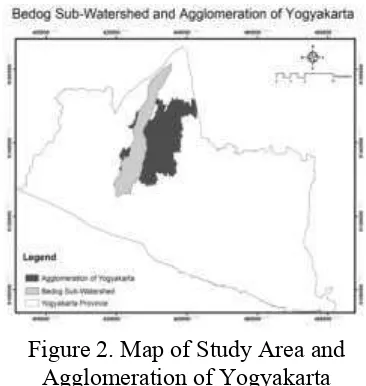
The main reason for selection of the study area is that more than half area of Bedog is also area of Yogyakarta agglomeration (figure 2). Spatial planning regulation of Yogyakarta Province has determined Yogyakarta agglomeration as a strategic area and role as national growth pole
[BAPPEDA of Yogyakarta Province,
2010].
Figure 2. Map of Study Area and Agglomeration of Yogyakarta
The study area has elongated shape since the value of circularity ratio is 0.2308 [BP DAS SOP, 2008]. Based on the slope
classes, Bedog sub watershed predominantly by flat area. Drainage pattern can be identified by numbers of river branches. Bedog sub watershed can be classified as a strong drainage shape since it has 5-7 branches [BP DAS SOP,
2008].
In period of 1986-2006, the largest annual rainfall in Bedog was 2505 mm/yr (Ledoknongko Station) and the smallest annual rainfall was 1740 mm/yr measured at Patukan Station. Number of wet months in the study area is 6-8 [Umam, 2010].
Based on the classification of climate types according to Schmidt and Ferguson which uses a Q value (ratio between the average dry months and the average wet months), the climate types of an area can be derived. Since Bedog has Q value between 0.333-0.600 and 0.60-1.00, it can be concluded that the study area has 2 types of climates namely C (slightly wet) and D (medium) [BP DAS SOP, 2008].
Umam, [2010] points out that based on
Based on data from BP DAS SOP,[2008],
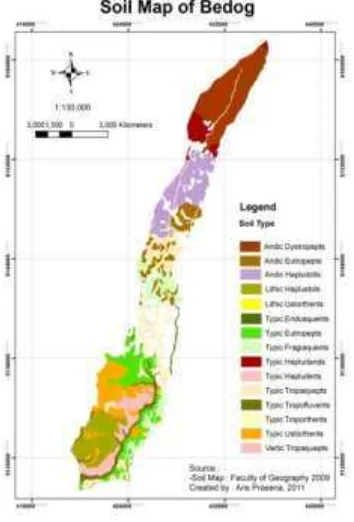
complex Red-Brown Latosol - Lithosol (6183 ha) and Grey-brown Regosol (4845 ha) are predominant soil types in Bedog sub watershed. Other soil types are; complex Regosol and Lithosol, Greyish-brown Regosol, complex Lithosol, Mediterranean and Rendzina, complex Grey Regosol and Lithosol, and Grey-brown Alluvial.
Based on the land use within the study area we get strongly indication that Bedog is urbanized sub watershed; there is no forest, paddy field is predominant land use, and existence of settlement which is quite prominent. Alluvial plains and Fluvio Vulkan plains widely used for paddy field with irrigation system. Umam,
[2010] argues that mixed garden is another land use which is quite prominent in Bedog. Settlements lot located in the middle of Bedog while mixed garden is a type of land use that many found in the upstream and downstream areas that have a high slope.
Figure 3. Soil Map of Bedog Source: Umam, 2010
THE METHODS
Land Use
Series of remotely sensed data (2001, 2006, and 2010) were extracted to generate land use of study area. ASTER
(Advanced Spaceborne Thermal Emission and Reflection Radiometer) images were used as data source. The ASTER scenes
covering the study area were projected to Universal Transverse Mercator (UTM)
coordinate system, Datum WGS 1984,
zone 49 Southern. The images were corrected to geometric using ground control points based on topographic map of Indonesia.
Statistical pattern recognition technique [Jensen, 2005] was an information
extraction method used in this research to classify land cover/land use. During image classification on the ASTER images, ENVI
4.5, a software for image processing, was employed. The previous cloud-free image was used to extract information when clouds were found on the image.
The initial step of image classification was to classify images into classes of land cover. The supervised classification technique was employed during training stage while the maximum likelihood algorithm was a parametric method used in classification decision rule [Mather and Tso, 2009].
Land use map was obtained by intersecting the result of land cover classification with the landform through Geographic Information System (GIS). Results of land
Change detection analysis was employed to determine changes in land use. Conversion, which means a change from one land use type to another, was the type of changes that analyzed in this research. Bi-temporal change detection (direct comparison) was the approach used in change detection. It is measure changes based on a simple timescale comparison (two data).
Using Arc GIS tools, tables of land use composition and its changes were resulted. Pattern of land use for 2001, 2006, and 2010 were analyzed either based on spatial or percentages of area. Direct comparison of conversion and its magnitude in period of 2001-2006 and 2006-2010 were used for analysis.
SWAT-WB Model Setup Soil and Water
Assessment Tool – Water Balance ( SWAT-WB), a hydrological model, was employed
for this study to simulate runoff based on information provided by the user. Except in the runoff calculation, all of processes in SWAT-WB can be performed through
the interface in Geographic Information System (GIS) for original SWAT.
ArcSWAT 2009 was the interface that used in ArcGIS 9.3.
The main inputs of SWAT model include Digital Elevation Model (DEM), land use
datasets, soil datasets, and weather data. The first step required was to delineate watershed/sub watershed. Automatically watershed delineation was employed using the DEM data which obtained from
Planning and Development Agency (BAPPEDA) of Yogyakarta. Contour map
with 6.25 m contour interval was used as DEM source.
As watershed delineation completed, determining the hydrologic response units (HRUs) which represents specific character of variables that affect runoff was the further important step in the research. HRUs were constructed by
define the datasets which were land use
and soil datasets, reclassify layers of land use and soil, and overlay layers. Once overlay process was completed, a detail description of land use and soil distribution in the sub watershed provided. Having determined HRUs, SWAT requires
weather data input to simulate runoff.
Weather Data Inputs
Daily precipitation data were obtained from the Water Resources Agency (BP SDA) of Yogyakarta. Based on the rough screening on the available rainfall data, Spearman’s rank-correlation, and F-test. Double mass method was employed to analyze relative consistency and homogeneity of rainfall data.
Runoff
The Soil and Water Assessment Tools-Water Balance (SWAT-WB) follows a
saturation excess approach and uses a simplified water balance. Runoff is calculated as
Qsurf= P −τ
Where Qsurfis the surface runoff in
millimeters (mm), P is the daily
precipitation in mm, and τ is the available soil storage in mm.
is the volumetric soil moisture of HRU.
Sensitivity Analysis and Calibration After run the model, the results from the simulation were evaluated through sensitivity analysis and calibration in order to sufficiently predict the runoff. The purpose of the sensitivity analysis is to estimate the rate of change in the output of a model with respect to changes in [Moriasi et al., 2007]. Sensitivity analysis
was conducted in identifying parameters that most influential in governing runoff.
The method in the ArcSWAT interface for sensitivity analysis combines the Latin Hypercube (LH) sampling and
One-factor-At-a-Time (OAT) design for simulation
[van Liew and Veith, 2009]. The
calibration was done by comparing the average annual conditions from predicted runoff with the measured data which derived from discharge. SWAT-WB offers
3 methods of calibration [White et al.,
2009]; Dynamically Dimensioned Search
(DDS) algorithm that used outside of GIS
interface, PARASOL which is an auto
calibration algorithm included in the
SWAT program and available for use
within the GIS interface, and manual
calibration. Manual calibration that based on the parameters resulted from sensitivity analysis was employed in this study.
The coefficient of determination (R2) which is the square of the Pearson’s product-moment correlation coefficient and the Nash-Sutcliffe Coefficient (NSE)
were used as statistical approaches to check the model performance [Moriasi et al., 2007].
Dynamics of Runoff Due to Land Use Changes
Scenario of land use for the year 2019 was used to identify the dynamics of runoff due to land use changes. Land use of 2019 was constructed based on the planning documents from provincial development and planning agency (BAPPEDA) of
Yogyakarta. In spatial planning document of Yogyakarta Province 2009-2028, the development in Yogyakarta agglomeration is directed to the settlements, the center of economic activity and services with restrict limit to the conversion of fertile agricultural land. The minimum number of fertile agricultural land in Yogyakarta agglomeration should be 20% of the area in 2019.
Two runoff prediction scenarios for the years of 2001 and 2010 using land use of the year 2019 were conducted to identify the dynamics of runoff due to land use changes with respect to the same amount of rainfall in the study area.
RESULT & DISCUSSION
Land Use Pattern
Based on the coverage of area for each land use class (table 1), 46.35% of study area were covered by mixed garden, 24.49%, and 9.51% by paddy field and settlements respectively. Mixed garden were found in most parts of sub watershed, particularly in the south western part and in the upper part of sub watershed. These areas have higher slope characteristics and terrain hilly. Settlements occupied mostly the middle part of Bedog which characterized by flat area. Coverage of paddy field was quite prominent because of support from irrigation program through dam establishment and water provision.
Table 1. Land Use of Bedog 2001, 2006, and 2010
Land Use 2001 2006 2010
Area (ha) Area (%) Area (ha) Area (%) Area (ha) Area (%)
Mixed Garden 6415.09 46.34 6656.20 48.09 5881.28 42.49
Moor/field 848.62 6.13 1104.48 7.98 1046.56 7.56
Paddy Field 3388.98 24.49 2924.68 21.13 3509.68 25.37
Settlement 1316.09 9.51 1622.11 11.72 1909.26 13.79
Water Body 23.31 0.17 21.82 0.16 20.52 0.15
Total 13840.55 100.00 13840.55 100.00 13840.55 100.00
Source: Image Classification, 2011
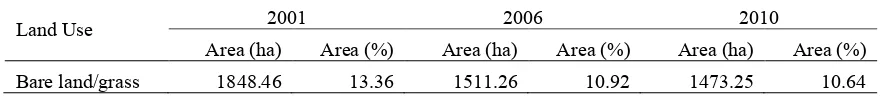
The patterns of land use distribution in 2006 and 2010 were similar with the pattern in 2001. Mixed garden occupied major part of the total land by but there was an increase of settlements coverage due to growth of housing demand in the urban fringe of Yogyakarta. The high percentage of coverage for mixed garden and paddy field confirms that agriculture is the basis of life in Bedog despite the occurrence of agglomeration process. Water body was the class with lowest coverage among the other whilst bare land/grass covered approximately 10% of the total area.
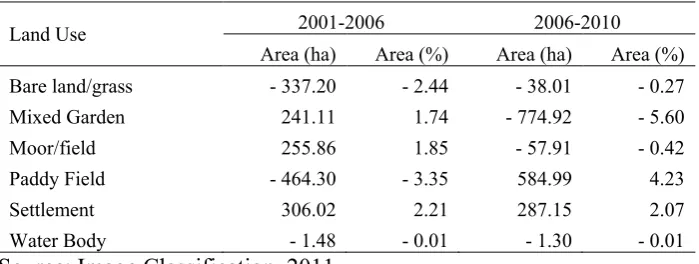
Land Use Change
During the period of 2001-2006, the area of paddy field decreased by 3.35% while there was expansion of settlements area by more than 2% (table 2). Area of mixed garden and moor/field also increased, on the other side bare land/grass decreased by more than 2%. The result of change detection in period of 2001-2006 showed that 1.55% of the area which was originally paddy field in 2001 turned into settlements in 2006.
Table 2. Trend and Magnitude of Land Use Change in Bedog: 2001-2006, and 2006-2010
Land Use 2001-2006 2006-2010
Area (ha) Area (%) Area (ha) Area (%)
Bare land/grass - 337.20 - 2.44 - 38.01 - 0.27
Mixed Garden 241.11 1.74 - 774.92 - 5.60
Moor/field 255.86 1.85 - 57.91 - 0.42
Paddy Field - 464.30 - 3.35 584.99 4.23
Settlement 306.02 2.21 287.15 2.07
Water Body - 1.48 - 0.01 - 1.30 - 0.01
Source: Image Classification, 2011
The period between 2006 and 2010 witnessed a high drop of mixed garden coverage, on the other side area of paddy field increased significantly. Settlement was the only class of land use that consistently increased for period 2001-2010. As centre of economic and education activities, Yogyakarta agglomeration has attracted many people to move into this area and thus contributing to the high demand on settlements as an evidence of physical
expansion of the city into urban fringe areas.
Based on the change detection result for period 2006-2010 paddy field coverage increased despite some areas of paddy field continually changed into settlements. This was one of evidences of the success of program in agriculture and irrigation.
2001 - 2010 is relatively low when compared to what happened in Yogyakarta city in general. A research conducted by
Konig et al., [2010] showed that expansion
of building and housing in urban area of Yogyakarta was 0.81% per year during the period of 1990-2006. It can be explained because establishment of new growth poles in Bedog were less when compared with other urban fringe in Yogyakarta. Main growth poles which dominated by economic and educational centre are located in the north and east of the city. It role as trigger in the rapid growth of built up area.
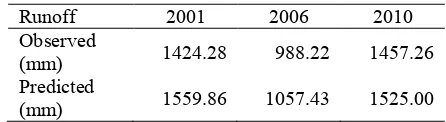
Runoff
The model over predicted the runoff for all of the years. Table 3 showed comparison of measured and simulated runoff on an annual basis.
Table 3. Comparison of Observed and Predicted Runoff
Soil properties; available water capacity
(SOL_AWC), soil evaporation
compensation factor (ESCO), and depth from soil surface to bottom of layer (SOL_Z) in mm) were the most sensitive parameter in runoff production. The available water capacity (SOL_AWC) in mm water / mm soil was found to be the most sensitive parameter in sensitivity analysis.
Runoff generation was also found to be sensitive to groundwater parameters; threshold depth of water in the shallow aquifer required for return flow to occur (GWQMN) in mm, and the base flow alpha factor (ALPHA_BF) in days. The crop parameters; maximum canopy storage (CANMX) in mm H2O, maximum potential leaf area index (BLAI), and plant uptake compensation factor (EPCO) were
less sensitive parameters in runoff production.
Result of sensitivity analysis was followed in model calibration which done on annual basis. Runoff calibration for the study area was conducted for the years 2001, 2006, and 2010. Data of previous years respectively were used for warm up simulation. Calibration was performed manually until the predicted values meet with the observed annual average. Available water capacity of the soil layer (SOL_AWC) increased by 12.5% in order
to reduce surface runoff, soil evaporation compensation factor (ESCO) was adjusted
into 0.8 in attempt to decrease total flow. The effective depth coefficient (EDC)
value was adjusted to be 0.985. The result on average of annual surface run off after calibration was shown in the table 4.
Table 4. Average of Annual Observed and Predicted Runoff after Calibration than the observed at the first rainy season (February-May) in 2001. On the other side, the predicted run off was higher than the observed data at the second the rainy season (October-December). In 2006 and 2010, the model predicted runoff higher than observed data in the first wet season while under predicted in the second wet season. Difference on the pattern of the model to predict runoff at the beginning of rainy season can be occurred by the influence of the available initial soil moisture from previous year.
The performance of SWAT-WB was
objectively evaluated by coefficient of determination (R2) and Nash-Sutcliffe coefficient of Efficiency (NSE). The
model performance evaluation were tabulated in table 5.
Table 5. Result of Model Evaluation Performance
Statistical
Parameter 2001 Year 2006 2010
R2 0.70 0.57 0.51
NSE 0.64 < 0 0.43
Based on the coefficient of determination results on monthly basis, the model performance was considerably acceptable in predicting runoff since the R2 values were > 0.5 [Moriasi et al., 2007]. The
statistical results for NSE revealed that the mean observed value in 2006 was a better predictor than the predicted value which indicates unacceptable performance. On the other hand, results for 2001 and 2010 were generally viewed as acceptable performance [Moriasi et al., 2007].
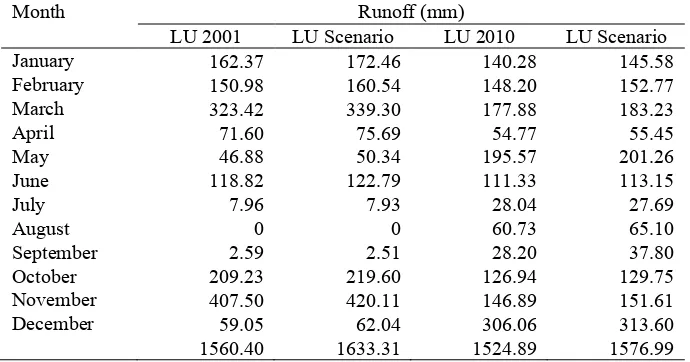
Effect of Land Use Change on Runoff A land use scenario was established in order to investigate the dynamics of runoff due to changes in land use. The model was re-run using the land use scenario and weather input used in 2001 and 2010. The scenario of land use in 2019 was constructed based on spatial planning document of Yogyakarta 2009-2028. The composition of land use scenario was shown by (table 6). The coverage of
settlements in the study area increased from 9.51% in 2001 to 13.79%, 22.72% in 2010, 2019 respectively.
Analysis was done by comparing predicted annual runoff in 2001 and 2010 with annual runoff in 2019 (table 7). The result indicated that there were increase of annual runoff by 4.67 % and 3.42 % in land use scenario compared to the year of 2001 and 2010 respectively.
Increase in runoff for 4.67% and 3.42% as the contribution from the expansion of 13.21% and 8.93% in settlements coverage can be classified as small quantities. A study using SWAT in Malaysia [Alansi et al., 2009] revealed the expansion of the
settlement for 13.17% led to changes in runoff reaches 8%.
Table 6. Land Use Scenario 2019
Land Use 2019
Area (ha) Area (%)
Bare land/grass 855.26 6.18
Mixed garden 5654.47 40.85
Moor/field 306.05 2.21
Paddy Field 3859.67 27.89
Settlement 3144.58 22.72
Water Body 20.52 0.15
Total 13840.55 100.00
Table 7. Comparison of Runoff Land Use 2001-2010 on Runoff Land Use Scenario
Month Runoff (mm)
LU 2001 LU Scenario LU 2010 LU Scenario
January 162.37 172.46 140.28 145.58
February 150.98 160.54 148.20 152.77
March 323.42 339.30 177.88 183.23
April 71.60 75.69 54.77 55.45
May 46.88 50.34 195.57 201.26
June 118.82 122.79 111.33 113.15
July 7.96 7.93 28.04 27.69
August 0 0 60.73 65.10
September 2.59 2.51 28.20 37.80
October 209.23 219.60 126.94 129.75
November 407.50 420.11 146.89 151.61
December 59.05 62.04 306.06 313.60
The effects of land use change on runoff in Bedog which less in magnitude can be attributed to two factors: soil type, and the type of conversion in land use. Most of soil type in study area have least clay content and higher sand content that characterized by high saturated hydraulic conductivity. The soils have moderate to high infiltration rates, moderately deep, drained well, and fine to moderately coarse textures. These soil properties led the areas produce less amounts of surface runoff.
Conversion of land use in Bedog was not occurred drastically. This is because there was no forest in the study area, thus the deforestation which led higher impact on the dynamics of runoff did not happened. Most of changes in land use were from cultivated vegetation or vacant land into urban appearance.
CONCLUSIONS
The following conclusions are drawn based on the result obtained and the analysis:
1. The analysis on land use pattern and its changes revealed that there was continuous expansion in settlements coverage mostly in the middle part of Bedog. Coverage of settlements increased from 9.51% to 13.79% during period of 2001 – 2010.
2. Result of sensitivity analysis by the model found that soil properties were the parameters in the study area to which the runoff most sensitive. The runoff generation was found also to be sensitive to groundwater parameters. 3. The performance of SWAT-WB to
simulate runoff was found to be good based on the value of R2; 0.7, 0.57, and 0.51 for the years of 2001, 2006, and 2010 respectively. Using Nash-Sutcliffe coefficient of efficiency (NSE), performance of the model was acceptable for years of 2001 and 2010 with the values; 0.64, and 0.43
respectively, but it was unacceptable for 2006 with the value <0.
4. The result of runoff simulation with the land use scenario indicated that land use changes were responsible for an increase of 3.42% to 4.67% in the annual runoff.
RECOMMENDATIONS
The following suggestions are made to enhance the result of the study:
1. The results of the model can be improved by determining soil properties and groundwater parameters more accurately through detailed study. land use planning can be established in attempt to get optimum development and minimizing risk in hydrological condition.
ACKNOWLEDGEMENT
Thanks to Prof. Dr. Hartono for the valuable comments and his support during the research and thanks to review for the Simulation and Forecasting in Upper Bernam Humid Tropical River Basin, Malaysia. Faculty of
Engineering, Universiti Putra Malaysia, Selangor.
and Water Assessment Tool:
Historical Development,
Applications, and Future Research
Direction.
.(4): 1211-1250 2007.
Asdak, Chay. (1995). Hydrology and
Watershed Management. Gadjah
Mada University Press,
Yogyakarta.
Ashagre, Biniam Biruk. (2009). SWAT to Identify Watershed Management Options: Anjeni Watershed, Blue Nile Basin, Ethiopia. MSc research
paper, Cornell University.
BAPPEDA of Yogyakarta Province.
(2007). Agglomeration of
Yogyakarta.Project Report.
BAPPEDA of Yogyakarta Province.
(2010). Spatial Natural Planning
Regulation of Yogyakarta Province
2009-2028. Provincial Regulation.
BP DAS SOP. (2008). Identification on Characteristic of Progo Watershed .
Project Report.
Davie, Tim. (2008). Fundamentals of
Hydrology. Routledge
Fundamentals of Physical
Geography.
Ellis, Erle. (2010). Use and
Land-Cover Change.
http://www.eoearth.org/article/Lan d-use_and_land-cover_change last accessed on 4 June 2011.
Giertz S, Junge B, and Diekkrüger B, (2004). Assessing the Effects of Land Use Change on Soil Physical
Properties and Hydrological
Processes in the sub-humid
Tropical Environment of
WestAfrica.
(http://www.sciencedirect.com/scie nce/article/B6X1W4H3BM0Y1/2/
25d0047ffff3ce8616655bf544445a df . last accessed on 14 May 2011.
Jensen, John. (2005).Introductory Digital
Image Processing. Pearson
Education, Inc.
Konig, Hanes. Schuler, Johannes. Suarma,
Utia. McNeill, Desmond.
Imbernon, Jaques. Damayanti,
Frieta. Dalimunthe, Syarifah.
Uthes, Sandra. Sartohadi, Junun. Helming, Katharina. Morris Jack.
(2010). Assessing the Impact of
Land Use Policy on Urban-Rural Sustainability Using the FoPIA
Approach in Yogyakarta Indonesia.
www.mdpi.com.journal/sustainabil ity. last accessed on December 12, 2011.
Lambin,Eric. Geist, Helmut (Eds.) (2006). Land Use and Land Cover Change.
SPRINGER.
Mather, Paul. Tso, Brandt. (2009).
Classification Methods for
Remotely Sensed Data. CRC Press.
Moriasi, D.N. Arnold, J.G. Van Liew, M.W. Bingner, R. L. Harmel, R.D.
Veith, T. L. (2007). Model
Evaluation Guidelines for
Systematic Quantification of
Accuracy in Watershed
Simulations. American Society of
Agricultural and Biological
Engineers . 50(3): 885 900.
Nie, W. Yuan, Y. Kepner, W. Nash, M.S. Jackson M and Erickson C. (2011). Assessing Impacts of Land Use and Land Cover Changes on Hydrology for the Upper San Pedro watershed.
Journal of Hydrology.407(1-4) :
105-114.
Pagiola, Stefano. (2000). Land Use
Change in Indonesia. Environment
Pei-Jun Shi, Yi Yuan, Jing Zheng, Jing-Ai Wang, Yi Ge, Guo-Yu Qiu. (2007).
The Effect of Land Use/Cover Change on Surface Runoff in Shenzhen region, China Catena 69
31–35.
www.elsevier.com/locate/catena last accessed on 14 May 2011.
Salas, Jose. (2006). Precipitation.
Colorado State University,
Department of Civil and Environmental Engineering.
Umam, Idam. (2010). Assessment on Hydrograph Model Gamma Synthetic Unit 1 and Natural Hydrograph in the watershed of Bedog. Thesis. Faculty of
Geography Gadjah Mada
University, Yogyakarta.
Van Liew, Michael. Veith, Tamie. (2009).
Guidelines for Using the Sensitivity Analysis and Auto-calibration Tools for Multi-gage or Multi-step Calibration in SWAT.
Washington State Department of Ecology. (1986). Ground Water Resource Protection Handbook.
Weng, Qihao. (2010). Remote Sensing and GIS Integration. McGraw Hill.
White, Eric. Easton, Zach. Fuka, Dan. Steenhuis, Tammo, Collick, Amy S. Adgo, Enyew. Matthew McCartney, Awulachew, Seleshi B. Selassie, Yihenew G. (2009).
Adapting the soil and water assessment tool (SWAT) for the Nile Basin. Cornell University.
White, Eric. Easton, Zach. Fuka, Dan. Steenhuis, Tammo. (2009). SWAT WB Theoritical Documentation. Cornell University.