Malaysian Registry of Intensive Care
Report for 2015
Prepared by
Dato’
Dr Jenny Tong May Geok
Dr Tai Li Ling
Dr Tan Cheng Cheng
Dr Lim Chew Har
Dr Nahla Irtiza bt Ismail
June 2016
© Malaysian Registry of Intensive Care
Published by:
Malaysian Registry of Intensive Care
Clinical Research Centre
Ministry of Health Malaysia
Disclaimer:
This work may be reproduced in whole or part for study or training purposes, subject to the
inclusion of an acknowledgement of the source.
Suggested citation:
Jenny Tong May Geok, Tai Li Ling, Tan Cheng Cheng, Lim Chew Har, Nahla Irtiza bt Ismail
Malaysian Registry of Intensive Care 2015 report
Electronic version:
4
CONTENTS
Page
Contents………. 4
Report Summary………... 5
Acknowledgement……… 6
Foreword……… 7
MRIC Technical Committee 2015………. 8
Participating Hospitals……… 9
Categories of ICU ………. 11
Site Investigators and Source Data Providers 2015…..……… 13
Abbreviations……… 16
List of Tables………. 17
List of Figures……… 18
Introduction……….. 19
Results Section A General Information……… 21
Section B Patient Characteristics……… 32
Section C Interventions……… 57
Section D Complications………. 70
Section E Mortality Outcomes………... 86
Section F Quality Improvement activities……… 94
Section G Dengue infection 2011 – 2015……… 108
Summary………. 113
5
REPORT SUMMARY
This is the report on all intensive care admissions to the 50 participating centres from 1
stJanuary to
31
stDecember 2015.
The following are the main findings:
1.
The total number of ICU beds in the 49 MOH participating units was 660 with a median
bed occupancy rate of 91.6%.
2.
The number of cases analysed was 39,595, an increase of 4% over the previous year.
3.
The percentage of patients denied admission due to the unavailability of ICU beds was
32%. This figure had remained fairly the same in the last five years.
4.
The average age of the patients, excluding those below 18 years, was 49.5 years.
5.
The average duration of ICU and hospital stay was 4.8 and 14.4 days respectively.
6.
In MOH hospitals, 69% of ICU admissions were non-operative patients.
7.
Direct admissions to MOH ICUs from the emergency department had increased almost
three-fold over the past 10 years from 10% in 2005 to 33% in 2015.
8.
Dengue infection, sepsis and head injury were the three most common diagnoses leading to
ICU admission in MOH hospitals in 2015. The in-hospital mortality rates for this group of
patients were 8.9%, 51.2% and 22.0%respectively.
9.
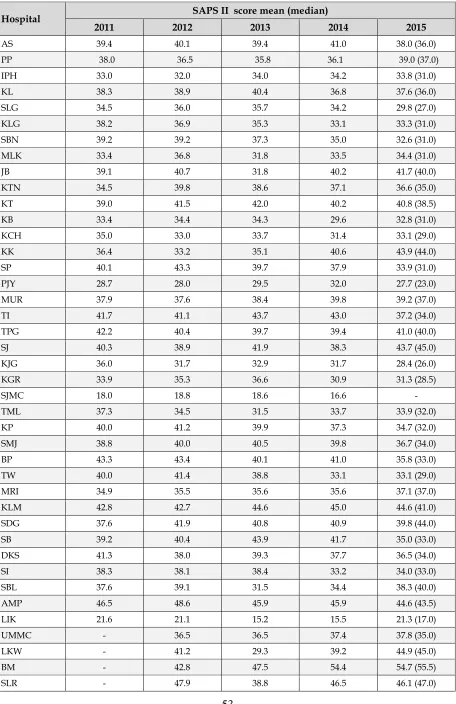
The average SAPS II score was 36.8, which carries a predicted in-hospital mortality of
30.4%.
10.
In MOH hospitals, 75% of patients received invasive ventilation with an average duration
of 4.7 days.
11.
The percentage of patients who received non-invasive ventilation increased more than
three-fold from 5.1% in 2005 to 18.6% in 2015.
12.
The incidence of ventilator-associated pneumonia in MOH ICUs had decreased by more
than half, from 6.8 to 2.4 per 1000 ventilator days, in the last five years.
13.
The incidence of central venous catheter-related bloodstream infection in MOH ICUs was
0.8, 0.7 and 0.4 per 1000 catheter days for 2013, 2014 and 2015 respectively
14.
The crude in-ICU and in-hospital mortality rates for MOH hospitals were 18.8% and 26.5%
respectively.
15.
The crude in-ICU and in-hospital mortality rates for UMMC were 18.4% and 25.8%
respectively.
6
ACKNOWLEDGEMENT
The Technical Committee of the Malaysian Registry of Intensive Care would like to thank
the following:
All site investigators and source data providers
The heads of Department of Anaesthesia and Intensive Care of participating ICUs
Staff of the participating ICUs
Quality of Health Care Unit, Medical Development Division, Ministry of Health
National Clinical Research Centre, Ministry of Health
Health Informatics Centre, Planning and Development Division, Ministry of Health
Malaysian Society of Intensive Care
7
FOREWORD
Time really flies and I have been given another opportunity for me to write the foreword
for the MRIC report. This message is filled with pride for the tremendous achievements by
this group of hardworking intensivists who have consistently produced annual reports
that has been a reference source for the Ministry of Health for the continuous
improvement in the delivery of critical care services to patients.
This report includes all intensive care admissions to the 50 participating centres from 1
stJanuary to 31
stDecember 2015. The total number of ICU beds in the 49 MOH
participating centres was 660, with a median bed occupancy of 91.6%. The number of cases
analysed for year 2015 was 39,595, an increase of 1.7% over the previous year. The
percentage of patients denied admission due to the unavailability of ICU beds was
32% in 2015.
Dengue infection, sepsis and head injury were the three most common diagnoses
leading to ICU admission. 75%of patients in MOH ICUs received invasive
ventilation with an average duration of 4.7 days. The percentage of patients who
received non-invasive ventilation increased from 5.1% in 2005 to 18.6% in 2015
displaying the preferential trend towards non invasive ventilation. The incidence of VAP
had decreased by more than half from 6.8 to 2.4 per 1000 ventilator days over the last
five years.
All the MOH ICUs have in place several quality indicators: Ventilator Care Bundle, Central
Venous Catheter Care Bundle, Early Mobility in ICU and the SSKIN bundle. I believe that
the implementation of these quality indicators will improve the outcome of the patients in
ICU.
I take this opportunity to thank
Dato’ Dr Jenny Tong May Geok, Dr Tai Li
Ling, Dr
Lim Chew Har, Dr Tan Cheng Cheng, Dr Nahla Irtiza Ismail and Sister Lim Siew Kim for
working together to produce this report. I want to acknowledge the hard work of all the
site investigators and source data collectors who have contributed to the registry. I also
want to express my thanks to the National Clinical Research Centre, Health Informatics
Centre, Ministry of Health and Medical Development Division, Ministry of Health for
their continued guidance and support.
Dr. Sivasakthi V
8
TECHNICAL COMMITTEE
MALAYSIAN REGISTRY OF INTENSIVE CARE 2015
Advisors
Datin Dr Sivasakthi Velayuthapillai
Consultant Anaesthesiologist and Head
Department of Anaesthesia and Intensive Care
Hospital Kuala Lumpur
Principal Investigator
Dato
’
Dr Jenny Tong May Geok
Consultant Anaesthesiologist and Head
Department of Anaesthesia and Intensive Care
Hospital Tuanku Ja’afar Seremban
Co-Investigators
Dr Tai Li Ling
Consultant Intensivist
Department of Anaesthesia and Intensive Care
Hospital Kuala Lumpur
Dr Tan Cheng Cheng
Consultant Intensivist
Department of Anaesthesia and Intensive Care
Hospital Sultanah Aminah Johor Bahru
Dr As-Niza Abdul Shukor
Consultant Anaesthesiologist and Head
Department of Anaesthesia and Intensive Care
Hospital Taiping
Dr Ahmad Shaltut Othman
Consultant Intensivist
Department of Anaesthesia and Intensive Care
Hospital Sultanah Bahiyah Alor Setar
Dr Lim Chew Har
Consultant Intensivist
Department of Anaesthesia and Intensive Care
Hospital Pulau Pinang
Project Manager
Sr Lim Siew Kim
9
PARTICIPATING HOSPITALS
No.
Name of hospital
Abbreviation
Sites since 2002
1.
Hospital Sultanah Bahiyah Alor Setar
AS
2.
Hospital Pulau Pinang
PP
3.
Hospital Raja Permaisuri Bainun Ipoh
IPH
4.
Hospital Kuala Lumpur
KL
5.
Hospital Selayang
SLG
6.
Hospital Tengku Ampuan Rahimah Klang
KLG
7.
Hospital Tuanku Ja’afar Sere
mban
SBN
8.
Hospital Melaka
MLK
9.
Hospital Sultanah Aminah Johor Bahru
JB
10.
Hospital Tengku Ampuan Afzan Kuantan
KTN
11.
Hospital Sultanah Nur Zahirah Kuala Terengganu
KT
12.
Hospital Raja Perempuan Zainab II Kota Bharu
KB
13.
Hospital Umum Sarawak Kuching
KCH
14.
Hospital Queen Elizabeth Kota Kinabalu
KK
Sites since 2005
15.
Hospital Sultan Abdul Halim Sungai Petani
SP
16.
Hospital Putrajaya
PJY
17.
Hospital Pakar Sultanah Fatimah Muar
MUR
18.
Hospital Teluk Intan
TI
19.
Hospital Taiping
TPG
20.
Hospital Seberang Jaya
SJ
21.
Hospital Kajang
KJG
22.
Hospital Tuanku Fauziah Kangar
KGR
Sites since 2006
23.
Hospital Sultan Haji Ahmad Shah Temerloh
TML
24.
Hospital Tuanku Ampuan Najihah Kuala Pilah
KP
25.
Hospital Sri Manjung
SMJ
10
27.
Hospital Tawau
TW
28.
Hospital Miri
MRI
29.
Hospital Kulim
KLM
30.
Hospital Serdang
SDG
Sites since 2010
31.
Hospital Sibu
SB
32.
Hospital Duchess of Kent Sandakan
DKS
33.
Hospital Sultan Ismail Johor Bahru
SI
34.
Hospital Sungai Buloh
SBL
35.
Hospital Ampang
AMP
36.
Hospital Wanita dan Kanak-Kanak Sabah
LIK
Sites since 2012
37.
University Malaya Medical Centre
UMMC
38.
Langkawi
LKW
39.
Bukit Mertajam
BM
40.
Slim River
SLR
41.
Port Dickson
PD
42.
Kuala Krai
KKR
43.
Segamat
SGT
44.
Tanah Merah
TM
45.
Kemaman
KEM
46.
Kuala Lipis
KLP
47.
Labuan
LAB
48.
Keningau
KEN
49.
Bintulu
BIN
11
CATEGORIES OF ICU
Based on the number of ICU admissions in 2015, for the purpose of MRIC 2015 report
Participating sites
Number of
admissions
Participating sites with > 1000 admissions
1
Hospital Sungai Buloh
2313
2
Hospital Tengku Ampuan Rahimah Klang
2184
3
Hospital Kuala Lumpur
1985
4
Hospital Sultanah Aminah Johor Bharu
1719
5
Hospital Sultan Ismail Johor Bahru
1473
6
Hospital Melaka
1430
7
Hospital Sultanah Nur Zahirah Kuala
Terengganu
1398
8
Hospital Selayang
1392
9
Hospital Sultanah Bahiyah Alor Setar
1363
10
Hospital Raja Permaisuri Bainun Ipoh
1328
11
Hospital Sibu
1275
12
Hospital Raja Perempuan Zainab II Kota Bharu
1267
13
Hospital Pulau Pinang
1172
14
Hospital Umum Sarawak Kuching
1143
15
Hospital Taiping
1126
16
Hospital Tengku Ampuan Afzan Kuantan
1043
17
Hospital Sultan Abdul Halim Sungai Petani
1015
Participating sites with 500 - 999 admissions
18
Hospital Queen Elizabeth Kota Kinabalu
925
19
Hospital Duchess of Kent Sandakan
923
20
Hospital Sultan Haji Ahmad Shah Temerloh
828
21
Hospital Putrajaya
764
22
Hospital Serdang
756
23
Hospital Ampang
671
24
Hospital Pakar Sultanah Fatimah Muar
611
25
Hospital Sultanah Nora Ismail Batu Pahat
546
26
Hospital Tuanku Ampuan Najihah Kuala Pilah
545
27
Hospital Tuanku Ja’afar Seremban
542
12
Participating sites with < 500 admissions
29
Hospital Seberang Jaya
475
30
Hospital Kajang
464
31
Hospital Tawau
444
32
Hospital Sri Manjung
441
33
Hospital Teluk Intan
424
34
Hospital Kuala Krai
391
35
Hospital Miri
377
36
Hospital Tuanku Fauziah Kangar
355
37
Hospital Bintulu
315
38
Hospital Tanah Merah
308
39
Hospital Segamat
290
40
Hospital Port Dickson
230
41
Hospital Bukit Mertajam
218
42
Hospital Slim River
201
43
Hospital Langkawi
195
44
Hospital Labuan
184
45
Hospital Kemaman
179
46
Hospital Wanita dan Kanak-Kanak Sabah
154
47
Hospital Lahad Datu
150
48
Hospital Keningau
136
49
Hospital Kuala Lipis
107
University hospital
13
LIST OF SITE INVESTIGATORS AND SOURCE DATA COLLECTORS
January – December 2015
No Hospital Site investigator Source data collectors
1 Sultanah Bahiyah Alor Setar Dr Ahmad Shaltut Othman Sr Teoh Shook Lian SN Hafisoh Ahmad SN Haslina Khalid SN Noorazimah Salleh
SN Faten Ramiza Ahmad Abdullah
2 Pulau Pinang Dr Lim Chew Har SN Siti Hazlina Bidin
SN Rosmawati Yusoff
SN Emeelia Zuzana Abdul Wahab
3 Raja Permaisuri Bainun Ipoh Dr Foong Kit Weng SN Saadiah Bidin SN Ng Pek Yoong SN Thila
4 Kuala Lumpur Dr Tai Li Ling SN Ismee Jusoh
SN Nuradzlinda Saidin
5 Selayang Dr Laila Kamariah Kamalul
Baharin
SN Marliana Arshad
6 Tengku Ampuan Rahimah Klang
Dr Sheliza Wahab SN Latifah Omar
SN Tai Yoke Ching
SN Rosenah Abdul Rahman
7 Tuanku Ja’afar Seremban Dato’ Dr Jenny Tong May Geok
SN Farawahida Ahmad
8 Melaka Dr Nahla Irtiza Ismail Sr Zaliha Emperan
SN Norina Abd Kadir
9 Sultanah Aminah Johor Bahru
Dr Tan Cheng Cheng Sr Marian Sais ak Sipit SN Aishah Abu Bakar AMO Mohd Adib Jasni AMO Anand Sivasamy AMO Hidayah Hussin
10 Tengku Ampuan Afzan Kuantan
Dr Hafizah Mohammad Sr Gan Soo Heng SN Aminah Abd Hamid SN Nik Rosliza Nik Daud SN Linda Idris
11 Sultanah Nur Zahirah Kuala Terengganu
Dr Mohd Ridhwan Mohd Nor
SN Zauwiah Idris SN Aslinawati Chik
12 Raja Perempuan Zainab II Kota Bharu
Dr Wan Nasrudin Wan Ismail
Sr Azizum Ismail SN Roslita Abd Rahman
13 Umum Sarawak Kuching Dr.Jamaidah Jamhuri SN Sabia Lew
SN Rosnica Jiton SN Sharon Ivy Gombek
14 Queen Elizabeth Kota Kinabalu
Dr Lily Ng Mooi Hang Dr Khoo Tien Meng
SN Conny Chong Chiew Fah SN Saihin Maun
14
15 Sultan Abdul Halim Sungai Petani
Dr Rosman Noor Ali SN Zainun Awang
16 Putrajaya Dr Fauziah Yusoff Sr Latifah Mohd Korib
SN Maznah Muhamad
17 Pakar Sultanah Fatimah Muar
Dr Suzaliatun Kasbullah SN Mazlidah Osman SN Nurazlin Jawad SN Fazal Naim Ramli
18 Teluk Intan Dr Noor Azira Haron SN Azliza Zakaria
SN Rohayu Dalila Yusof
19 Taiping Dr As-Niza Abdul Shukor SN Salihah Ahmad
SN Che Zakiah Othman SN Rozieyana Mohd Razali
20 Seberang Jaya Dr Vellan Sinnathamby SN Siti Noormi Ahmad
SN Mira Nabila Ramlan
21 Kajang Dr Nursuhaila Mohd Amin SN Normaizana Ismail
SN Rosnani binti Ab.Latip SN Suriani Mat Saad
22 Tuanku Fauziah Kangar Dr Azilah Desa Sr Che Salma Abdul Rahman
SN Zarina Mat Bistaman SN Norazlisyan Ramli SN Norshaheera Nalini
23 Sultan Haji Ahmad Shah Temerloh
Dr Rahimah Haron Sr Rakiah Mohd Noor
SN Norliza Ismail SN Rohayu Yusof
24 Tuanku Ampuan Najihah Kuala Pilah
Dr Zalifah Nordin SN Norhafidah Ismail Sr Khadijah Md Taher
25 Sri Manjung Dr Khairudin Zainal Abidin Sr Hartini Abd Rahman
SN Salbiah Abdul Rashid SN Norfaizal Abdul Majid
26 Batu Pahat Dr Nasrudin Bunasir SN Norhaezah Jani
27 Tawau Dr Sein Win SN Lilybeth Feliciano Ferez
SN Sarwah Isa
SN Sharifah Maznah Habib Muhammad
28 Miri Dr Norhuzaimah Julai
Abdul Julaihi
SN Noriah Ilai SN Zuriha Achim
29 Kulim Dr Chua Kok Boon Sr Mahani binti Hassan
SN Mohana Omar
SN Bahayah Mohamed Bakari SN Che Asmah Haji Md Isa
30 Serdang Dr Nazarinna Muhamad Sr Siti Ainah Buang
SN Sarina Jamhari
31 Sibu Dr Anita Alias SN Yong Suk Moi
32 Duchess of Kent Sandakan Dr Rusnah Abd Rahman Sr Noorasmah Hassim SN Norahimah Dulraman SN Sofiah Yampi
15
33 Sultan Ismail Johor Bahru Dr Azmin Huda Abd Rahim Sr Azleena Mohd Yusop SN Norelessa Abd Aziz SN Salina Idris
SN Khashikin Wahab SN Amira Ruduan
34 Sungai Buloh Dr Shanti Ratnam Matron Sri Jayanthi Gobalan
SN Siti Salwa Mohd Latif
35 Ampang Dr Rusnah Ab.Latif Sr Normazlin Md Derus
SN Amiza Dyana Abu Amin SN Asilah Fatin
SN Juliana Ismail
36 Wanita dan Kanak-Kanak Sabah
Dr Lorrain Lim Tze Chi Sr Siti Rajiah bt Muslimin
SN Dayang Noreenz Mohd Yusoh SN Yusnita bt Yunus
37 University Malaya Medical Centre
Dr Vineya Rai
Dr Mohd Shahnaz Hassan Dr Mohd Idzwan Zakaria
Matron Azizah Md Lajis
MLT Nur Aina Muhamad Affandi
38 Langkawi Dr Suriana Mohd Abu
Bakar
Sr Hamiza Harun
39 Bukit Mertajam Dr Vellan Sinnathamby Sr Norhizan Ab Tholib
SN Lai Lian Chooi
40 Slim River Dr Tin Tin Myint Sr Khairol Nazimah Musa
SN Suliati Baghdadi
41 Port Dickson Dr Hema Malini
Manogharan
Sr Hapisah Mat
SN Muhazni Mohammad
42 Kuala Krai Dr Norhafidza Ghazali Sr Norlela Ismail
SN Salma Ismail
43 Segamat Dr Zawiyah Kassim Sr Hasneyza Baharin
44 Tanah Merah Dr Mohd Azmi Mamat Sr Norzilawati Ramli
45 Kemaman Dr Ahmad Nizam Ismail Sr Rosmazariawati Zahari
SN Inu-Zubaini Mohammad Zain
46 Kuala Lipis Dr Sharihanim Hussain Sr Potchaine Ek Kam
SN Nik Arienti Nik Man SN Rohaida Ibrahim
47 Labuan Dr Betty Shee Ching Lee Sr Roslin Akiu
Sr Eramanis Abd Hamid SN Hafizah Ejab
48 Keningau Dr Maswiana Abdul Majid Sr Haineh Amin
SN Aine Gadol
49 Bintulu Dr Hairatun Ida Md
Hamzah (till Aug 2015) Dr Soon Chien Chang
Sr Jennifer Anak Sahim SN Ann Lampung SN Maureen Lee Pheey SN Ubong Atan Tze
50 Lahad Datu Dr Mohd Rohaizad Zamri Sr Sanisah Lakim
16
ABBREVIATIONS
Adm. Admission
AKI Acute kidney injury
ALI Acute lung injury
AMO Assistant medical officer
AOR At own risk
APACHE II Acute Physiologic and Chronic Health Evaluation (Version II)
ARDS Acute respiratory distress syndrome
BOR Bed occupancy rate
CRBSI Catheter-related bloodstream infection
CRE Carbapenem-resistant Enterobacteriaceae
CRRT Continuous renal replacement therapy
CVC Central venous catheter
CVC-BSI Central venous catheter-related bloodstream infection
ED Emergency department
ENT Otorhinolaryngology
ESBL Extended spectrum beta-lactamases
HD Haemodialysis
HDU High dependency unit
Hosp Hospital
Hrs Hours
ICU Intensive care unit
MOH Ministry of Health
MRIC Malaysian Registry of Intensive Care
MRO Multi-drug resistant organism
MRSA Methicillin-resistant Staphylococcus aureus
MSSA Methicillin-sensitive Staphylococcus aureus
NIV Non-invasive ventilation
NHSN National Healthcare Safety Network
No./n Number
O&G Obstetrics & Gynaecology
PaCO2 Partial pressure of arterial carbon dioxide
PaO2 Partial pressure of arterial oxygen
Refer. Referred
SAPS II Simplified Acute Physiologic Scoring System (Version II)
SD Standard deviation
SIRS Systemic inflammatory response syndrome
SMR Standardised mortality ratio
SN Staff nurse
SOFA Sequential Organ Failure Assessment
Sr Sister
SPSS Statistical Package for Social Sciences
VAP Ventilator-associated pneumonia
VCB Ventilator care bundle
VRSA Vancomycin-resistant Staphylococcus aureus
17
LIST OF TABLES
Page
Table 1 No. of ICU beds and ICU bed occupancy rate, by MOH hospitals 2011 - 2015………. 22
Table 2 ICU admissions, by individual hospital 2011 – 2015……….. 24
Table 3 Reporting rates, by individual hospital 2011 – 2015………... 28
Table 4 Intensive care referrals and refusal of admission, by individual hospital 2011 – 2015……….. 30
Table 5 Gender 2011 – 2015……….. 33
Table 6 Mean age 2011 – 2015……….. 33
Table 7 Ethnic groups 2015………... 34
Table 8 Length of ICU stay, by individual hospital 2011 – 2015………. 35
Table 9 Length of hospital stay, by individual hospital 2011 – 2015……….. 37
Table 10 Referring units, by category of ICU 2015 ………. 39
Table 11 Category of patients, by category of ICU 2015……… 40
Table 12 Category of patients in MOH hospitals 2011 – 2015………... 41
Table 13 Location before ICU admission, by category of ICU 2015………. 42
Table 14 Location before ICU admission in MOH hospitals 2011 – 2015……… 43
Table 15 Main organ failure on ICU admission, by category of ICU 2015………. 44
Table 16 Number of organ failure(s) on ICU admission, by category of ICU 2015………... 45
Table 17 Ten most common diagnoses leading to ICU admission 2015……….. 46
Table 18 Ten most common diagnoses leading to ICU admission using APACHE II diagnostic category 2015……….... 48
Table 19 Severe sepsis, ARDS and AKI within 24 hours of ICU admission 2015……….. 49
Table 20 Severe sepsis, ARDS and AKI within 24 hours of ICU admission, by individual hospital 2013 - 2015……… 50
Table 21 SAPS II score, by individual hospital 2011 – 2015………... 53
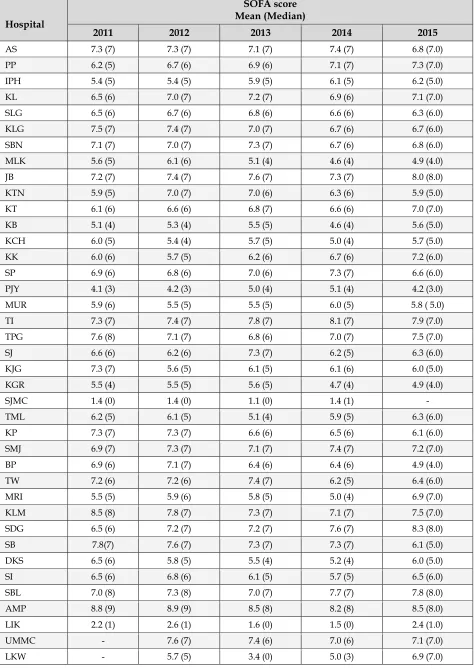
Table 22 SOFA score, by individual hospital 2011 – 2015……….. 55
Table 23 Invasive ventilation, non-invasive ventilation and reintubation, by category of ICU 2015…. 58 Table 24 Duration of invasive ventilation, by individual hospital 2011 – 2015……….. 61
Table 25 Renal replacement therapy and modalities of therapy, by category of ICU 2015……….. 62
Table 26 Tracheostomy, by category of ICU 2015………... 64
Table 27 Tracheotomy, by individual hospital 2015………... 65
Table 28 Total number of tracheostomies and % percutaneous trachestomies, by individual hospital 2011 -2015………... 66
Table 29 Withdrawal /withholding of therapy, by individual hospital 2011 – 2015……… 68
Table 30 Incidence of Ventilator-associated pneumonia, by individual hospital 2010 – 2015……… 71
Table 31 Onset of VAP from initiation of invasive ventilation, by individual hospital 2011 – 2015…… 72
Table 32 Bacteriological cultures in VAP, by category of ICU 2015………. 76
Table 33 Bacteriological cultures in VAP 2009 – 2015……… 77
Table 34 Extra length of mechanical ventilation, ICU stay and crude in-hospital mortality in patients with VAP 2013-2015………79
Table 35 Unplanned extubation, by individual hospital 2011 – 2015……… 80
Table 36 Pressure ulcer, by individual hospital 2011 - 2015 ………. 83
Table 37 ICU outcome, by category of ICU 2015………87
Table 38 Hospital outcome, by category of ICU 2015 ………87
Table 39 Crude in-ICU and in-hospital mortality rates, by individual hospital 2011 – 2015…………... 88
Table 40 Ten most common diagnoses leading to ICU admission in MOH hospitals and observed in-hospital mortality 2010 - 2015……….91
Table 41 Severe sepsis, ARDS and AKI within 24hrs of ICU admission and observed in-hospital mortality 2012– 2015………. 91
Table 42 Standardised mortality ratio, by individual hospital 2011 - 2015……… 92
Table 43 Ventilator care bundle compliance, by individual hospital 2011 – 2015………. 95
Table 44 Ventilator Utilisation Ratio, Ventilator Care Bundle Compliance and Incidence of Ventilator–associated Pneumonia, by individual hospital 2015………. 97
Table 45 Catheter utilisation ratio, central venous catheter care bundle compliance and incidence of central venous catheter- related bloodstream infection 2013 - 2015………. 99
Table 46 Bacteriological cultures in CVC-BSI 2013-2015……….… 102
Table 47 General comparison for dengue infection MOH ICUs 2010 - 2015………110
18
LIST OF FIGURES
Page
Figure 1 ICU admissions 2003 – 2015……….………. 25
Figure 2 ICU admissions, by participating centres 2015 ………. 26
Figure 3 Reporting rates by individual hospitals 2015………. 29
Figure 4 Age groups 2015 ………... 33
Figure 5 Ethnic groups 2015 ………... 34
Figure 6 Referring units, by category of ICU 2015 ………40
Figure 7 Category of patients, by category of ICU 2015 ………. 41
Figure 8 Category of patients, MOH hospitals 2004 – 2015……… 41
Figure 9 Location before ICU admission, by category of ICU 2015 ……….. 42
Figure 10 Location before ICU admission in MOH hospitals 2004 – 2015………. 43
Figure 11 Main organ failure on ICU admission, by category of ICU 2015……… 44
Figure 12 Number of organ failure(s) on ICU admission, by category of ICU2015……… 45
Figure 13 Ten most common diagnoses leading to ICU admission in MOH hospitals 2015…….. 47
Figure 14 Invasive ventilation, by category of ICU 2015………... 58
Figure 15 Non-invasive ventilation, by category of ICU 2015………. 59
Figure 16 Non-invasive ventilation, MOH hospitals 2005 – 2015……… 59
Figure 17 Reintubation by category of ICU 2015……… 60
Figure 18 Reintubation, MOH hospitals 2004 – 2015………. 60
Figure 19 Renal replacement therapy by category of ICU 2015………... 63
Figure 20 Modalities of renal replacement therapy, by category of ICU 2015 ………. 63
Figure 21 Techniques of tracheostomy, by category of ICU 2015 ………... 64
Figure 22 Ventilator associated pneumonia 2004 - 2015 ……….. 73
Figure 23 Ventilator associated pneumonia, by individual hospital 2015……….. 74
Figure 24 Bacteriological cultures in VAP, by category of ICU 2015 ………. 77
Figure 25 Common bacteriological cultures in VAP 2008 – 2015………. 78
Figure 26 Unplanned extubation, by individual hospital 2015……… 82
Figure 27 Pressure ulcers, by individual hospital 2015………. 85
Figure 28 Crude in-ICU and in-hospital mortality rates, by individual hospital 2015………. 90
Figure 29 Ventilator care bundle compliance and VAP 2007 – 2015……….96
Figure 30 Catheter utilisation ratio and incidence of central venous catheter-related bloodstream infection by hospital 2015………. 101
Figure 31 Compliance to Early Mobility in ICU protocol by hospital 2015……… 105
19
INTRODUCTION
The National Audit on Adult Intensive Care Units (NAICU) was established in 2002 as a
quality improvement initiative to systematically review the intensive care practices in
Malaysia and where possible, to introduce remedial measures to improve outcome. To date,
this audit has published twelve yearly reports and introduced several quality measures such
as ventilator care bundle, central venous catheter care bundle, early mobility in ICU and the
SSKIN bundle.
In 2009, the NAICU was renamed the Malaysian Registry of Intensive Care (MRIC). This
report is the eighth for MRIC, but thirteenth in the series.
The objectives of this registry are to:
1.
Establish a database of patients admitted to the adult ICUs
2.
Review the clinical practices of intensive care
3.
Determine clinical outcome
4.
Determine the resources and delivery of intensive care service
5.
Evaluate the impact of quality improvement measures on patient care
6.
Provide comparisons of performance of participating centres against national and
international standards
7.
Conduct healthcare research related to intensive care
In 2002, 14 state hospitals were first recruited into the audit. The number of centres increased
to 22 in 2005. In 2006, 9 more centres were added to the list of participating sites, including
one private hospital in Selangor. In 2010, 6 more centres were added to the list of 31
participating hospitals. In 2012, the total number of participating centres expanded to 51
with 49 MOH hospitals, 1 private hospital and 1 university hospital. In 2015, the private
hospital withdrew from the registry.
This report describes the intensive care practices and outcomes in 49 ICUs in MOH and 1
ICU in a university hospital.
Data Collection and Verification
Data were collected prospectively by trained nurses (source data providers) and specialists
(site investigators) based on a written protocol. Data was initially collected on a standard
e-case report form for each patient. Since 1
stJanuary 2010, data were entered directly in a
central depository via a web-based programme by individual centres.
20
Merged data were ‘cleaned’ and verified before being an
alysed using SPSS version 20.0.0.
This report is based on all admissions into the 50 participating ICUs from 1
stJanuary to 31
stDecember 2015. The total number of admissions in 2015 was 41,065 out of which 1470 (3.6%)
were readmissions. For patients with multiple ICU admissions, only the first admission was
included in the analysis. Hence, analysis was done on 39,595 admissions.
Due to missing and inconsistent data, the sum total of some variables shown in the tables
may not add up to the actual number of admissions.
Data Limitations
Limitations to the registry data were mainly related to data collection and data entry. Some
of the participating ICUs experienced rapid turnover of their site investigators and source
data providers resulting in under-reporting and data inconsistencies. Data from several
centres with low reporting rates were excluded from some of the analysis of the variables.
Format of Report
The format of this report follows the patient
’s
journey in four sections: demographics,
interventions, complications and outcomes. Information is reported on a total of 39,595 ICU
admissions.
In this report, information was provided for individual centres. Wherever appropriate,
comparisons were made between three categories of hospitals based on the number of ICU
admissions. MOH hospitals were divided into three categories: centres with 1000 admissions
and more, centres with 500 to 999 admissions and those with less than 500 admissions.
Where relevant, trends of certain variables over the years were reported.
21
SECTION A:
GENERAL INFORMATION
1.
Number of ICU beds
2.
Bed occupancy rates
3.
ICU admissions
4.
Reporting rates
22
Table 1 :
No. of ICU beds and bed occupancy rate, by MOH hospitals 2011
–
2015
Hospital
Number of functional ICU beds (as of 31-12-2015)
Median ICU bed occupancy rate %
2011 2012 2013 2014 2015
AS 24 87.0 96.7 93.3 88.8 86.1
PP 23 89.9 88.7 90.9 90.5 94.0
IPH 26 107.0 106.0 104.0 109.0 107.0
KL 43 107.5 111.7 110.6 114.1 112.7
SLG 25 111.4 99.8 101.8 92.7 99.2
KLG 32 87.8 108.3 105.9 112.9 110.8
SBN 8 118.4 114.6 108.3 111.7 112.5
MLK 22 106.0 107.9 97.5 90.7 91.6
JB 32 106.2 105.6 109.4 109.0 107.9
KTN 21 105.2 106.4 106.5 110.3 127.7
KT 21 102.0 103.6 104.6 94.2 105.2
KB 21 80.8 80.0 96.2 109.2 92.2
KCH 15 116.6 125.9 101.0 107.6 104.5
KK 23 101.7 93.4 95.9 90.9 98.6
SP 16 84.6 84.9 92.5 82.7 80.3
PJY 11 78.2 75.2 71.2 84.7 94.7
MUR 8 82.4 97.5 97.5 94.2 90.1
TI 4 101.3 123.8 105.2 114.0 112.0
TPG 20 103.2 92.7 84.7 81.4 102.0
SJ 10 89.6 99.1 80.2 81.3 101.0
KJG 6 78.9 77.2 77.1 84.2 82.5
KGR 5 63.3 77.3 78.1 80.8 94.5
TML 10 104.0 113.0 127.0 88.8 82.1
KP 8 68.5 61.8 72.4 91.7 80.9
SMJ 8 82.4 92.7 85.5 92.4 83.5
BP 7 69.0 87.0 79.6 74.8 72.0
TW 7 60.6 80.7 70.0 78.2 61.6
MRI 8 72.7 76.1 79.6 101.3 95.0
KLM 7 98.9 100.5 95.4 100.2 102.2
SDG 13 88.2 50.4 84.4 85.7 91.6
SB 17 99.2 60 120.5 144.0 151.7
DKS 18 87.9 87.9 99.1 82.2 79.2
SI 22 87.3 86.2 90.2 85.1 90.3
SBL 38 108.1 94.6 94.0 115.7 94.6
AMP 12 85.5 45.7 82.9 74.4 90.4
LIK 9 76.7 76.9 106.0 103.4 72.6
LKW 4 - 67.0 67.4 59.1 69.0
23
SLR 7 - 76.0 71.0 79.3 76.0
PD 4 - 85.5 65.6 86.0 89.8
KKR 6 - 69.8 85.2 87.1 86.0
SGT 4 - 58.1 89.7 75.0 70.8
TM 5 - 68.7 74.0 113.2 151.4
KEM 2 - 59.6 50.9 - -
KLP 3 - 21.8 53.0 54.2 82.6
LAB 5 - 30.7 41.2 45.5 48.5
KEN 4 - 90.4 78.0 80.3 70.0
BIN 5 - 88.3 63.2 59.7 57.0
LD 4 - 104.2 101.2 103.1 88.6
Total 660 - - - -
Median - 88.6 86.2 90.2 90.5 91.6
The total number of ICU beds in the 49 MOH hospitals as of 31
stDecember 2015 was 660
with a median bed occupancy rate (BOR) of 91.6%. There was a 3.6% increase (23 beds)
in the
number of ICU beds from the previous year.
The BOR was calculated based on throughput census and was reported to the head of the
anaesthesia and intensive care services. There was a wide variation in the BOR across the
centers. Seven hospitals, IPH, KL, SBN, JB, KTN, KCH and TI continuously had their bed
occupancy rate more than 100% for the past 5 years while LAB had a consistently low BOR
less than 50%. SB and TM had bed occupancy rates of more than 150%in 2015. KEM did not
report their BOR for the past two years.
Bed occupancy is used as a measure to indicate the activity of a unit in terms of its maximum
capacity. There are several methods of calculating bed occupancy and the impact of these
methodological differences will tend to be greatest in specialised areas such as intensive care
units, where the duration of admission is generally short but highly variable, and
throughput is high. If it is measured in whole numbers of days, intensive care units can show
an occupancy of greater than 100%, as more than one patient may use a particular bed on a
given day.
24
Table 2 :
ICU admissions, by individual hospital 2011
–
2015
Hospital
2011 2012 2013 2014 2015
n (%) n (%) n(%) n (%) n (%)
AS 1212 (4.1) 1201 (3.5) 1347 (3.6) 1331 (3.4) 1363 (3.4)
PP 1198 (4.0) 1287 (3.8) 1121 (3.0) 1134 (2.9) 1172 (3.0)
IPH 1140 (3.8) 926 (2.7) 1203 (3.2) 1217 (3.1) 1328 (3.4)
KL 1842 (6.2) 1971 (5.8) 1905 (5.1) 2144 (5.5) 1985 (5.0)
SLG 1141 (3.8) 1289 (3.8) 1507 (4.0) 1426 (3.7) 1392 (3.5)
KLG 1608 (5.4) 2136 (6.3) 2065 (5.5) 2281 (5.9) 2184 (5.5)
SBN 554 (1.9) 537 (1.6) 471 (1.3) 541 (1.4) 542 (1.4)
MLK 1593 (5.3) 1694 (5.0) 1673 (4.5) 1432 (3.7) 1430 (3.6)
JB 1685 (5.7) 1752 (5.2) 1931 (5.2) 1687 (4.3) 1719 (4.3)
KTN 612 (2.1) 641 (1.9) 837 92.2) 1062 (2.7) 1043 (2.6)
KT 1207 (4.1) 1363 (4.0) 1180 (3.2) 1172 (3.0) 1398 (3.5)
KB 1125 (3.8) 1286 (3.8) 1337 (3.6) 1607 (4.1) 1267 (3.2)
KCH 643 (2.2) 854 (2.5) 950 (2.5) 1140 (2.9) 1143 (2.9)
KK 843 (2.8) 954 (2.8) 1022 (2.7) 987 (2.5) 925 (2.3)
SP 270 (0.9) 159 (0.5) 583 (1.6) 953 (2.4) 1015 (2.6)
PJY 537 (1.8) 574 (1.7) 606 (1.6) 654 (1.7) 764 (1.9)
MUR 473 (1.6) 636 (1.9) 675 (1.8) 600 (1.5) 611 (1.5)
TI 308 (1.0) 384 (1.1) 401 (1.1) 406 (1.0) 424 (1.1)
TPG 860 (2.9) 1203 (3.5) 1348 (3.6) 1182 (3.0) 1126 (2.8)
SJ 579 (1.9) 644 (1.9) 413 (1.1) 409 (1.1) 475 (1.2)
KJG 341 (1.1) 371 (1.1) 321 (0.9) 284 (0.7) 464 (1.2)
KGR 298 (1.0) 350 (1.1) 322 (0.9) 341 (0.9) 355 (0.9)
SJMC 2018 (6.8) 1467 (4.3) 1335 (3.6) 870 (2.2) -
TML 543 (1.8) 436 (1.3) 599 (1.6) 837 (2.2) 828 (2.1)
KP 359 (1.2) 334 (1.0) 394 (1.1) 512 (1.3) 545 (1.4)
SMJ 380 (1.3) 403 (1.2) 376 (1.0) 432 (1.1) 441 (1.1)
BP 454 (1.5) 415 (1.2) 459 (1.2) 459 (1.2) 546 (1.4)
TW 274 (0.9) 433 (1.3) 449 (1.2) 498 (1.3) 444 (1.1)
MRI 385 (1.3) 478 (1.4) 481 (1.3) 428 (1.1) 377 (1.0)
KLM 498 (1.7) 601 (1.8) 561 (1.5) 555 (1.4) 526 (1.3)
SDG 883 (3.0) 875 (2.6) 851 (2.3) 835 (2.1) 756 (1.9)
SB 569 (1.9) 490 (1.4) 506 (1.4) 431 (1.1) 1275 (3.2)
DKS 526 (1.8) 526 (1.6) 964 (2.6) 950 (2.4) 923 (2.3)
SI 647 (2.2) 806 (2.4) 970 (2.6) 1131 (2.9) 1473 (3.7)
SBL 1260 (4.2) 1583 (4.7) 1922 (5.1) 2284 (5.9) 2313 (5.8)
AMP 553 (1.9) 572 (1.7) 566 (1.5) 634 (1.6) 671 (1.7)
LIK 376 (1.3) 270 (0.8) 517 (1.4) 353 (0.9) 154 (0.4)
25
LKW - 157 (0.5) 180 (0.5) 165 (0.4) 195 (0.5)
BM - 38 (0.1) 158 (0.4) 141 (0.4) 218 (0.6)
SLR - 154 (0.5) 225 (0.6) 223 (0.6) 201 (0.5)
PD - 204 (0.6) 245 (0.7) 265 (0.7) 230 (0.6)
KKR - 149 (0.4) 240 (0.6) 260 (0.7) 391 (1.0)
SGT - 127 (0.4) 159 (0.4) 150 (0.4) 290 (0.7)
TM - 17 (0.1) 127 (0.3) 160 (0.4) 308 (0.8)
KEM - 94 (0.3) 105 (0.3) 91 (0.2) 179 (0.5)
KLP - 7 (0.0) 116 (0.3) 96 (0.2) 107 (0.3)
LAB - 107 (0.3) 165 (0.4) 166 (0.4) 184 (0.5)
KEN - 82 (0.2) 161 (0.4) 144 (0.4) 136 (0.3)
BIN - 213 (0.6) 260 (0.7) 283 (0.7) 315 (0.8)
LD - 168 (0.5) 244 (0.7) 217 (0.6) 150 (0.4)
Total 29794 (100) 33892 (100) 37436 (100) 38904 (100) 39595 (100)
Figure 1 :
ICU admissions 2003 – 2015
0 5000 10000 15000 20000 25000 30000 35000 40000 45000
2003 2004 2005 2006 2007 2008 2009 2010 2011 2012 2013 2014 2015
Year
N
u
m
b
e
r o
f ad
m
is
si
o
n
s...
26
Figure 2 :
ICU admissions, by participating centres 2015
2313
0 500 1000 1500 2000 2500
SBL
27
The number of admissions had increased over the years in the MOH hospitals. There was an
increase of 33% over the past five years from 2011 to 2015. This was attributed to the increase
in the number of participating centres, increase in the number of ICU beds in the existing
centres and an increase in ICU admissions.
For the initial cohort of 14 hospitals recruited in 2002, the number of admissions increased
from 16,403 to 18,891 (an increase of 15%) over the last 5 years. There was an increase of 30% in
the number of ICU beds from 259 to 336 over the same period of time for the same cohort.
Readmission within 48 hours is commonly used as an indicator of intensive care patient
management, as it might reflect premature ICU discharge or substandard ward care. Although
readmission is associated with high mortality, it is unclear whether it reflects substandard
practices within a hospital. Low readmission rate may be due to inability to readmit patients
due to unavailability of ICU beds.
The readmission rate within the first 48 hours of ICU discharge for the 49 MOH centres was
1.5% in 2015. This rate has varied from 1.3% to 2.1% over the past five years. This is one of the
intensive care unit key performance indicators and the standard is set at less than 3%.
In a retrospective study done from 2001 to 2007, in 106 ICUs in United States of America,
approximately 2% of ICU patients discharged to the ward were readmitted within 48 hours
[1].
28
Table 3 :
Reporting rates, by individual hospital 2011
–
2015
Hospital 2011
%
2012 %
2013 %
2014 %
2015 %
AS 98.2 93.1 99.6 91.5 94.9
PP 90.1 96.2 92.2 94.1 94.4
IPH 99.2 97.5 95.9 91.0 97.7
KL 98.7 98.5 95.0 94.7 95.0
SLG 95.0 97.6 95.3 92.8 96.5
KLG 86.0 97.3 97.7 95.9 95.9
SBN 99.5 99.3 97.3 96.8 99.1
MLK 99.5 98.8 95.2 94.8 93.9
JB 99.8 97.2 95.7 95.4 97.2
KTN 99.0 97.2 124.4* 88.4 88.1
KT 99.8 99.1 95.0 90.4 95.2
KB 94.4 98.7 83.0 100.7* 92.7
KCH 94.3 95.3 89.6 93.2 95.3
KK 95.4 94.9 95.2 95.3 97.9
SP 53.1 30.8 106.0* 92.7 95.4
PJY 99.1 98.0 92.9 86.6 87.2
MUR 97.4 94.6 98.0 92.0 96.2
TI 98.4 91.2 90.3 94.0 96.4
TPG 94.0 99.3 95.5 94.3 82.1
SJ 98.5 98.3 85.7 73.4 39.8
KJG 95.5 99.7 75.2 57.7 90.6
KGR 98.1 98.6 94.2 95.5 97.5
TML 81.4 62.6 68.3 91.0 90.3
KP 100.0 66.4 51.0 94.6 88.5
SMJ 100.0 99.5 97.9 94.9 99.8
BP 98.5 97.9 106.3* 97.2 97.0
TW 91.7 98.6 95.5 94.0 96.7
MRI 88.5 99.2 97.6 78.0 69.8
KLM 98.9 98.5 94.1 92.2 93.8
SDG 94.9 90.5 108.4* 97.0 97.0
SB 73.1 70.0 46.7 25.7 92.2
DKS 99.6 95.5 92.7 90.3 92.6
SI 86.3 94.6 97.3 95.0 93.8
SBL 100.0 90.7 82.0 89.6 93.1
AMP 85.2 100.0 97.1 119.6* 97.4
LIK 60.9 57.4 80.7 59.9 27.0
LKW - 69.8 87.4 82.5 97.0
BM - 11.3 39.4 34.7 60.4
29
* These hospitals had reporting rates more than 100%.
The reporting rate is calculated by comparing the number of ICU admissions reported to the
MRIC and to the national census, collected by the Head of Anaesthesia service. The total
number reported to the MRIC should be equal or slightly less than that of the national
census, as patients who were still in hospital on 31
stJanuary 2015 were excluded in the
analysis.
The following hospitals have consistently contributed high reporting rates of over 90% over
the last 5 years: AS, PP, IPH, KL, SLG, SBN, MLK, JB, KT, KB, KCH, KK, MUR, TI, KGR, SMJ,
BP, TW, KLM, SDG, PD, KKR, LAB, DKS, SI and AMP.
The following hospitals had low reporting rates of less than 70% in 2015: LIK (27%), SJ (40%),
BM (60%), LD (61%), SLR (62%), KEN
(65%) and MRI (69.8%).
KEM did not report to the national census-hence reporting rate could not be
obtained.
Figure 3 :
Reporting rates by individual hospitals 2015
30
Table 4 :
Intensive care referrals and refusal of admission, by individual hospital
2011
–
2015
Hosp
2011 2012 2013 2014 2015
No. refer.
% denied
adm.
No. refer.
% denied
adm.
No. refer.
% denied
adm.
No. refer.
% denied
adm.
No. refer.
% denied
adm.
AS * * * * * * * * * *
PP 942 70.2 1329 67.8 1365 73.6 1145 66.1 1463 67.0
IPH 1525 66.7 1834 63.4 1639 70.2 1852 62.2 1781 65.8
KL 1971 32.8 2364 30.4 2515 30.1 3393 30.0 3294 31.5
SLG 448 27.2 1173 24.2 1537 35.3 1449 28.2 1498 35.7
KLG 2264 33.1 2458 21.2 2576 23.1 31.40 21.2 2882 20.9
SBN 2125 60.8 1929 56.0 1640 51.6 853 49.1 847 59.3
MLK 919 55.2 993 61.2 1285 73.9 2451 43.0 2444 50.2
JB 2069 39.8 2205 28.8 2634 33.7 2495 40.9 1333 36.5
KTN 791 42.4 455 39.6 608 40.0 241 29.5 224 39.7
KT 150 18.0 544 26.3 183 27.9 443 19.6 * *
KB 1431 50.1 1417 41.5 1884 46.9 2817 46.8 2468 52.6
KCH 477 51.4 1132 57.8 1271 53.1 1474 52.7 1699 44.6
KK 1340 16.0 1282 13.0 1619 21.7 1364 17.9 1485 16.4
SP * * 254 44.1 562 46.1 74 21.6 * *
PJY * * 36 5.6 486 0.6 * * * *
MUR 685 31.4 903 34.3 1223 31.5 1368 28.7 1289 27.4
TI 54 40.7 170 42.9 156 49.1 440 49.3 585 60.3
TPG 958 0.5 1498 10.4 2004 12.4 1360 6.5 1657 12.4
SJ 625 31.2 592 34.1 813 41.7 657 28.9 489 32.9
KJG 67 19.4 * * 488 22.1 145 37.9 52 28.9
KGR 201 20.4 405 12.8 390 16.7 397 15.1 260 12.3
TML 921 35.6 875 38.5 836 37.6 834 38.3 927 31.6
KP 412 7.3 412 9.7 587 21.8 684 14.0 780 14.0
SMJ 191 13.1 145 13.8 122 12.3 232 2.6 111 7.2
BP 454 2.6 372 2.2 458 3.7 443 1.1 529 0.6
TW 297 * 505 3.2 591 5.4 844 19.1 1026 21.5
MRI 81 18.5 132 4.6 335 22.4 61 13.1 15 33.3
KLM 509 2.9 710 5.2 699 10.7 730 6.6 825 20.9
SDG 712 14.2 506 22.9 1221 10.2 1525 12.0 1069 27.3
SB * * * * 565 22.5 506 22.7 1522 30.2
DKS 10 50.0 214 33.6 81 26.0 246 20.3 388 29.4
SI 635 34.8 547 21.4 734 31.7 484 28.5 111 27.9
SBL * * 689 17.4 636 14.8 1607 9.2 1588 11.3
AMP 149 39.6 716 26.7 1333 29.5 1419 21.9 1185 31.5
LIK * * * * * * * * * *
UMMC - - 657 57.5 955 41.8 55 34.6 * *
LKW - - * * 171 0.6 * * * *
31
SLR - - 55 10.9 166 7.2 277 2.5 282 1.7
PD - - 216 7.4 249 1.6 288 0.7 247 13.0
KKR - - 49 24.5 105 27.6 263 36.5 242 23.1
SGT - - * * * * * * * *
TM - - * * 95 3.2 148 10.1 308 16.2
KEM - - 60 1.7 119 12.6 122 11.5 401 27.4
KLP - - * * 100 3.0 99 6.1 104 1.0
LAB - - * * * * * * * *
KEN - - 46 4.4 * * * * * *
BIN - - * * * * * * * *
LD - - * * * * 67 43.3 252 34.9
Total 25321 34.2 31341 32.0 37962 29.4 39586 29.8 38809 31.7
*
Missing dataThe reason for ICU refusal for the purpose of this registry was limited to the unavailability of
ICU beds. In 2015, 31.7% of patients were denied ICU admission.
Over the past five years, the percentage of patients denied ICU admission has not change
much despite the overall increase in the number of ICU beds in most MOH hospitals.
32
SECTION B:
PATIENT CHARACTERISTICS
1.
Gender
2.
Age
3.
Ethnic groups
4.
Length of ICU stay
5.
Length of hospital stay
6.
Referring units
7.
Category of patients
8.
Location before ICU admission
9.
Organ failures
10.
Diagnosis leading to ICU admission
11.
Severe sepsis, ARDS and AKI within 24hrs of ICU
admission
33
Table 5 :
Gender 2011-2015
Gender
2011 n (%)
2012 n (%)
2013 n (%)
2014 n (%)
2015 n (%)
Male 17788 (59.7) 20295 (60.0) 22331 (59.7) 22926 (59.0) 23382 (59.2)
Female 11968 (40.2) 13554 (40.0) 15048 (40.3) 15895 (41.0) 16138 (40.8)
The ratio of male to female patients (3:2) has remained fairly constant over the past five
years.
Table 6 :
Mean age (years) 2011 – 2015
Age 2011 2012 2013 2014 2015
All ages,
Mean + SD yrs 46.5± 20.7 46.6 ± 20.7 46.5 ± 20.6 45.9 + 20.6 45.9 + 20.2
Age ≥ 18 years
Mean + SD yrs 50.2± 18.0 50.3 ± 17.8 50.3 ± 17.7 49.7 + 17.8 49.5 + 17.5
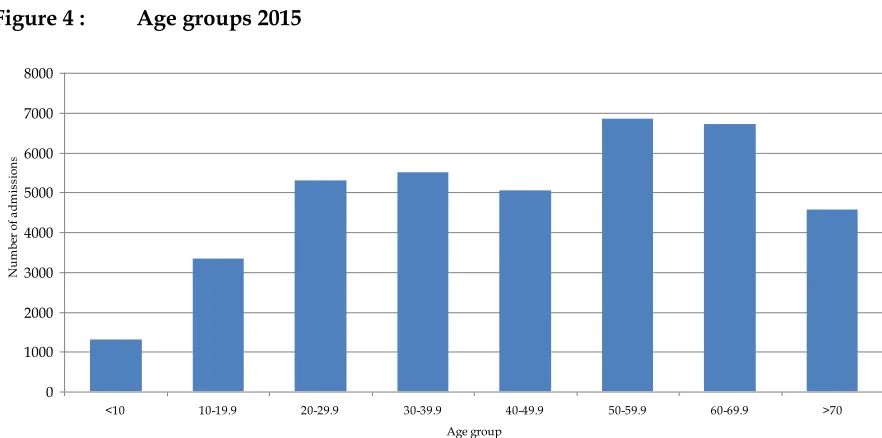
The average age for all age groups was 45.9 + 20.2 years (median 47.8 years). For adult
patients, with age exceeding 18 years, the average age was 49.5 + 17.5 years (median 51.0
years). The average age of patients admitted to ICUs has remained fairly similar over the last
five years.
Figure 4 :
Age groups 2015
0 1000 2000 3000 4000 5000 6000 7000 8000
<10 10-19.9 20-29.9 30-39.9 40-49.9 50-59.9 60-69.9 >70
Age group
N
u
m
b
er
o
f
a
dm
is
si
o
n
s,
34
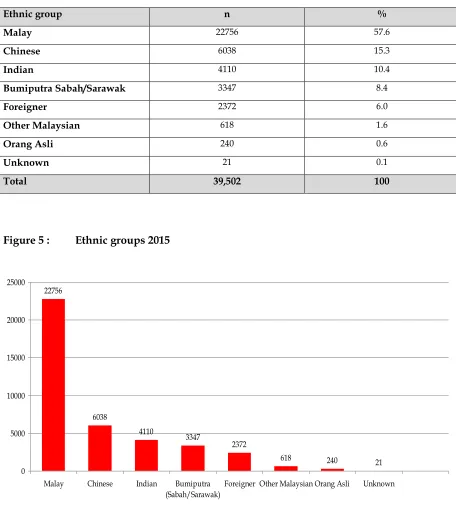
Table 7 :
Ethnic groups 2015
Ethnic group n %
Malay 22756 57.6
Chinese 6038 15.3
Indian 4110 10.4
Bumiputra Sabah/Sarawak 3347 8.4
Foreigner 2372 6.0
Other Malaysian 618 1.6
Orang Asli 240 0.6
Unknown 21 0.1
Total 39,502 100
Figure 5 :
Ethnic groups 2015
22756
6038
4110
3347
2372
618 240 21
0 5000 10000 15000 20000 25000
Malay Chinese Indian Bumiputra
(Sabah/Sarawak)
Foreigner Other Malaysian Orang Asli Unknown
35
Table 8 :
Length of ICU stay, by individual hospital 2011
–
2015
Hospital
Mean (Median), days
2011 2012 2013 2014 2015
AS 4.6 (2.8) 5.6 (3.1) 4.9 (2.9) 4.6 (2.8) 4.5 (2.7)
PP 5.1 (2.5) 5.4 (2.6) 5.9 (2.7) 6.2 (2.9) 6.1 (2.9)
IPH 5.3 (2.6) 5.5 (2.9) 5.9 (3.0) 6.1 (3.2) 6.4 (3.3)
KL 4.7 (2.8) 5.1 (2.8) 5.0 (2.7) 4.6 (2.4) 4.9 (2.5)
SLG 4.4 (2.4) 4.5 (2.6) 4.2 (2.0) 4.7 (2.5) 5.1 (2.5)
KLG 3.6 (2.0) 4.1 (2.1) 4.3 (1.9) 4.0 (2.0) 4.5 (2.2)
SBN 4.8 (2.7) 4.9 (2.7) 5.9 (2.9) 5.0 (2.7) 5.0 (2.7)
MLK 4.0 (2.7) 4.1 (2.1) 4.1 (2.1) 4.8 (2.5) 4.6 (2.6)
JB 5.2 (3.0) 5.2 (3.0) 4.7 (2.8) 5.4 (3.1) 5.4 (3.3)
KTN 6.3 (3.4) 6.3 (3.6) 5.6 (3.3) 5.5 (2.8) 6.1 (3.0)
KT 4.0 (2.3) 4.1 (2.2) 4.6 (2.7) 4.1 (2.1) 4.0 (2.0)
KB 4.7 (1.9) 4.7 (2.3) 4.9 (2.3) 4.2 (2.3) 5.4 (2.5)
KCH 5.6 (3.0) 5.2 (2.9) 4.7 (2.6) 3.9 (2.0) 4.0 (2.0)
KK 6.3 (3.7) 6.3 (3.8) 6.2 (3.6) 5.9 (3.6) 7.0 (3.9)
SP 4.0 (2.4) 7.6 (2.2) 4.7 (2.6) 4.8 (2.8) 4.5 (2.6)
PJY 3.2 (1.5) 3.2 (1.5) 3.5 (1.8) 3.9 (1.7) 3.8 (1.7)
MUR 4.8 (2.4) 3.5 (1.8) 3.0 (1.8) 3.7 (1.9) 3.1 (1.9)
TI 4.0 (2.0) 3.5 (2.1) 3.0 (1.8) 3.2 (1.7) 2.8 (1.6)
TPG 7.0 (3.7) 5.1 (2.7) 4.1 (2.7) 4.7 (2.6) 5.2 (2.7)
SJ 4.3 (2.1) 4.2 (2.1) 6.2 (3.1) 6.5 (3.5) 5.0 (2.5)
KJG 4.0 (2.7) 4.6 (2.9) 4.7 (3.2) 4.8 (3.1) 3.8 (2.6)
KGR 3.4 (1.7) 4.3 (2.1) 4.2 (2.6) 4.2 (2.1) 4.0 (2.4)
SJMC 2.4 (1.3) 2.7 (1.6) 2.6 (1.6) 2.5 (1.6) -
TML 5.1 (3.0) 6.4 (3.5) 4.8 (2.6) 4.7 (2.7) 5.0 (2.8)
KP 5.8 (3.1) 5.7 (3.0) 5.5 (2.9) 4.7 (2.7) 4.1 (2.6)
SMJ 3.7 (2.3) 3.9 (2.5) 3.6 (2.2) 3.2 (1.9) 3.4 (2.1)
BP 4.3 (2.2) 5.7 (3.3) 4.5 (2.8) 4.4 (2.7) 3.7 (2.4)
TW 3.5 (2.2) 3.5 (2.4) 3.8 (2.5) 4.2 (2.5) 4.7 (2.4)
MRI 4.4 (2.3) 5.2 (2.5) 4.5 (2.6) 4.9 (3.0) 5.1 (3.7)
KLM 3.6 (2.0) 3.3 (1.9) 3.2 (1.7) 3.3 (1.8) 3.8 (2.0)
SDG 4.8 (2.7) 4.8 (2.8) 4.4 (2.2) 4.4 (2.4) 5.6 (2.7)
SB 4.7 (2.4) 5.1 (2.5) 5.4 (3.3) 6.8 (4.0) 4.0 (2.2)
DKS 6.0 (3.1) 5.1 (3.1) 4.5 (2.5) 3.7 (1.9) 4.7 (2.6)
SI 7.0 (3.7) 6.2 (3.3) 5.4 (2.7) 5.1 (2.6) 4.3 (2.1)
SBL 6.0 (3.2) 5.7 (3.1) 5.5 (3.1) 4.8 (2.7) 5.1 (3.0)
AMP 5.4 (3.2) 5.0 (2.9) 5.4 (2.9) 5.7 (3.0) 4.8 (2.7)
LIK 2.5 (1.6) 3.5 (1.8) 3.5 (1.9) 4.1 (2.6) 3.3 (2.0)
UMMC - 7.2 (3.8) 5.6 (3.3) 5.5 (2.6) 5.9 (2.8)
LKW - 5.3 (2.0) 4.1 (2.0) 3.7 (2.1) 4.6 (2.5)
BM - - 9.0 (4.3) 8.8 (5.6) 5.9 (3.4)
SLR - 6.3 (3.2) 6.3 (3.0) 6.6 (3.0) 6.2 (3.0)
36
KKR - 5.6 (2.9) 5.7 (3.4) 5.8 (3.2) 5.0 (2.9)
SGT - 4.5 (2.8) 3.3 (2.3) 3.7 (2.1) 3.1 (1.9)
TM - 3.5 (1.9) 3.8 (2.5) 4.5 (3.3) 3.8 (2.4)
KEM - 3.3 (2.6) 4.2 (2.8) 5.0 (2.6) 3.0 (2.1)
KLP - 1.3 (0.8) 2.9 (1.5) 3.0 (2.0) 6.9 (3.2)
LAB - 4.6 (2.2) 4.4 (1.9) 4.1 (1.8) 4.9 (2.8)
KEN - 6.5 (2.9) 5.1 (2.9) 5.4 (3.0) 4.5 (2.9)
BIN - 5.4 (2.8) 3.9 (2.1) 3.9 (2.3) 3.8 (2.2)
LD - 5.7 (2.7) 4.8 (2.7) 5.1 (3.4) 6.1 (3.9)
Total 4.7 (2.4) 4.8 (2.6) 4.7 (2.5) 4.7 (2.5) 4.8 (2.6)
The average length of ICU stay in 2015 was 4.8 days. This has not changed much over the past 5
years.
The median length of stay was 2.6 days.
37
Table 9 :
Length of hospital stay, by individual hospital 2011
–
2015
Hospital
Mean (Median), days
2011 2012 2013 2014 2015
AS 14.5 (9.5) 15.1 (9.2) 14.6 (8.8) 13.1 (7.9) 13.4 (8.8)
PP 19.0 (11.5) 19.5 (12.0) 19.2 (12.0) 20.2 (12.5) 18.2 (11.9)
IPH 15.4 (9.3) 16.0 (10.6) 15.2 (9.8) 15.3 (10.0) 15.4 (9.8)
KL 19.1 (11.0) 17.7 (10.7) 16.5 (10.2) 14.8 (8.6) 15.3 (8.4)
SLG 16.7 (11.0) 17.3 (12.1) 15.2 (10.5) 15.2 (9.9) 16.5 (10.3)
KLG 13.6 (8.4) 12.2 (7.6) 12.5 (7.80 11.5 (7.4) 13.5 (8.4)
SBN 19.9 (11.0) 17.0 (10.6) 18.5 (10.7) 17.5 (10.4) 18.4 (11.1)
MLK 14.2 (9.3) 16.0 (10.0) 14.4 (8.6) 16.2 (9.6) 14.4 (8.7)
JB 14.6 (10.1) 14.7 (9.9) 13.6 (9.3) 14.2 (9.4) 13.5 (9.3)
KTN 17.1 (12.1) 18.0 (12.3) 15.8 (10.8) 16.6 (10.4) 15.8 (10.0)
KT 12.6 (8.3) 14.5 (9.7) 14.6 (9.80) 13.5 (8.8) 12.9 (8.5)
KB 14.5 (10.0) 16.5 (10.0) 14.4 (9.6) 12.0 (8.0) 16.1 (9.6)
KCH 20.5 (12.6) 21.4 (13.7) 19.2 (12.1) 19.5 (11.8) 19.4 (12.0)
KK 21.4 (14.1) 19.9 (11.7) 17.7 (11.1) 16.4 (10.9) 18.4 (10.8)
SP 10.8 (7.4) 14.0 (8.2) 12.9 (8.9) 12.6 (8.4) 11.9 (8.0)
PJY 11.6 (8.0) 11.7 (8.6) 13.2 (8.2) 12.4 (7.4) 12.4 (7.6)
MUR 16.3 (10.3) 22.0 (10.5) 13.6 (8.4) 13.6 (9.1) 13.7 (8.6)
TI 12.5 (8.4) 14.2 (9.6) 11.4 (8.2) 11.3 (7.5) 10.0 (7.0)
TPG 15.1 (10.3) 12.6 (8.3) 10.7 (7.8) 11.7 (8.0) 12.7 (8.2)
SJ 12.9 (9.1) 13.0 (8.2) 14.3 (9.7) 15.9 (11.1) 14.1 (9.1)
KJG 11.2 (7.9) 13.5 (8.3) 12.5 (8.6) 13.4 (8.7) 10.1 (7.0)
KGR 12.6 (8.2) 18.3 (10.9) 14.2 (9.7) 13.8 (7.9) 11.6 (8.6)
TML 14.6 (9.9) 14.5 (10.7) 13.1 (9.3) 11.9 (8.0) 11.8 (7.6)
KP 12.8 (8.7) 15.5 (9.3) 13.6 (8.5) 13.3 (8.0) 11.3 (7.1)
SMJ 12.1 (7.1) 12.0 (7.2) 10.5 (7.1) 8.4 (6.1) 9.2 (6.3)
BP 11.4 (8.0) 13.6 (9.5) 14.0 (9.0) 15.9 (9.7) 11.2 (7.6)
TW 15.3 (9.1) 13.0 (8.4) 14.1 (9.1) 13.5 (8.6) 13.7 (7.8)
MRI 15.0 (9.6) 14.0 (10.8) 12.4 (9.9) 13.1 (10.0) 14.8 (10.7)
KLM 11.4 (7.3) 12.6 (7.8) 11.7 (7.9) 11.6 (7.6) 13.2 (8.0)
SDG 14.7 (9.0) 14.6 (9.4) 14.3 (8.1) 13.2 (7.5) 14.8 (7.8)
SB 13.1 (8.1) 13.1 (8.3) 15.7 (10.5) 15.3 (10.0) 13.9 (8.3)
DKS 13.7 (10.1) 12.4 (8.2) 11.4 (7.6) 11.8 (6.8) 13.5 (8.0)
SI 19.7 (12.2) 16.0 (9.7) 14.6 (9.2) 15.3 (9.3) 13.4 (8.0)
SBL 19.5 (11.2) 19.2 (10.8) 17.0 (9.8) 15.4 (7.9) 16.3 (9.2)
AMP 15.1 (10.2) 15.4 (10.5) 15.1 (10.7) 16.1 (10.5) 14.2 (10.4)
LIK 11.6 (7.6) 18.4 (9.7) 15.3 (10.9) 15.0 (10.6) 11.1 (7.5)
UMMC - 25.2 (16.2) 22.0 (12.4) 19.7 (11.4) 19.4 (11.8)
LKW - 12.7 (6.4) 12.5 (6.6) 10.5 (5.9) 10.1 (6.7)
BM - 20.9 (10.1) 16.3 (10.3) 14.8 (11.5) 11.8 (8.8)
SLR - 12.1 (7.9) 12.2 (6.6) 13.3 (8.2) 12.9 (8.2)
PD - 10.2 (5.9) 10.9 (7.4) 10.2 (5.9) 11.8 (7.0)
38
SGT - 14.8 (8.3) 10.4 (7.1) 10.7 (7.6) 10.1 (6.5)
TM - 12.0 (8.2) 9.1 (6.3) 12.5 (7.3) 10.7 (7.1)
KEM - 9.6 (7.8) 12.3 (8.0) 11.9 (8.0) 8.7 (7.2)
KLP - 6.3 (6.9) 11.4 (6.9) 11.3 (7.5) 16.6 (10.5)
LAB - 14.4 (6.4) 10.0 (4.3) 9.4 (5.9) 11.8 (9.5)
KEN - 19.2 (10.4) 15.0 (9.6) 15.1 (10.4) 17.2 (10.0)
BIN - 21.5 (12.6) 14.2 (10.3) 13.4 (7.9) 17.1 (10.6)
LD - 12.8 (7.7) 13.2 (8.3) 14.2 (9.5) 18.3 (12.6)
Total 14.9 (9.3) 15.5 (9.5) 14.4 (9.0) 14.2 (8.7) 14.4 (8.8)
The average length of hospital stay was 14.4 days with a median of 8.8 days.
KCH and UMMC recorded the longest length of hospital stay of 19.4 days.
KEM recorded the shortest length of hospital stay of 8.7 days.
39
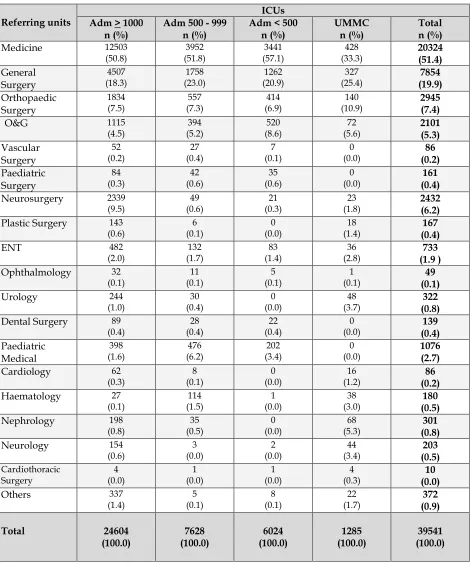
Table 10 :
Referring units, by category of ICU 2015
Referring units
ICUs
Medicine 12503 (50.8)
Neurosurgery 2339 (9.5)
Plastic Surgery 143 (0.6)
Ophthalmology 32 (0.1)
Dental Surgery 89 (0.4)
Cardiology 62 (0.3)
Haematology 27 (0.1)
Nephrology 198 (0.8)
Neurology 154 (0.6)
40
Figure 6 :
Referring units, by category of ICU 2015
0%
Adm ≥1000 Adm 500-999 Adm <500 UMMC
P
The percentage of patients admitted from the medical-based disciplines has increased from
43.0% in 2011 to 51.4% in 2015.
Table 11 :
Category of patients, by category of ICU
2015
ICUs
Non-operative 16522
(67.1)
Non-operative Refers to patients in whom no surgery was done out within 7 days before ICU admission or during the first 24 hours after ICU admission
Operative-elective Refers to patient in who surgery was done within 7 days before ICU admission or during the first 24 hours after ICU admission on a scheduled basis
Operative-emergency
41
Figure 7 :
Category of patients, by category of ICU 2015
0%
≥1000 500-999 <500 UMMC
P
Table 12 :
Category of patients in MOH hospitals 2011 - 2015
Category of patients 2011
(%)
Figure 8 :
Category of patients in MOH hospitals 2004 – 2015
0
2004 2005 2006 2007 2008 2009 2010 2011 2012 2013 2014 2015
42
The proportion of patients admitted into ICU after elective operations was higher in UMMC
(17%) compared with that of MOH ICUs (8%).
Non-operative admissions accounted for 69% and 58% of all admissions to MOH and
UMMC ICUs respectively. There was a steady increase in non-operative patients over the
past 10 years with a 11% increase from 2005 to 2015, while the percentage of elective
operative and emergency operative patients decreased by 8% and 13% respectively.
Table 13 :
Location before ICU admission, by category of ICU 2015
Location
Other critical areas 718
(2.9)
Other locations 192
(0.8)
Other hospitals 1127
(4.6)
Location before ICU admission: Refers to the area/location patient was being managed just before being admitted into ICU
Figure 9 :
Location before ICU admission, by category of ICU 2015
0%
≥1000 500-999 <500 UMMC
43
Table 14 :
Location before ICU admission in MOH hospitals 2011
–
2015
Location 2011
(%)
2012 (%)
2013 (%)
2014 (%)
2015 (%)
Ward 37.4 36.7 35.7 36.3 36.4
Operation theatre 29.3 26.6 26.4 24.6 23.5
Emergency department
24.0 27.9 29.7 31.4 32.8
Other critical areas 4.1 3.7 2.9 2.5 2.6
Other locations 0.5 0.7 0.6 0.8 0.7
Other hospitals 4.7 4.5 4.6 4.4 4.0
Figure 10 :
Location before ICU admission in MOH hospitals 2005 – 2015
0 5 10 15 20 25 30 35 40 45 50
2005 2006 2007 2008 2009 2010 2011 2012 2013 2014 2015
Year
P
er
ce
n
tag
e o
f ad
m
is
si
o
n
...
...
Ward
Operation theatre
Emergency department
Other critical areas
Other locations
Other hospital
44
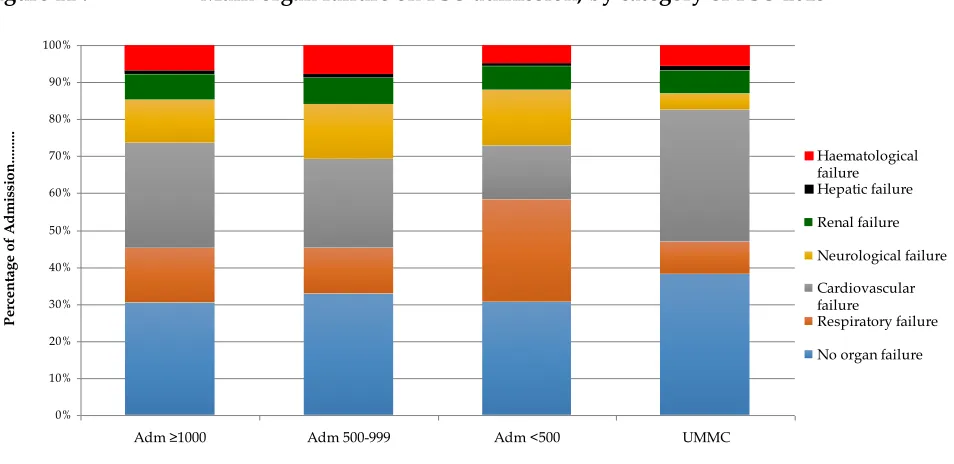
Table 15 :
Main organ failure on ICU admission, by category of ICU 2015
Main organ failure
ICUs
Without organ failure The definition of organ failure is based on the Sequential Organ Failure Assessment (SOFA) [4]
Main organ failure: Refers to the main or most important organ failure within 24 hours of ICU admission and management.
.
Figure 11 :
Main organ failure on ICU admission, by category of ICU 2015
0%
Adm ≥1000 Adm 500-999 Adm <500 UMMC
P No organ failure
In MOH ICUs, 31% of the admissions did not have organ failure during the first 24 hours of
ICU admission.
45
Table 16 :
Number of organ failure(s) on ICU admission,
by category of ICU
2015
Main organ failure
ICUs
Adm ≥ 1000
n (%)
Adm 500 - 999 n (%)
Adm < 500 n (%)
UMMC n (%)
Total n (%)
Without 6830 (31.4) 2117 (33.8) 1611 (32.4) 493 (39.5) 11051 (32.3)
Single 7124 (32.7) 2038 (32.6) 1496 (30.1) 348 (27.9) 11006 (32.1)
Two 4886 (22.4) 1237 (19.8) 1068 (21.5) 260 (20.9) 7451 (21.7)
Three 2297 (10.5) 647 (10.3) 569 (11.4) 110 (8.8) 3623 (10.6)
Four 545 (2.5) 181 (2.9) 200 (4.0) 31 (2.5) 957 (2.8)
Five 87 (0.4) 38 (0.6) 29 (0.6) 4 (0.3) 158 (0.5)
Six 9 (0.0) 1 (0.0) 5 (0.1) 1 (0.1) 16 (0.0)
Total 21778 (100.0) 6259 (100.0) 4978 (100.0) 1247 (100.0) 34262 (100.0)
Figure 12 :
Number of organ failure(s) on ICU admission, by category of ICU 2015
0% 10% 20% 30% 40% 50% 60% 70% 80% 90% 100%
Adm ≥1000 Adm 500-999 Adm <500 UMMC
P
e
rc
e
n
tag
e
o
f A
d
m
is
si
o
n
...
Six Five Four Three Two One None