Malaysian Registry of Intensive Care
Report for 2010
Prepared by
Technical Committee of
May 2011
© Malaysian Registry of Intensive Care
Published by:
Malaysian Registry of Intensive Care
Clinical Research Centre
Ministry of Health Malaysia
Disclaimer:
This work may be reproduced in whole or part for study or training purposes, subject to the
inclusion of an acknowledgement of the source.
Suggested citation:
Jenny MG Tong, LL Tai, CC Tan, Ahmad S, CH Lim
Malaysian Registry of Intensive Care 2010 report
Electronic version:
CONTENTS
Page
Contents………. 3
Report Summary………... 4
Acknowledgement……… 5
Foreword……… 6
MRIC Technical Committee 2009……….
7
Participating Hospitals………
8
Categories of ICU ……….
9
Site Investigators and Source Data Providers 2009…..………
10
Abbreviations……… 13
List of Tables……….
14
List of Figures……… 15
Introduction……….. 16
Results
Section A General Information………
19
Section B Patient Characteristics………
25
Section C Interventions………
45
Section D Complications……….
55
Section E Mortality Outcomes………...
65
Section F Special report on Dengue infection in ICU 2010...
73
Section G Special report on H1N1 infection in ICU 2009 and 2010...
79
Summary……… 83
REPORT SUMMARY
This is the report on all intensive care admissions to the 37 participating centres from 1
stJanuary to
31
stDecember 2010.
The following are the main findings:
1.
The total number of ICU beds in the 36 MOH participating units was 439 with an average
bed occupancy rate of 91%.
2.
The number of cases analysed was 26,977, an increase of 27% over the previous year.
3.
The overall reporting rate over the past few years had been fairly constant at 88%.
4.
The percentage of patients denied admission due to the unavailability of ICU beds had
declined from 53.4% to 36.5% in the last five years.
5.
The average age of the patients, excluding those below 18 years, was 49.4 years.
6.
The average duration of ICU and hospital stay were 4.7 and 14.6 days respectively.
7.
In MOH hospitals, 63% of ICU admissions were non-operative patients.
8.
Direct admissions to ICU from the emergency department had increased from 9% in 2004
to 24% in 2010.
9.
63% of ICU admissions had one or more organ failure within 24 hours of ICU admission.
10.
Head injury, sepsis and dengue infection were the three most common diagnoses leading
to ICU admission in MOH hospitals. Over the past 8 years, head injury and sepsis
remained the two most common diagnoses. In 2010, dengue infection overtook community
acquired pneumonia as the 3
rdmost common diagnosis leading to ICU admission. The
in-hospital mortality rates for this group of patients were 27.4%, 59.3% and 8.6% respectively.
11.
The average SAPS II score was 35.1, which carries a predicted in-hospital mortality of
27.0%.
12.
In MOH hospitals, 71.6% of patients received invasive ventilation with an average duration
of 4.1 days.
13.
The percentage of patients who received non-invasive ventilation increased from 6.5% in
2003 to 14.3% in 2010.
14.
The incidence of VAP decreased by more than half, from 28.0 to 10.1 per 1000 ventilator
days, in the last eight years.
15.
The crude in-ICU and in-hospital mortality rates were 20.9% and 28.1% respectively.
ACKNOWLEDGEMENT
The Malaysian Registry of Intensive Care would like to thank the following:
Sister Lim Siew Kim, MRIC Project Manager
All site investigators and source data providers
The heads of Department of Anaesthesia and Intensive Care of participating ICUs
Staff of the participating ICUs
Quality of Health Care Unit, Medical Development Division, Ministry of Health
Clinical Research Centre, Ministry of Health
FOREWORD
I am honoured
to be given the opportunity
to write the foreword for this 2010 report which will be
my last as the national advisor for the Anaesthetic and Intensive Care Services in Ministry of
Health. Having been with NAICU and subsequently MRIC for almost a decade, it is with great
pride and satisfaction that I pen this parting note. It is no small feat to maintain a registry and
produce high quality annual reports for an uninterrupted period of eight years. As a fraternity, we
are incredibly proud of this achievement.
The anaesthetic discipline has benefited greatly from the findings generated from the data in the
registry. We are able to benchmark our performance, identify shortcomings and introduce changes
in clinical practice. The ventilator care bundle introduced in 2007 had made a positive impact on
patient care by reducing the rate of ventilator-associated pneumonia in MOH ICUs. Data on ICU
facilities and ICU
denial give credence to our request for more ICU beds to be established. It is not
unfair to say that the registry has been a major catalyst in advancing intensive care in Ministry of
Health and to a certain extent the entire nation.
Whilst the registry has covered almost all the ICUs in Ministry of Health, it has not been well
received by the private and university hospitals. Since the participation of Sime Darby Medical
Centre in 2006, there has not been a second participating centre outside MOH. This is a major set
back. It is my fervent wish that there would be greater participation from the private and
university sectors. I am hopeful that the scenario will change in the next few years when
accreditation, clinical governance and accountability become more wide spread.
Now it only remains for me to thank each and every one who has contributed in one way or
another to make this registry a success. I am especially thankful to Dr. Jenny Tong, Dr. Tai Li Ling
and Dr. Tan Cheng Cheng for their unwavering support and hard work that has spanned almost a
decade. Their dedication and commitment is unparalleled. I am confident that under their
stewardship while
ably assisted by the 'new generation' in Dr. Ahmad Shaltut, Dr. Lim Chew Har
and Dr. As Niza, MRIC is in good hands and that it will continue to scale greater heights.
Dr. Ng Siew Hian
National Advisor
TECHNICAL COMMITTEE
MALAYSIAN REGISTRY OF INTENSIVE CARE 2010
Advisors
Dr. Hjh Kalsom Maskon
Deputy Director (Quality of Health Care Unit)
Medical Development Division, Ministry of Health
Dr. Ng Siew Hian
Consultant Anaesthesiologist and Head
Department of Anaesthesia and Intensive Care
Hospital Kuala Lumpur
Principal Investigator
Dr. Jenny Tong May Geok
Consultant Anaesthesiologist and Head
Department of Anaesthesia and Intensive Care
Hospital Tuanku Ja’afar Seremban
Co-Investigators
Dr. Tai Li Ling
Consultant Intensivist
Department of Anaesthesia and Intensive Care
Hospital Kuala Lumpur
Dr. Tan Cheng Cheng
Consultant Intensivist
Department of Anaesthesia and Intensive Care
Hospital Sultanah Aminah Johor Bahru
Dr. As-niza Abdul Shukor
Consultant Anaesthesiologist and Head
Department of Anaesthesia and Intensive Care
Hospital Taiping
Dr. Ahmad Shaltut Othman
Consultant Intensivist
Department of Anaesthesia and Intensive Care
Hospital Sultanah Bahiyah Alor Setar
Dr. Lim Chew Har
Consultant Intensivist
Department of Anaesthesia and Intensive Care
Hospital Pulau Pinang
Medical Development
Division,
Ministry of Health
Dr. Paa Mohamed Nazir Abdul Rahman
Senior Principal Assistant Director
Dr. Fakhruddin Amran
Principal Assistant Director
PARTICIPATING HOSPITALS
No.
Name of hospital
Abbreviation
Sites since 2002
1. Hospital Sultanah Bahiyah Alor Setar AS
2. Hospital Pulau Pinang PP
3. Hospital Raja Permaisuri Bainun Ipoh IPH
4. Hospital Kuala Lumpur KL
5. Hospital Selayang SLG
6. Hospital Tengku Ampuan Rahimah Klang KLG
7. Hospital Tuanku Ja’afar Seremban SBN
8. Hospital Melaka MLK
9. Hospital Sultanah Aminah Johor Bahru JB
10. Hospital Tengku Ampuan Afzan Kuantan KTN
11. Hospital Sultanah Nur Zahirah Kuala Terengganu KT
12. Hospital Raja Perempuan Zainab II Kota Bharu KB
13. Hospital Umum Sarawak Kuching KCH
14. Hospital Queen Elizabeth Kota Kinabalu KK
Sites since 2005
15. Hospital Sultan Abdul Halim Sungai Petani SP
16. Hospital Putrajaya PJY
17. Hospital Pakar Sultanah Fatimah Muar MUR
18. Hospital Teluk Intan TI
19. Hospital Taiping TPG
20. Hospital Seberang Jaya SJ
21. Hospital Kajang KJG
22. Hospital Tuanku Fauziah Kangar KGR
Sites since 2006
23. Sime Darby Medical Centre Subang Jaya SDMC
24. Hospital Sultan Haji Ahmad Shah Temerloh TML
25. Hospital Tuanku Ampuan Najihah Kuala Pilah KP
26. Hospital Sri Manjung SMJ
33 Hospital Duchess of Kent Sandakan DKS
34 Hospital Sultan Ismail Johor Bahru SI
35 Hospital Sungai Buloh SBL
36 Hospital Ampang AMP
CATEGORIES OF ICU
Based on the number of ICU beds (as of 31
stDecember 2010 for the purpose of MRIC 2010 report)
Participating sites with 16 ICU beds or more
1. Hospital Sultanah Bahiyah Alor Setar
2. Hospital Pulau Pinang
3. Hospital Raja Permaisuri Bainun Ipoh
4. Hospital Kuala Lumpur
5. Hospital Selayang
6. Hospital Tengku Ampuan Rahimah Klang
7. Hospital Melaka
8. Hospital Sultanah Aminah Johor Bahru
9. Hospital Sultanah Nur Zahirah Kuala Terengganu
10. Hospital Taiping
11.
Hospital Sungai Buloh
Participating sites with 8 – 15 ICU beds
12. Hospital Tuanku Ja’afar Seremban
13. Hospital Tengku Ampuan Afzan Kuantan
14. Hospital Raja Perempuan Zainab II Kota Bharu
15. Hospital Umum Sarawak Kuching
16. Hospital Queen Elizabeth Kota Kinabalu
17. Hospital Putrajaya
18. Hospital Pakar Sultanah Fatimah Muar
19. Hospital Seberang Jaya
20. Hospital Sultan Haji Ahmad Shah Temerloh
21. Hospital Sri Manjung
22. Hospital Batu Pahat
23. Hospital Serdang
24. Hospital Sibu
25. Hospital Duchess of Kent Sandakan
26. Hospital Sultan Ismail Johor Bahru
27. Hospital Ampang
Participating sites with 7 ICU beds or less
28. Hospital Sultan Abdul Halim Sungai Petani
29. Hospital Teluk Intan
30. Hospital Kajang
31. Hospital Tuanku Fauziah Kangar
32. Hospital Tuanku Ampuan Najihah Kuala Pilah
33. Hospital Tawau
34. Hospital Miri
35. Hospital Kulim
36. Hospital Wanita dan Kanak-Kanak Sabah
Private hospital
LIST OF SITE INVESTIGATORS AND SOURCE DATA COLLECTORS
January – December 2010
No Hospital
Site
investigator Data
collectors
1
Sultanah Bahiyah Alor
Setar
Dr Ahmad Shaltut bin
Othman
Sr Teoh Shook Lian
SN Seniwati @Nurhayati bt Salleh
SN Hafisoh bt Ahmad
SN Haslina bt Khalid
SN Norashikin bt Man
2
Pulau Pinang
Dr Lim Chew Har
SN Khairulniza bt Razar
SN Rosmalizawati bt Ibrahim
SN Siti Hazlina bt Bidin
SN Rosmawati bt Yusoff
3
Raja Permaisuri Bainun
Ipoh
Dr Azlina bt Muhamad
SN Khairiah bt Mat Daud (Jan-July
2010)
SN Saadiah bt Bidin
SN Ng Pek Yoong (June-Dec 2010)
4
Kuala Lumpur
Dr Tai Li Ling
SN Sakulawati bt Said
SN Zainab bt Ali
5
Selayang
Dr Laila Kamariah bt
Kamalul Baharin
SN Norzaila bte Saad@Hanafi
SN Noor Azawati bt Daud
SN Maimun bt Ismail
6 Tengku
Ampuan
Rahimah Klang
Dr Faezah bt Shaari
SN Latifah bt Omar
SN Norlaili bt Ismail
7
Tuanku Ja’afar Seremban
Dr Jenny Tong May Geok Sr Chew Bee Ngoh
SN Farawahida bt Ahmad
8
Melaka
Dr Anita bt Alias
SN Morni bt Omar
9 Sultanah
Aminah
Johor
Bahru
Dr Tan Cheng Cheng
Sr Marian Sais ak Sipit
SN Aishah bt Abu Bakar
AMO Mohd Zakuan bin Mohd Nor
AMO Hairizam b Zulkhifli
AMO Mohd Adib b Jasni
AMO Anand a/l Sivasamy
10 Tengku
Ampuan
Afzan
Kuantan
Dr Rusnah bt Ab.
Rahman
Sr Nurhaini bt Kassim
SN Aminah bte Abd Hamid
SN Salina bt Sulaiman
11
Sultanah Nur Zahirah
Kuala Terengganu
Dr Mohd Ridhwan bin
Mohd Nor
SN Zauwiah bt Idris
SN Norhayati bt Abd Rahman
SN Aslinawati bt Chik
12
Raja Perempuan Zainab II
Kota Bharu
Dr Wan Nasrudin bin
Wan Ismail
SN Azilah bt Ishak
SN Azizum bt Ismail
SN Haryati bt Hassan
14
Queen Elizabeth Kota
Kinabalu
Dr Khoo Tien Meng
SN Jusim Lugu
SN Safiah bt Mokhtar
SN
Conny Chong Chiew Fah
15 Sultan
Abdul
Halim
Sungai Petani
Dr Rafidah bt Kasim
Sr Rafizah Md Zuki
Sr Puziah bt Yahya
SN Halijah bt Kasim
SN Hamiza bt Mohd Noor
16
Putrajaya
Dr Fauziah bt Yusoff
Sr Noorainee bt Romli
SN Noryasni bt Mahtrod@Ahmad
(Jan-Oct 2010)
SN Latifah bt Mohd Korib
SN Maznah bt Muhamad
17 Pakar
Sultanah
Fatimah
Muar
Dr Azmin Huda bt Abdul
Rahim
SN Ropeah bt Ahmad
SN Roslina bt Othman
SN Mazlidah bt Osman
18
Teluk Intan
Dr Wang Shir Siong
SN Azliza bt Zakaria
SN Rohayu Dalila bt Yusof
SN Puspavali a/Punusamy
AMO Mohd Najib bin Misbah
19
Taiping
Dr As-niza bin Abdul
Shukor
Sr Norlidah bt Abu Bakar
SN Ummi Khadijah bt Bani
SN Saleha bt Salleh
20
Seberang Jaya
Dr Jusminder bt Abdul
Jamal
SN Zuraina bt Muhamad
SN Nooraslina bt Othman
SN Noorazleena bt Hassim
21
Kajang
Dr Wan Hafizah bt Wan
Tajul Ariffin
SN Saiza bt Mat Yusof
22
Tuanku Fauziah Kangar
Dr Azilah bt Desa
SN Zarina Mat Bistaman
SN Julaida bt Din
SN Zulmirnani bt Ariffin
SN Norazlisyan bt Ramli
23 Sime
Darby
Medical
Center Subang jaya
Dr Alan Wong Ket Hiung Ms Navjeet Kaur
SN Normazimah bt Mohamad Nazar
24
Sultan Haji Ahmad Shah
Temerloh
Dr Rahimah bt Haron
Sr Rakiah bt Mohd Noor
SN Norliza bt Ismail
SN Norsuha bt Mat Amin
SN Rohayu bt Yusof
25 Tuanku
Ampuan
Najihah
Kuala Pilah
Dr Zalifah bt Nordin
Sr Lee New
SN Noorliza bt Othman
26
Sri Manjung
Dr Khairudin bin Zainal
Abidin
SN Rohani bt Ali
SN Hartini bt Abd Rahman
27
Batu Pahat
Dr Azizul Hisham bin
Bahari
28
Tawau
Dr Kyaw Soe (Jan-Dec
2010)
Dr Tun Hla Aung
(Aug-Dec 2010)
SN Lilybeth Feliciano Ferez
SN Sarwah bt Isa
Sr Mahani bt Hassan
SN Mohana bt Omar
SN Bahayah bt Mohamed Bakari
SN Che Asmah bt Haji Md Isa
31
Serdang
Dr Rohana bt Mohemad
SN Zamzurina bt Yahaya (Jan-Aug
2010)
SN Norain bt Saad
SN Siti Ainah bt Buang
32
Sibu
Dr Huwaida bt Abdul
Halim
SN Nadzarizan bt Buang
SN Wong Chen Chen
SN Yong Suk Moi
33
Duchess of Kent
Sandakan
Dr Norhayati bt Mohd
Said
SN Norahimah bt Dulraman
Sr Martina Gawis
34
Sultan Ismail Johor Bahru Dr Mohd Zaini bin Laman Sr Mariah bt Kassim
SN Huzaimah bt Jahir
SN Norwati bt Jamiran (Jun-Dec 2010)
35
Sungai Buloh
Dr Shanti Ratnam
SN Zainidah bt Mat Kasim
36
Ampang
Dr Rusnah bt Ab Latif
SN Normazlin bt Md Derus
SN Amiza Dyana bt Abu Amin
SN Siti Baizura bt Che Ahmad
37
Wanita dan Kanak-Kanak
Sabah
ABBREVIATIONS
Adm. Admission
AKI
Acute kidney injury
ALI Acute
lung
injury
AMO
Assistant medical officer
AOR
At own risk
APACHE II
Acute Physiologic and Chronic Health Evaluation (Version II)
ARDS
Acute respiratory distress syndrome
Creat Creatinine
CRRT
Continuous renal replacement therapy
ED
Emergency department
ENT Otorhinolaryngology
HD Haemodialysis
HDU High
dependency
unit
Hosp Hospital
Hrs Hours
ICU
Intensive care unit
Int. Intensive
MOH
Ministry of Health
MRIC
Malaysian Registry of Intensive Care
MV Mechanical
ventilation
NA Not
available
NAICU
National Audit on Adult Intensive Care Units
NIV Non-invasive
ventilation
NHSN
National Healthcare Safety Network
NNIS
National Nosocomial Infection Surveillance
No. Number
O&G Obstetrics
&
Gynaecology
PaCO2
Partial pressure of arterial carbon dioxide
PaO2
Partial pressure of arterial oxygen
Refer. Referred
SAPS II
Simplified Acute Physiologic Scoring System (Version II)
SD Standard
deviation
SIRS
Systemic inflammatory response syndrome
SMR Standardised
mortality
ratio
SN Staff
nurse
SOFA
Sequential Organ Failure Assessment
Sr Sister
SPSS
Statistical Package for Social Sciences
TWBC
Total white blood count
VAP Ventilator-associated
pneumonia
LIST OF TABLES
Page
Table 1
ICU beds and ICU bed occupancy rate, by MOH hospitals 2007-2010………..
20
Table 2
ICU admissions, by individual hospital 2005 – 2010………
21
Table 3
Reporting rates, by individual hospital 2007 – 2010……….
23
Table 4
Intensive care referrals and refusal of admission, by individual hospital 2006 – 2010………
24
Table 5
Gender 2005 -2010………... 26
Table 6
Mean age 2005 -2010………..
26
Table 7
Ethnic groups 2010……….
27
Table 8
Length of ICU stay, by individual hospital 2005 – 2010………... 28
Table 9
Length of hospital stay, by individual hospital 2005 – 2010………
29
Table 10
Referring units 2010 ………..
30
Table 11
Category of patients 2010……….……….
31
Table 12
Category of patients in MOH hospitals 2005 -2010………... 32
Table 13
Location before ICU admission, by hospitals 2010………... 33
Table 14
Location before ICU admission in MOH hospitals 2005 – 2010………..
33
Table 15
Main organ failure on ICU admission 2010………
34
Table 16
Number of organ failure(s) on ICU admission 2010……….………
36
Table 17
Ten most common diagnoses leading to ICU admission 2010……….…
37
Table 18
Ten most common diagnoses leading to ICU admission using APACHE II diagnostic
category 2010………..
39
Table 19
Severe sepsis, ARDS and AKI within 24 hours of ICU admission 2010……
40
Table 20
Severe sepsis, ARDS and AKI within 24 hours of ICU admission, by individual hospital
2010………
41
Table 21
SAPS II score, by individual hospital 2005 – 2010 ………
42
Table 22
SOFA score, by individual hospital 2007 – 2010 ………... 43
Table 23
Invasive ventilation, non-invasive ventilation and reintubation 2010 ………... 46
Table 24
Duration of invasive ventilation, by individual hospital 2006 – 2010 ………
48
Table 25
Renal replacement therapy and modalities of therapy 2010………...
49
Table 26
Tracheostomy 2010 ………..………..
50
Table 27
Tracheotomy, by individual hospital 2010……….
51
Table 28
Tracheostomy, by individual hospital 2007 -2010……….
52
Table 29
Withdrawal /withholding of therapy, by individual hospital 2008 - 2010………...
53
Table 30
Incidence of ventilator-associated pneumonia, by individual hospital 2004-2010…………...
56
Table 31
Onset of VAP from initiation of invasive ventilation, by individual hospital 2008 – 2010…..
57
Table 32
Bacteriological cultures in VAP 2010 ……….
60
Table 33
Bacteriological cultures in VAP 2008 –2010………
61
Table 34
Unplanned extubation per 100 intubated days, by individual hospital 2004 –2010………….
62
Table 35
Pressure ulcer, by individual hospital 2008 - 2010……….
64
Table 36
Hospital outcome 2010 ………..
66
Table 37
Crude in-ICU and in-hospital mortality rates, by individual hospital 2005 – 2010…………..
67
Table 38
Ten most common diagnoses leading to ICU admission in MOH hospitals and observed
In-hospital mortality2010………..
69
Table 39
Severe sepsis, ARDS and AKI within 24hrs of ICU admission and observed
in-hospital mortality 2010………..………
69
Table 40
Standardised mortality ratio, by individual hospital 2005 - 2010………...….
70
Table 41
General comparison for Dengue and Non-Dengue infection 2010……….
74
Table 42
Dengue infection by hospital and crude in-hospital mortality, 2010………..
76
Table 43
Dengue infection by regions and crude in-hospital mortality, 2010………...………
77
Table 44
Main organ failure and mortality for Dengue and Non-Dengue infection 2010………...
78
Table 45
Comparison of characteristics and outcomes of patients with Influenza A (H1N1)
infection 2009–2010………...……..
80
LIST OF FIGURES
Page
Figure 1
ICU admissions, by participating centres 2010……….
22
Figure 2
ICU admissions 2003 – 2010……….
22
Figure 8
Location before ICU admission, by hospitals 2010 ………
33
Figure 9
Location before ICU admission in MOH hospitals 2005 – 2010……….
34
Figure 10
Main organ failure on ICU admission, by hospitals 2010………
35
Figure 11
Number of organ failure(s) on ICU admission, by hospitals 2010
………… 36
Figure 12
Ten most common diagnoses leading to ICU admission in MOH hospitals
2010………
38
Figure 13
Invasive ventilation, by hospitals 2010………...
46
Figure 14
Non-invasive ventilation, by hospitals 2010………..
46
Figure 15
Non-invasive ventilation, MOH hospitals 2004 – 2010 ………...
47
Figure 16
Re-intubation, MOH hospitals 2004 – 2010………...
47
Figure 17
Modalities of renal replacement therapy, by hospitals 2010 ………..
49
Figure 18
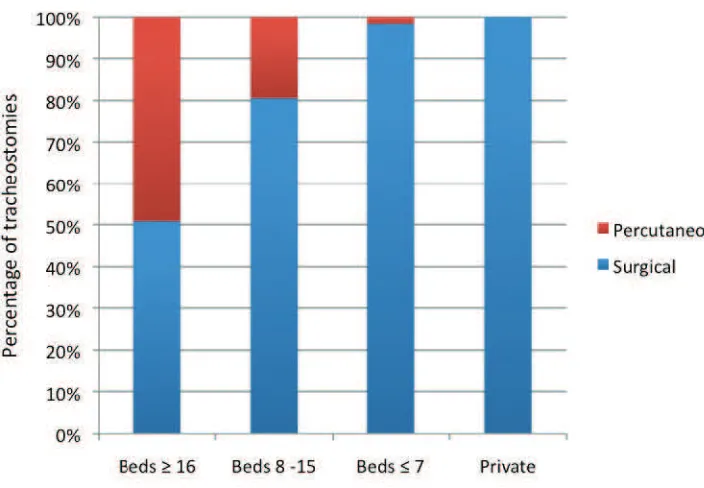
Techniques of tracheostomy, by hospitals 2010 ………...
50
Figure 19
VAP per 1000 ventilator days 2004 - 2010 ………. 58
Figure 20
VAP per 1000 ventilator days, by individual hospital 2010………
58
Figure 21
VCB compliance and VAP 2007 – 2010………...
59
Figure 22
Bacteriological cultures in VAP 2010 ……….
61
Figure 23
Unplanned extubation, by individual hospital 2010………
63
Figure 24
Crude in-ICU and in-hospital mortality rates, by individual hospital 2010.
68
Figure 25
Standardised mortality ratio by individual hospital 2010………...
71
INTRODUCTION
The National Audit on Adult Intensive Care Units (NAICU) was established in 2002 as a quality
improvement initiative to systematically review the intensive care practices in Malaysia and where
possible, to introduce remedial measures to improve outcome. To date, this audit had published
seven reports and introduced several quality measures such as ventilator care bundle, central
venous care bundle and ICU networking.
In 2009, the NAICU was renamed the Malaysian Registry of Intensive Care (MRIC) under the
purview of the Clinical Research Centre, Ministry of Health Malaysia. This report is thus the third
for MRIC, but eighth in the series.
The objectives of this registry are to:
1.
Establish a database of patients admitted to the adult ICUs
2.
Review the clinical practices of intensive care
3.
Determine clinical outcomes
4.
Determine the resources and delivery of intensive care service
5.
Evaluate the impact of quality improvement measures on patient care
6.
Provide comparisons of performance of participating centres against national and
international standards
7.
Conduct health care research related to intensive care
In 2010, 6 six new centres (Hospitals Sibu, Duchess of Kent Sandakan, Sultan Ismail Johor Bahru,
Sungai Buloh, Ampang and Hospital Wanita & Kanak-Kanak Sabah) were added to the list of 31
participating hospitals in the registry.
This report describes the intensive care practices and outcomes in a centre in a private hospital and
36 ICUs in MOH.
Data Collection and Verification
Data were collected prospectively by trained nurses (source data providers) and specialists (site
investigators) based on a written protocol. Data was initially collected on a standard e-case report
form for each patient. Since 1
stJanuary 2010, data were entered directly in a central depository via
a web-based programme by individual centres.
All participating centres were to ensure “accuracy and completeness” of their individual
databases.
Merged data were ‘cleaned’ and verified before being analysed using SPSS version 10.0.1.
This report is based on all admissions into the 37 participating ICUs from 1
stJanuary to 31
stJanuary 2011, were excluded from the analysis. The total number of admissions in 2010 was 28,080
out of which 1103 (3.9%) were re-admissions. For patients with multiple ICU admissions, only the
first admission was included in the analysis.
Due to missing and inconsistent data, the sum total of some variables shown in the tables may not
add up to the actual number of admissions.
Data Limitations
Limitations to the registry data were mainly related to the data entry and collection process. Some
of the participating ICUs experienced rapid turnover of their site investigators and source data
providers resulting in under-reporting and data inconsistencies.
Format of Report
The format of this report follows the patient’s journey in four sections: demographics,
interventions, complications and outcomes. Information is reported on a total of 26,977 ICU
admissions.
In this report, information was provided for individual centres. Wherever appropriate,
comparisons were made between three categories of hospitals based on the number of ICU beds.
In MOH hospitals, the three categories were centres with more than 16 beds, 8 to 15 beds and those
with 7 beds or less. Where relevant, trends of certain variables over the years were reported.
SECTION A:
Table 1:
No. of ICU beds and occupancy rate, by MOH hospitals 2007–2010
Hospital
Number of functional
ICU beds (as of 31-12-2010)
ICU bed occupancy rate %
2007
2008
2009
2010
The total number of ICU beds in MOH as of 31
stDecember 2010 was 439 with a median bed
The number of admissions has increased over the years. The increase from 2009 to 2010 was about
27%. This was attributed to the addition of 66 beds in the 6 new centres and to the opening up of
an additional 43 beds in the existing centres. The re-admission rate within the first 48 hours of ICU
discharge was 2.1%.
The percentage of admissions from the three categories of ICUs was as follows:
more than 16 beds (50.4%), 8 to 15 beds (34.4%), 7 or less beds (9.3%) and private hospital (5.9%).
Figure 1:
ICU admissions, by participating centres 2010
Figure 2:
ICU admissions, 2003 - 2010
0
2003
2004
2005
2006
2007
2008
2009
2010
Year
Cohort of first 14 ICUs
Table 3:
Reporting rates, by individual hospital 2007 – 2010
Hospital
2007
The reporting rate is calculated by comparing the number of ICU admissions reported to the MRIC
and to the national census (collected by the Anaesthetic programme head). The total number
reported to the MRIC was slightly less than that of the national census, as patients who were still
in hospital on 31
stJanuary 2011 were excluded from the analysis. The average reporting rate was
Table 4:
Intensive care referrals and refusal of admission, by individual hospital 2006 -
SECTION B:
Table 5:
Gender 2005 – 2010
The ratio of male to female patients (60:40) remained fairly consistent over the years.
Table 6:
Mean age (years) 2005 - 2010
The average age for all age groups was 45.6 + 20.6 years (median 47.0 years). For adult patients
with age exceeding 18 years, the average age was 49.4 + 18.1 years (median 50.3 years). The
average age of patients admitted to ICUs had remained fairly the same over the last 4 years.
Figure 3:
Age groups, 2010
Table 7:
Ethnic groups 2010
Ethnic group
n
%
Malay
15009 55.6Chinese
5231 19.4Indian
2903 10.8Foreigner
1569 5.8Bumiputra Sabah/Sarawak
1598 5.9Other Malaysian
445 1.7Orang Asli
155 0.6Unknown
10 .0Total
26920
100.0
Figure 4:
Ethnic groups 2010
Table 8:
Length of ICU stay, by individual hospital 2005 – 2010
Table 9:
Length of hospital stay, by individual hospital 2005 – 2010
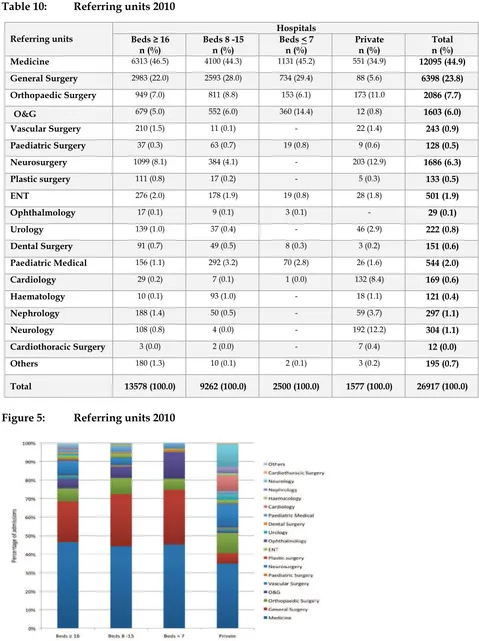
Table 10:
Referring units 2010
Figure 5:
Referring units 2010
Table 11:
Category of patients 2010
Hospitals
Beds
≥
16
n (%)
Beds 8 -15
n (%)
Beds < 7
n (%)
Private
n (%)
Total
n (%)
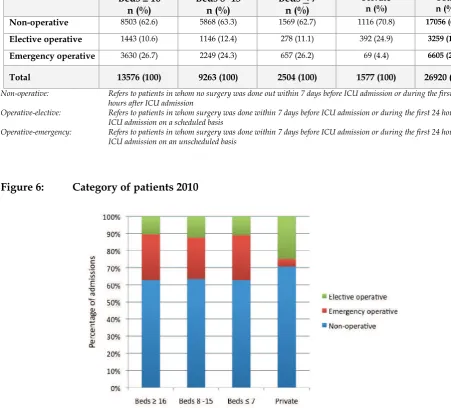
Non-operative
8503 (62.6) 5868 (63.3) 1569 (62.7) 1116 (70.8) 17056 (63.4)Elective operative
1443 (10.6) 1146 (12.4) 278 (11.1) 392 (24.9) 3259 (12.1)Emergency operative
3630 (26.7) 2249 (24.3) 657 (26.2) 69 (4.4) 6605 (24.5)Total
13576 (100)
9263 (100)
2504 (100)
1577 (100)
26920 (100)
Non-operative: Refers to patients in whom no surgery was done out within 7 days before ICU admission or during the first 24
hours after ICU admission
Operative-elective: Refers to patients in whom surgery was done within 7 days before ICU admission or during the first 24 hours after
ICU admission on a scheduled basis
Operative-emergency: Refers to patients in whom surgery was done within 7 days before ICU admission or during the first 24 hours after
ICU admission on an unscheduled basis
Figure 6:
Category of patients 2010
Table 12:
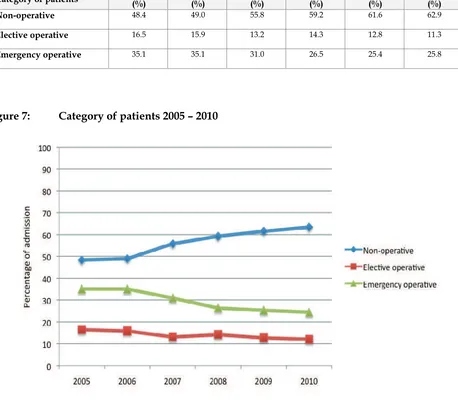
Category of patients in MOH hospitals 2005 - 2010
Category of patients
2005
(%)
2006
(%)
2007
(%)
2008
(%)
2009
(%)
2010
(%)
Non-operative
48.4 49.0 55.8 59.2 61.6 62.9Elective operative
16.5 15.9 13.2 14.3 12.8 11.3Emergency operative
35.1 35.1 31.0 26.5 25.4 25.8Figure 7:
Category of patients 2005 – 2010
Table 13:
Location before ICU admission, by hospitals 2010
Location before ICU admission: Refers to the area/location patient was being managed just before being admitted into ICU
Figure 8:
Location before ICU admission, by hospitals 2010
Table 14:
Location before ICU admission in MOH hospitals 2005 - 2010
Location
2005
Operation theatre
45.4 40.6 35.7 36.2 31.5 29.0Emergency department
9.3 12.6 13.2 16.7 20.5 23.9Other critical areas
9.6 9.0 7.3 6.5 4.4 3.7Other locations
0.4 0.5 0.4 0.6 0.7 0.9Figure 9:
Location before ICU admission in MOH hospitals 2005 - 2010
respectively. The recent trend is more consistent with the practices in developed countries.
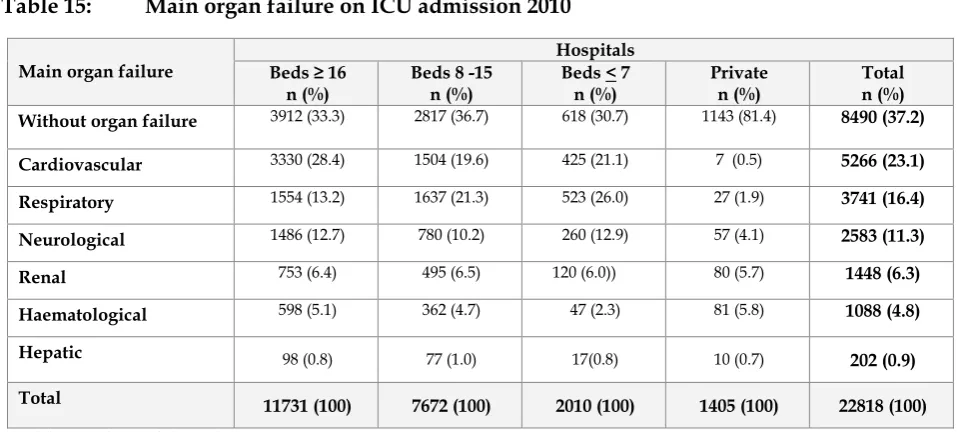
Table 15:
Main organ failure on ICU admission 2010
Main organ failure
The definition of organ failure is based on the Sequential Organ Failure Assessment (SOFA) [1]
Main organ failure: Refers to the main or most important organ failure within 24 hours of ICU admission and management.
In 2010, about a third of admissions to MOH ICUs did not have any organ failure in comparison to
the private hospital where two-thirds of admissions were without any organ failure.
Table 16:
Number of organ failure(s) on ICU admission 2010
Main organ failure
Hospitals
Beds
≥
16
n (%)
Beds 8 -15
n (%)
Beds < 7
n (%)
Private
n (%)
Total
n (%)
Without
4015 (34.2)
2874 (37.5)
632 (31.4)
1149 (81.8)
8670 (38.0)
Single
3637 (31.0)
2266 (29.5)
557 (27.7)
221 (15.7)
6681 (29.3)
Two
2554 (21.8)
1456 (19.0)
466 (23.2)
23 (1.6)
4499 (19.7)
Three
1143 (9.7)
757 (9.9)
252 (12.5)
8 (0.6)
2160 (9.5)
Four
327 (2.8)
257 (3.3)
84 (4.2)
3 ( 0.2)
671 (2.9)
Five
52 (0.4)
56 (0.7)
18 (0.9)
1 (0.1)
127 (0.6)
Six
3 (0.0)
6 (0.1)
1 (0.0)
0 (0.0)
10 (0.0)
Total
11731 (100)
7672 (100)
2010 (100)
1405 (100)
22818 (100)
Figure 11:
Number of organ failure(s) on ICU admission by hospitals 2010
Table 17:
Ten most common diagnoses leading to ICU admission 2010
Diagnosis
Number
Percentage
Hospitals with ICU beds ≥ 16
Head Injury 1511 11.1
Sepsis 1152 8.5
Dengue 1096 8.1
Community acquired pneumonia 726 5.3
Bronchial asthma 404 3.0
Chronic lower respiratory disease 378 2.8
Gastrointestinal perforation (including anastomotic leak) 347 2.6
Non-cardiogenic pulmonary oedema 338 2.5
Infection/gangrene of limb (including osteomyelitis, necrotizing fascitis) 313 2.3
Intraabdominal injury 292 2.1
Hospitals with ICU beds 8-15
Sepsis 684 7.4
Head injury 614 6.6
Community-acquired pneumonia 574 6.2
Dengue 466 5.0
Bronchial asthma 332 3.6
Chronic lower respiratory disease 278 3.0
Gastrointestinal perforation (including anastomotic leak) 249 2.7
Intra-abdominal injury 230 2.5
Infection / gangrene of limb (including osteomyelitis, necrotizing fascitis) 227 2.4
Gastrointestinal bleeding 217 2.3
Hospitals with ICU beds < 7
Sepsis 201 8.0
Head injury 189 7.5
Community-acquired pneumonia 129 5.1
Other obstetric conditions 121 4.8
Chronic lower respiratory disease 120 4.8
Pregnancy induced hypertension/ Eclampsia 82 3.3
Dengue 81 3.2
Gastrointestinal perforation (including anastomotic leak) 79 3.1
Non-cardiogenic pulmonary oedema 72 2.9
Congestive heart failure 61 2.4
Private Hospital
Cerebrovascular disease 152 9.6
Dengue 107 6.8
Gastrointestinal bleeding 99 6.3
Other CNS condition 75 4.8
Epilepsy 63 4.0
Ischaemic heart disease/ acute coronary syndrome 62 3.9
Other disorders of the musculoskeletal system 55 3.5
Other renal / genito-urinary conditions 47 3.0
Community-acquired pneumonia 46 2.9
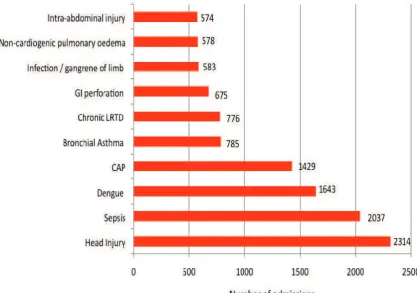
Figure 12:
Ten most common diagnoses leading to ICU admission in MOH hospitals 2010
Head injury, sepsis and dengue infection were the three most common diagnoses leading to ICU
admission in MOH hospitals. Over the past 8 years, head injury and sepsis remained the two most
common diagnoses. In 2010, dengue infection replaced community-acquired pneumonia as the 3
rdTable 18:
Ten most common diagnoses leading to ICU admission using APACHE II
diagnostic category 2010
Diagnosis
Number
Percentage
Hospitals with ICU beds ≥ 16
Non-operative: Sepsis 1644 12.1
Non-operative: Respiratory infection 1273 9.4
Non-operative: Respiratory system as principal reason for admission 829 6.1
Operative: Respiratory system as principal reason for admission 642 4.7
Non-operative: Cardiovascular system as principal reason for admission 638 4.7
Non-operative: Multiple trauma 583 4.3
Non-operative: Haemorrhagic shock/hypovolaemia 582 4.3
Operative: Cardiovascular system as principal reason for admission 519 3.8
Non-operative: Head trauma 496 3.6
Operative: Gastrointestinal perforation / obstruction 459 3.4
Hospitals with ICU beds 8-15
Non-operative: Sepsis 1044 11.2
Non-operative: Respiratory system as principal reason for admission 951 10.2
Non-operative: Respiratory infection 848 9.1
Operative: Respiratory system as principal reason for admission 683 7.3
Non-operative: Metabolic/ renal system as principal reason for admission 461 5.0
Operative: Respiratory insufficiency after surgery 440 4.7
Operative: Cardiovascular system as principal reason for admission 368 4.0
Non-operative: Cardiovascular system as principal reason for admission 327 3.5
Operative: Gastrointestinal perforation / obstruction 298 3.2
Non-operative: Asthma/allergy 292 3.1
Hospitals with ICU beds < 7
Non-operative: Respiratory system as principal reason for admission 245 9.8
Non-operative: Sepsis 214 8.5
Non-operative: Respiratory infection 172 6.9
Operative: Respiratory system as principal reason for admission 142 5.7
Non-operative: Head trauma 116 4.6
Non-operative: Hypertension 100 4.0
Non-operative: COPD 100 4.0
Operative: Gastrointestinal perforation / obstruction 95 3.8
Non-operative: Metabolic/ renal system as principal reason for admission 94 3.7
Operative: Haemorrhagic shock 89 3.5
Private Hospital
Non-operative: Metabolic/ renal system as principal reason for admission 211 13.4
Non-operative: Neurologic system as principal reason for admission 176 11.2
Non-operative: Cardiovascular system as principal reason for admission 119 7.5
Non-operative: Respiratory system as principal reason for admission 112 7.1
Operative: Cardiovascular system as principal reason for admission 111 7.0
Non-operative: Gastrointestinal system as principal reason for admission 86 5.4
Operative: Neurologic system as principal reason for admission 68 4.3
Non-operative: Seizure disorder 68 4.3
Non-operative: Gastrointestinal bleeding 67 4.2
Table 19:
Severe sepsis, ARDS and AKI within 24hrs of ICU admission 2010
* Sepsis refers to documented infection with 2 out of 4 SIRS criteria: 1) Temperature >38.3 or < than 36°C
2) TWBC of > 12000 or < 4000 3) Heart rate > 90/min
4) Respiration rate > 20 breath / minute or PaCO2 < 32mmHg
Severe sepsis is sepsis with one of the following organ dysfunctions:
(1) Hypotension: Systolic blood pressure < 90 mmHg or mean arterial pressure < 70 mm Hg (2) PaO2/FIO2 ≤ 300 mmHg.
(3) Acute decrease in platelet count to < 100 000 u/L (4) Acute increase in total bilirubin to > 70 umol/L
(5) Acute increase in serum creatinine to >170umol/L or urine output < 0.5 mL/kg/hour for > 2 hours (6) Serum lactate >4 mmol/l
# ARDS refer to severe form of ALI with a PaO2/FIO2 ratio ≤ 200 mm Hg with diffuse radiologic infiltrates which is not predominantly due to heart failure
Table 20:
Severe sepsis, ARDS and AKI within 24hrs of ICU admission, by individual
hospital 2010
Hospital
Severe sepsis
n (%)
Table 21:
SAPS II [2] score, by individual hospital 2005 - 2010
Table 22:
Sequential Organ Failure Assessment (SOFA) [1] by individual hospital 2007 -
2010
Hospital
SOFA score
Mean (Median)
SECTION C:
Table 23:
Invasive ventilation, non-invasive ventilation and reintubation 2010
Hospitals
Beds
≥
16
n (%)
Beds 8 -15
n (%)
Beds < 7
n (%)
Private
n (%)
Total
n (%)
Invasive ventilation
10358 (76.2)
7069 (76.1)
1819 (72.5)
76 (4.8)
19322 (71.6)
Non invasive
ventilation
2285 (16.8)
1234 (13.3)
320 (12.8)
16 (1.0)
3855 (14.3)
Reintubation
773 (7.5)
425 (6.0)
134 (7.4)
5 (6.6)
1337 (6.9)
Non-invasive ventilation : Refers to the continuous use of a non-invasive ventilator for > 1 hour during ICU stay
Reintubation:
Refers to re-intubation after intended or accidental extubation
Figure 13:
Invasive ventilation, by hospitals 2010
72% of ICU admissions to MOH hospitals received invasive ventilation, which was similar to the
previous years. In contrast, a vast majority of patients (95%) in the private hospital were not
mechanically ventilated.
Figure 15:
Non-invasive ventilation, MOH hospitals 2004 – 2010
The percentage of patients receiving non-invasive ventilation in MOH ICUs had increased by
almost four fold from 3.7% in 2004 to 14.3% in 2010.
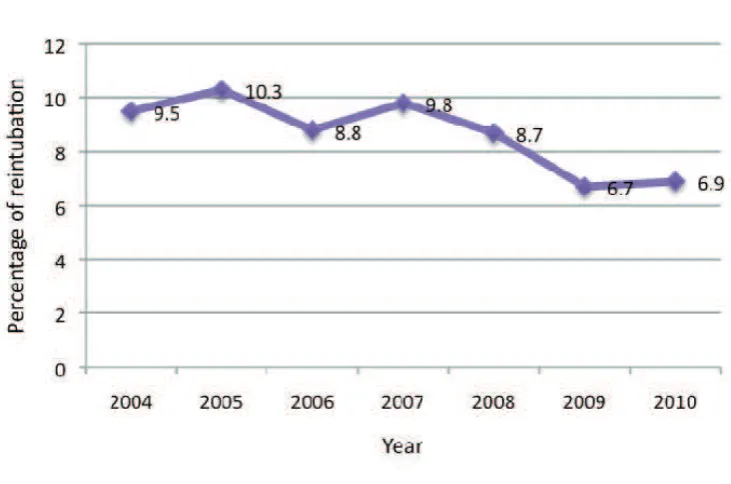
Figure 16:
Re-intubation, MOH hospitals 2004 – 2010
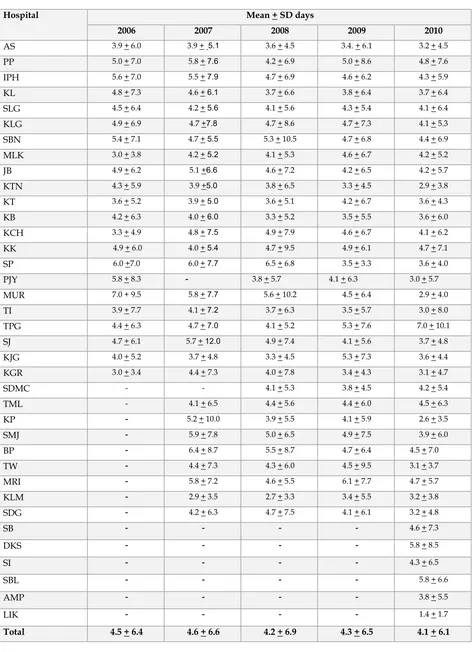
Table 24:
Duration of invasive mechanical ventilation, by individual hospital
Table 25:
Renal replacement therapy and modalities of therapy 2010
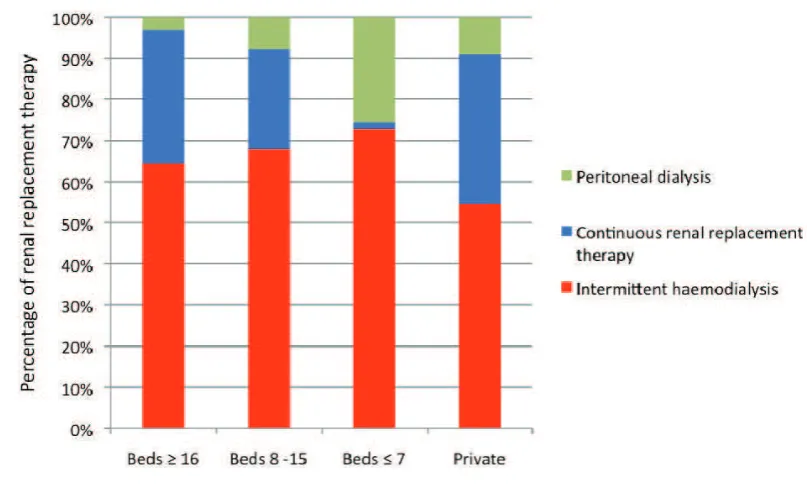
Figure 17:
Modalities of renal replacement therapy, by hospitals 2010
In MOH ICUs, 11.7% of admissions received renal replacement therapy in 2010.
Table 26:
Tracheostomy 2010
Hospitals
Beds
≥
16
n (%)
Beds 8 -15
n (%)
Beds < 7
n (%)
Private
n (%)
Total
n (%)
Tracheostomy
1558 (69.4) 557 (24.8) 127 (5.7) 2 (0.1)2244 (100.0)
Tracheotomy technique
Surgical
79.3 (50.9)
449 (80.6)
125 (98.4)
2 (100.0)
1369 (61.0)
Percutaneous
765 (49.1)
108 (19.4)
2 (1.6)
-
875 (39.0)
Tracheostomy:
Refers to the procedure done during ICU stay
Table 27:
Tracheostomy, by individual hospital 2010
to days of ventilation
mean (median)
Among invasively ventilated patients, 11.6% had tracheostomies performed. The median time
from initiation of invasive ventilation to tracheostomy was 6.0 days. Hospital JB had the shortest
interval of 4.4 days while Hospital KB had the longest
Table 28:
Tracheostomy, by individual hospital 2007 – 2010
Hospital
Total tracheostomy (% percutaneous tracheostomy)
n (%)
Table 29:
Withdrawal / withholding therapy, by individual hospital
2008 - 2010
Hospital
Withdrawal / Withholding of therapy
n (%)
Withdrawal or withholding of therapy: Refers to discontinuation / not initiating any of the following: vasoactive drugs,
renal replacement therapy, mechanical ventilation, surgery, cardiopulmonary
resuscitation
SECTION D:
Table 30:
Incidence of ventilator-associated pneumonia, by individual hospital 2004 - 2010
Hospital
VAP per 1000 ventilator days
2004
2005
2007
2008
2009
2010
VAP: Defined as nosocomial pneumonia developing in a patient after 48 hours of mechanical ventilation with radiological evidence of
Table 31:
Onset of VAP from initiation of invasive ventilation, by individual hospital 2008
- 2010
Hospital
Figure 19:
VAP per 1000 ventilator days 2004 – 2010
Figure 21:
VCB compliance and VAP 2007 – 2010
National Healthcare Safety Network (NHSN) report, data summary for 2006 - 2008
Types of ICU
Ventilator
utilisation
ratio
VAP per 1000 ventilator days
Pooled
The incidence of VAP had decreased by more than half from 28.0 in 2003 to 10.1 per 1000 ventilator
days in 2010. The introduction of the ventilator care bundle in 2007 had contributed to this
decrease as illustrated in Figure 20.
Ventilator usage is a significant risk factor for developing VAP and the exposure to this risk is
measured by ventilator utilisation ratio, which is calculated by dividing the number of ventilator
days to number of patient days. Ventilator utilisation ratio in our ICUs was 0.72, which is two
times higher than the ICUs in US.
The onset of VAP was 8.8 days from the initiation of invasive ventilation. Onset of VAP in all
centres exceeded 5 days of ventilation, indicating that most VAPs in MOH ICUs were of late onset
Table 32:
Bacteriological cultures in VAP 2010
Table 33:
Bacteriological cultures in VAP 2008 – 2010
Organisms
2008
n (%)
2009
n (%)
2010
n (%)
Acinetobacter spp.
219 (27.7)
267 (39.0)
350 (44.8)
Pseudomonas spp.
168 (21.2)
107 (15.6)
135 (17.3)
Klebsiella spp.
127 (16.0)
128 (18.7)
152 (19.5)
MRSA
63 (8.0)
50 (7.3)
22 (2.8)
MSSA
73 (9.2)
39 (5.7)
24 (3.1)
Stenotrophomonas maltophilia
25 (3.2)
20 (2.9)
20 (2.6)
Other gram negative bacteria
16 (2.0)
7 (1.0)
10 (1.3)
Fungi
11 (1.4)
6 (0.9)
19 (2.4)
Coagulase negative
Staphylococcus
16 (2.0)
-
11 (1.4)
Other bacterial culture
73 (9.2)
60 (8.8)
38 (4.9)
Figure 22:
Bacteriological cultures in VAP 2010
In 2010, Gram-negative organisms accounted for more than three quarter (85.5%) of the causative
organisms in VAP. Over the last 7 years, the most common organisms were
Acinetobacter spp
.,
Klebsiella spp.
and
Pseudomonas spp
. The percentage of
Acinetobacter spp
. had significantly increased
over the years. MRSA causing VAP is relatively uncommon and has decreased over the years.
Table 34:
Unplanned extubation per 100 intubated days, by individual hospital 2004 - 2010
Hospital
Unplanned extubation
per 100 intubated days
Figure 23:
Unplanned extubation, by individual hospital 2010
Table 35:
Pressure ulcer, by individual hospital
2008 - 2010
Hospital
Pressure ulcer per 1000 ICU days
2008
2009
2010
Pressure ulcer: A circumscribed area in which cutaneous tissue has been destroyed and there is progressive destruction of underlying tissue caused by interference with circulation and nutrition to the area. Signs include blisters or broken skin or sore formation over pressure areas
SECTION E:
Crude mortality rates are convenient measures of outcome. However, they are poor indicators of
performance of intensive care as they do not take into account variations in patient characteristics
such as case mix and the severity of illness.
A better measure of ICU performance is standardised mortality ratio (SMR). SMR is the ratio,
comparing the observed to the predicted mortality, using a severity scoring system. SMR stratifies
patients according to the severity of illness and is a better indicator of ICU performance within
certain limitations. SMR of more than one indicates that the actual number of deaths is more than
the predicted number of deaths. SMR of less than one indicates that the number of deaths
observed is less than the number of deaths predicted.
When interpreting SMR values, one must take into consideration factors which affect the severity
scoring system used to predict mortality. These include interval between onset of illness to ICU
admission (lead time bias), post-ICU care and small sample size. Lead-time bias refers to the
erroneous estimation of risk at the time of admission to the ICU due to the results of therapeutic
actions taken previously.
Table 36:
Hospital outcome 2010
Hospital outcome
The hospital outcome for the three categories of ICUs in MOH hospitals was fairly similar.
Table 37:
Crude in-ICU and in-hospital mortality rate, by individual hospital 2005 - 2010
Hospital
Crude in-ICU mortality (in-hospital mortality) %
Figure 24:
Crude in-ICU and in-hospital mortality rates, by individual hospital 2010
The in-ICU and in-hospital mortality rates in MOH hospitals were 20.9% and 28.1% respectively.
These rates had remained almost the same over the last six years.
Table 38: Ten most common diagnoses leading to ICU admission in MOH hospitals and
observed in-hospital mortality 2010
Diagnosis
Mortality (%)
2009
2010
Head Injury
27.0 27.4
Sepsis
62.2
59.3
Dengue
10.4 8.6
Community acquired pneumonia
46.3
42.6
Bronchial asthma
10.4 7.8
Chronic lower respiratory disease
32.4
26.2
Gastrointestinal perforation
(including anastomotic leak)
36.3 33.8
Infection / gangrene of limb
(including osteomyelitis,
Intra-abdominal injury
22.4
23.8
Patients with sepsis carried a high in-hospital mortality of 59.3%. Mortality for patients with head
injury was 27.4%. Bronchial asthma and dengue infection carried in-hospital mortality of 7.8 and
8.6% respectively.
Table 39:
Severe sepsis, ARDS and AKI within 24hrs of ICU admission and observed
in-hospital mortality 2010
In-hospital Mortality (%)
Severe sepsis
58.6
ARDS
56.6
AKI
58.2
Table 40:
Standardised mortality ratio, by individual hospital 2005 – 2010
Hospital
Standardised mortality ratio (95% CI)
2005
2007
2008
2009
2010
Figure 25:
Standardised mortality ratio by individual hospital, 2010
Expected number of deaths
S
Average 2SD limits 3SD limits
KG R