Dengan Hormat,
Dengan mengucap Puji Syukur Kehadirat Tuhan
Yang Maha Esa, buku “Laporan Statistik
Asuransi Gempa Bumi Indonesia (LSAGBI)
Desember 2015” telah selesai disusun.
Penyusunan LSAGBI ini selaras dengan salah
satu Visi MAIPARK yaitu menjadi “Center Of
Excellence” dan sebagai upaya dalam
memberikan pelayanan yang terbaik bagi
Industri Asuransi Umum di Indonesia khususnya
mengenai statistik serta pengetahuan risiko
gempa bumi.
Sebagai salah satu publikasi rutin, LSAGBI ini
memuat hasil kajian risiko-risiko gempa bumi
terkait data
exposure
, premi nasional, jumlah
risiko dan perkembangan risiko gempa bumi. Di
dalam laporan ini kami juga menyajikan ulasan
aktuaria dan risiko
exposure
dari sudut pandang
asuransi gempa bumi
Dukungan dari seluruh perusahaan asuransi
umum sangat berarti bagi kami dalam upaya
pengembangan laporan statistik ini. Kami
menyadari kebutuhan penyempurnaan buku ini
sangat tinggi sehingga kritik maupun saran
sangat kami harapkan.
Akhir kata, semoga laporan ini dapat menjadi
referensi
yang
berkualitas
dan
dapat
memberikan manfaat tidak hanya bagi
perusahaan yang menangani asuransi gempa
bumi, namun juga bagi Industri Asuransi Umum
di Indonesia. Kami mohon maaf apabila masih
ditemukan kesalahan data dan informasi yang
disajikan dalam buku ini.
Dear Sir / Madam,
Our gratitude to God Almighty, the “Indonesian
Earthquake Insurance Statistic Report as at
December 2015” is ready to publish. This report
publication i
s aligned with MAIPARK’s vision,
which is to be a "Center of Excellence” and also
to provide the best service for the General
Insurance Industry in Indonesia, especially
statistic and earthquake risks knowledge.
As a regular publication, it contains earthquake
risks study related to the national Exposure,
premium, number of risks and development of
the earthquake risks management. We also
include actuarial and Exposure risks reviews
from earthquake insurance point of view.
Support from the General Insurance Industry
will be meaningful to us in order to improve this
Statistic Report. We realize the need for
improvement of this report is very high so that
critics and suggestions are appreciate.
Finally, we hope that this report could be used
as a qualified reference and will be beneficial for
all general insurance industries in Indonesia.
We apologize for any possible data and
information errorspresented in this report.
Hormat Kami,
Sincerely,
Hal.
Page
Kata pengantar………
...
……i
Daftar Isi
……….iii
Content……
..
……….i
Foreword………..iii
A.
Umum
………
1
B.
Struktur Pasar
……….2
C.
Premi Bruto dan
Exposure
……….2
D.
Jumlah Risiko
………..
3
E.
Incurred Claim
………...
..
6
F.
Ulasan Aktuaria: Pengaruh Deductible
pada Distribusi Frekuensi Klaim dan Besar
Klaim
………..
.13
G.
Ulasan Asuransi: Gempabumi yang
mengubah..
………
....22
A.
General
………...1
B.
Market Structure
………2
C.
Gross Premium and Exposure
………2
D.
Number of Risk
………..
3
E.
Incurred Claim
………
6
F.
Actuary Commentary:
The
Effect of
Deductibles on Claims Frequency and Claims
Severity Distributions
………
...13
G.
Insurance Commentary: Earthquake that
Change………..………
22
Distribusi
Exposure
Gempa Bumi Indonesia
per Provinsi,
Underwriting Year
2016, per 30
Juni 2016
………...
27
Distribusi Gempa Bumi Indonesia M > 5 dan
Claim Incurred
2016
………
28
Distribusi
Exposure
Gempa Bumi Indonesia
per Provinsi,
Underwriting Year
2015, per 30
Juni 2016, Distribusi Gempa Bumi Indonesia M
>
5
dan
Claim
Incurred
UY
2016
………...
.29
Indonesian Earthquake Exposure Distribution by
Province, Underwriting Year 2016, as at 30 June
2016
……….
27
Indonesian Earthquake Distribution M > 5 and
Claim Incurred 2016
………...
28
Indonesian Earthquake Exposure Distribution by
Province, Underwriting Year 2016, per 30 June
Tabel 2.5.
Exposure
Per Kelas Konstruksi...37
Table 2.1. Exposure By Cresta Zone ... 30
Table 2.2. Exposure By Occupation ... 32
Table 2.3. Exposure By Interest ... 34
Table 2.4. Exposure By Province
…………
...36
Table 2.5. Exposure By Class of Construction..37
Iktisar Statistik Asuransi Gempa Bumi
Indonesia Juni 2016
Statistic
Overview
of
Indonesian
Earthquake Insurance June 2016
Exposure
Asuransi Gempa Bumi
Indonesia
Indonesian Earthquake Insurance
Exposure
Peta
Map
Tabel 3.1. Premi Bruto Per Cresta Zone
……
.39
Tabel 3.2. Premi Bruto Per Okupasi
…………
41
Tabel 3.3. Premi Bruto Per
Interest………...
43
Tabel
3.4.
Premi
Bruto
Per
Provinsi
………...
...
…
45
Tabel 3.5. Premi Bruto Per Kelas Konstruksi
... 46
Table 3.1. Gross Premium by Cresta Zone
……39
Table 3.2. Gross Premium by Occupation...41
Table 3.3. Gross Premium by Interest...43
Table 3.4. Gross Premium by Province
……..…
45
Table 3.5. Gross Premium by Class of
Construction
………
46
Tabel 4.1. Jumlah Risiko Per Cresta
Zone
.. 48
Tabel 4.2. Jumlah Risiko Per Okupasi ... 50
Table 4.3. Jumlah Risiko Per Kelas Konstruksi
... 52
Table 4.4. Jumlah Risiko Per Provinsi...
...…
54
Table 4.1. Number of Risk By Cresta Zone ... 48
Table 4.2. Number of Risk By Occupation ... 50
Table 4.3. Number of Risk By Construction Class
………
...52
Table 4.4. Number of Risk By Province ...
….
54
Tabel 5.1. Frekuensi Klaim Per Cresta Zone.55
Tabel 5.2. Frekuensi Klaim Per Okupasi
……
57
Tabel 5.3. Frekuensi Klaim Per Provinsi
……
59
Tabel 5.4. Klaim Per Cresta Zone
………
60
Tabel 5.5. Klaim Per Okupasi
………..
62
Tabel 5.6. Klaim Per Provinsi
………..
64
Table 5.1. Claim Frequency By Cresta Zone
…..
55
Table 5.2. Claim Frequency By Occupation
……
57
Table 5.3. Claim Frequency By Province
………
59
Table 5.4. Claim By Cresta Zone
……….
60
Table 5.5. Claim By Occupation
………...
62
Table 5.6. Claim By Province
………..
64
Underwriting Year
2012 - 2016, Seluruh
Okupasi
……….
65
Underwriting Year
2016, Seluruh Okupasi
…
66
Underwriting Year
2015, Seluruh Okupasi
…
67
Underwriting Year
2014, Seluruh Okupasi
…
68
Underwriting Year
2013, Seluruh Okupasi
…
69
Underwriting Year
2012, Seluruh Okupasi
…
70
Underwriting
Year
2012
-
2016,
All
Occupation……….
.65
Underwriting Year 2016, All Occupation
……….
66
Underwriting Year 2015, All Occupation
……….
67
Underwriting Year 2014, All Occupation
……….
68
Underwriting Year 2013, All Occupation
………
69
Underwriting Year 2012, All Occupation
……….7
0
Premi Bruto Asuransi Gempa Bumi
Indonesia
Indonesian Earthquake Insurance Gross
premium
Jumlah Risiko Asuransi Gempa Bumi
Indonesia
Indonesian Earthquake Insurance Number
of Risk
Klaim Asuransi Gempa Bumi
Indonesia
Indonesian Earthquake Insurance Claim
Okupasi Agrikultural
……….
71
Okupasi Komersial
………..
72
Okupasi Industrial
………
73
Okupasi Residensial
………
74
Occupation Agricultural
……….
71
Occupation Commercial
………...
72
Occupation Industrial
………
73
Occupation Residential
……….
74
Okupasi Agrikultural
……….
75
Okupasi Komersial
………..
76
Okupasi Industrial
………
77
Okupasi Residensial
………
78
Occupation Agricultural
……….
75
Occupation Commercial
………...
76
Occupation Industrial
………
77
Occupation Residential
……….
78
Okupasi Agrikultural
……….
79
Okupasi Komersial
………..
80
Okupasi Industrial
………8
1
Okupasi Residensial
………8
2
Occupation Agricultural
……….
79
Occupation Commercial
………...
80
Occupation Industrial
………8
1
Occupation Residential
……….82
Okupasi Agrikultural
……….
83
Okupasi Komersial
………..
84
Okupasi Industrial
………
85
Okupasi Residensial
……….………..
86
Occupation Agricultural
……….
83
Occupation Commercial
………...
84
Occupation Industrial
………
85
Occupation Residential
………
86
Okupasi Agrikultural
……….
87
Okupasi Komersial
………...
...88
Okupasi Industrial
……….
89
Okupasi Residensial..
………...
..90
Occupation Agricultural
……….
87
Occupation Commercial
………
...88
Occupation Industrial
………89
Occupation Residential
……….9
0
Profil Risiko dan Klaim
Underwriting
Year
Per Okupasi 2016
Risk and Profile Claim Underwriting Year
2016 By Occupation
Profil Risiko dan Klaim
Underwriting
Year
Per Okupasi 2015
Risk and Profile Claim Underwriting Year
2015 By Occupation
Profil Risiko dan Klaim
Underwriting
Year
Per Okupasi 2014
Risk and Profile Claim Underwriting Year
2014 By Occupation
Profil Risiko dan Klaim
Underwriting
Year
Per Okupasi 2013
Risk and Profile Claim Underwriting Year
2013 By Occupation
Profil Risiko dan Klaim
Underwriting
Year
Per Okupasi 2012
Exposure
, Premi Bruto, Jumlah Risiko & Klaim
per
Cresta
Zone,
Underwriting
Year
2016
………91
Exposure
, Premi Bruto, Jumlah Risiko & Klaim
per
Cresta
Zone,
Underwriting
Year
2015
………9
2
Exposure
, Premi Bruto, Jumlah Risiko & Klaim
per
Cresta
Zone,
Underwriting
Year
2014
………93
Exposure
, Premi Bruto, Jumlah Risiko &
Klaim per Cresta Zone,
Underwriting Year
2013
………94
Exposure
, Premi Bruto, Jumlah Risiko &
Klaim per Cresta Zone,
Underwriting Year
2012
………95
Exposure, Gross Premium, Number of Risk &
Claim by Cresta Zone, Underwriting Year
2013
……….94
Exposure, Gross Premium, Number of Risk &
Claim by Cresta Zone, Underwriting Year
2012
………
.95
Exposure
, Premi Bruto, Jumlah Risiko & Klaim
per
Okupasi,
Underwriting
Year
2016
………96
Exposure
, Premi Bruto, Jumlah Risiko & Klaim
per
Okupasi,
Underwriting
Year
2015
………97
Exposure
, Premi Bruto, Jumlah Risiko & Klaim
per
Okupasi,
Underwriting
Year
2014
………98
Exposure
, Premi Bruto, Jumlah Risiko &
Klaim per Okupasi,
Underwriting Year
2013
………99
Exposure
, Premi Bruto, Jumlah Risiko &
Klaim per Okupasi,
Underwriting Year
2012
………..10
0
Exposure, Gross Premium, Number of Risk &
Claim by Occupation, Underwriting Year
2016
………
.96
Exposure, Gross Premium, Number of Risk &
Claim by Occupation, Underwriting Year
2015
………
.97
Exposure, Gross Premium, Number of Risk &
Claim by Occupation, Underwriting Year
2014
………
.98
Exposure, Gross Premium, Number of Risk &
Claim by Occupation, Underwriting Year
2013
………
.99
Exposure, Gross Premium, Number of Risk &
Claim by Occupation, Underwriting Year
2012
………10
0
Exposure,
Premi Bruto, Jumlah Risko
dan Klaim Asuransi Gempa Bumi
Indonesia Per Cresta Zone
Indonesian Earthquake Insurance Exposure,
Gross Premium, Number of Risk and Claim
By Cresta Zone
Exposure,
Premi Bruto, Jumlah Risko
dan Klaim Asuransi Gempa Bumi
Indonesia Per Okupasi
Exposure
, Premi Bruto, Jumlah Risiko & Klaim
per Provinsi,
Underwriting Year
2016
…….. 10
1
Exposure
, Premi Bruto, Jumlah Risiko & Klaim
per Provinsi,
Underwriting Year
2015
……...
102
Exposure
, Premi Bruto, Jumlah Risiko & Klaim
per Provinsi,
Underwriting Year
2014
……...
103
Exposure
, Premi Bruto, Jumlah Risiko & Klaim
per Provinsi,
Underwriting Year
2013
………
104
Exposure
, Premi Bruto, Jumlah Risiko & Klaim
per Provinsi,
Underwriting Year
2012
………105
Exposure, Premi Bruto, Jumlah Risiko & Klaim
per
Provinsi,
Underwriting
Year
2016
………..
101
Exposure, Premi Bruto, Jumlah Risiko & Klaim
per Provinsi, Underwriting Year 2015
………...10
2
Exposure, Premi Bruto, Jumlah Risiko & Klaim
per Provinsi, Underwriting Year 2014
………...
103
Exposure, Premi Bruto, Jumlah Risiko & Klaim
per Provinsi, Underwriting Year
2013
………
..104
Exposure, Premi Bruto, Jumlah Risiko & Klaim
per Provinsi, Underwriting Year
2012
………..
105
Lampiran
1.
Daftar Istilah…….………
106
2.Tarif
asuransi
Gempa
Bumi
Indonesia
…….……….………...
...108
3. Zona Asu
ransi Gempa Bumi Indonesia………11
2
4. Cr
esta Zone Indonesia………12
2
5.
Skala
First Loss
………
129
6. Tabel
Short Periode
kurang dari 1
tahun
…..………
..
………
..130
7. Skala
Indemnity Period
………
...131
Attachment
1.
Glossaries………..…..106
2.
Indonesian
Earthquake
Insurance
Tariff………..108
3. Cresta Zone and Zone Table………112
4. Indonesia Cresta Zone ……….122
5. First Loss Scale …..………129
6. Short Period Table Less Than One Year
Period………130
7. Indemnity Period Scale………..…131
Referensi
Reference
1. Otoritas Jasa Keuangan (OJK).
2. Badan Pusat Statistik (BPS).
1. Financial Service Authority (OJK).
2. Central of Statistic Bureau (BPS).
*)
Laporan Statistik ini dapat diperoleh di website
PT Reasuransi MAIPARK Indonesia
Indonesia Per Provinsi
Ikhtisar Statistik Asuransi Gempa Bumi Indonesia Juni 2016
S
tatistic Overview of Indonesia Earthquake Insurance June 2016
A. Umum
A. General
Berdasarkan data Badan Pusat Statistik,
pertumbuhan ekonomi Indonesia berdasarkan
Produk Domestik Bruto (Harga Berlaku) triwulan
II terhadap triwulan sebelumnya naik sebesar
4,02% (Rp2.942,00 triliun menjadi Rp.3.086,60
triliun).
Dari sisi Industri Asuransi Umum, menurut
Asosiasi Asuransi Umum Indonesia, dapat
dilihat bahwa Premi Bruto untuk kelas bisnis
harta benda (triwulan II tahun 2015 ke triwulan II
2016) mengalami kenaikan sebesar 9,6%
(Rp.7.942,93 miliar menjadi Rp.8.704,58 miliar)
Based on Central of Statistics Bureau data,
Indonesia economic growth by Gross Domestic
Bruto (Current Price) second quarter compare
to
previous
quarter
increased
4.02%
(IDR2,942.00 trillion to IDR.3,086.60 trillion)
From the General Insurance Industry, based on
General Insurance Indonesia Assosiation, can
be seen that Gross Premium for property class
of business (second quarter 2015 compare to
second
quarter
2016)
increase
9.6%
(IDR.7,942.93 billion to IDR.8,704.58 billion)
Produk Domestik Bruto atas dasar Harga Berlaku dan Harga Konstan 2010 - Kuartal II 2016
Gross Domestic Product by Current Price and Constant Price 2010 - second quarter 2016
Triw ulan I-2016 /
Quarter 1- 2016
Triw ulan II-2016 /
Quarter 2 - 2016
Triw ulan I-2016 /
Quarter 1 - 2016
Triw ulan II-2016 /
Quarter 2 - 2016
Produk Dom estik Bruto
(Gross Dom estic Product)
2,942.00
3,086.60
2,262.30
2,353.20
dalam triliun rupiah
in trillion rupiah
Harga Berlaku (Current price)
Harga Konstan 2010/ Constant price 2010
Premi dan Klaim Bruto Kelas Bisnis Harta Benda - Kuartal II 2016
Gross Premium and Claim Property class of business - Second Quarter 2016
Kelas Bisnis
Class of Business
Triwulan I-2015
Triwulan I-2016
Triwulan I-2015 Triwulan I-2016
Harta Benda
7,942.93
8,704.58
3,431.57
3,400.25
dalam miliar rupiah
in billion rupiah
dan Klaim Bruto turun -0,9% (Rp.3.431,57 miliar
menjadi Rp.3.400,25 miliar ).
and Gross Claim decrease -0.9% (IDR.
3.431,57 billion to IDR.3,400.25 billion).
B. Struktur Pasar
B. Market Structure
.
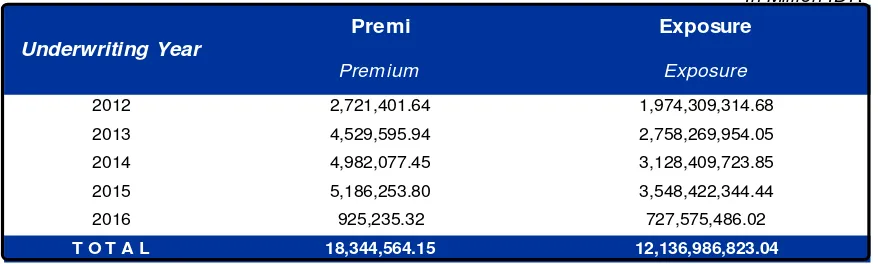
C. Premi Bruto
C. Gross Premium
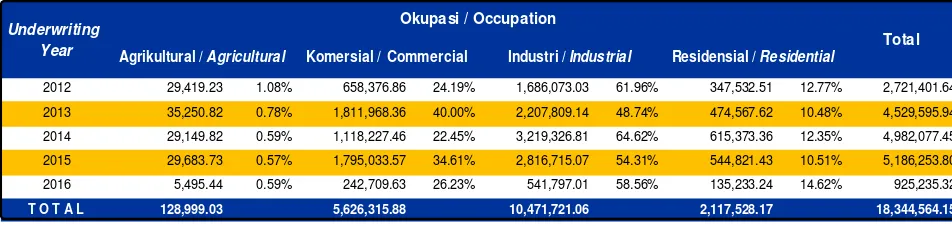
Tabel 1.1 menyajikan rincian premi bruto
berdasarkan jenis okupasi dari
Underwriting
Year
2012 hingga
Underwriting Year
2016.
Berdasarkan data tersebut dapat kita lihat
bahwa untuk Okupasi Industrial dan Residensial
pada
Underwriting Year
2012-2014 mengalami
trend kenaikan, namun dua okupasi lainnya
menurun di
Underwriting Year
2014. Penurunan
pada Okupasi Agrikultural ini diakibatkan adanya
penurunan penutupan di Provinsi Jawa Barat
khususnya di Kab. Karawang. Selain itu
penurunan ini juga disebabkan adanya
penurunan penutupan di Provinsi Bali dan Jawa
Barat, masing-masing adalah Kab. Karangasem
dan Kab. Bandung.
The table 1.1 shows the details of gross
premium
based
on
occupation
from
Underwriting Year 2011 to Underwriting Year
2015.
We could see based to Industrial and
Residential Occupation data have increase
trend, but other two occupation in Underwriting
Year 2012-2014 have decrease in Underwriting
Year 2014. The decrease in Agriculture
Occupation because of decrease cover in East
Java Province especially City of Karawang. The
decrease also caused by decreasing cover in
Bali Province and East Java i.e. Karangasem
and Bandung District respectively.
Struktur Pasar Industri Asuransi Umum Indonesia
Mark et Structure of the Indonesia General Insurance Industry
Kategori
Jumlah
Perusahaan Asuransi Umum
76
Perusahaan Reasuransi
6
Asuransi Sosial
2
Perusahaan Asuransi Wajib
3
Sumber: buku Direktori 2015: Industri Keuangan Non Bank
D. Jumlah Risiko
D
.
Number of Risk
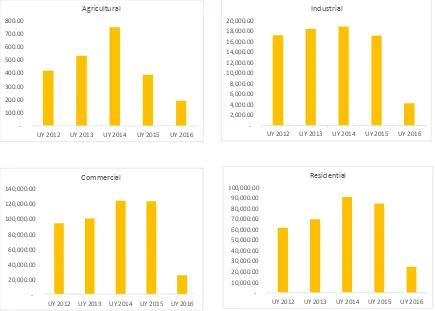
Dari Tabel 1.2 dapat kita peroleh informasi
bahwa jumlah risiko Okupasi Komersial terbesar
ada di
Underwriting Year
2014 yaitu 124.558.
Sedangkan jumlah risiko Okupasi Komersial di
Underwriting Year
2016 adalah 25.085 atau
sebesar 20,14% atau seperlima dari jumlah
risiko Okupasi Komersial di
Underwriting Year
2014. Jika pola pensesian dan proses validasi
bordero tidak berubah, maka jumlah risiko
Okupasi Komersial di
Underwriting Year
2016
masih akan meningkat.
Jumlah Risiko pada Okupasi Agrikultural di
Underwriting Year
2015 dibandingkan dengan
Underwriting Year
2014 baru mencapai
51.79%(390 dibanding 753), berbeda dengan 3
okupasi lainnya yang rata-rata diatas 90%. Hal
ini diakibatkan karena adanya penurunan jumlah
risiko penutupan sebagian besar di Provinsi
Sumatera Utara dan Kalimantan Timur.
Penurunan yang relative signifikan terjadi di
Provinsi Sumatera Utara adalah di Kab.
Simalungun, Kab. Tapanuli Selatan dan Kab.
From Table 1.2 we can find information that
the biggest number of risks for Commercial
Occupation was in Underwriting Year 2014 i.e
124,558
.
While number of risks
for
Commercial
Occupation in Underwriting Year 2016 was
25,085 i.e. 20.14% or fifth of the number of risks
Commercial Occupancy in Underwriting Year
2014. If the cession and bordereoux validation
processing pattern unchanged, then number of
risks for the Commercial Occupation in
Underwriting Year 2016 still increased.
Number of risks in Agriculture Occupation
in Underwriting Year 2015 compared to
Underwriting Year 2015 reached 51.79% (390
compare to 753), different to other three
occupation that average above 90%. This is
because of the decrease number of risks cover
mostly in North Sumatra and East Kalimantan
Province. Relatively significant decrease was in
North Sumatra Province i.e. Simalungun,
Tapanuli Selatan dan Asahan District. While in
Dalam Jutaan Rupiah
In Million Rupiah
2012
29,419.23
1.08%
658,376.86
24.19%
1,686,073.03
61.96%
347,532.51
12.77%
2,721,401.64
2013
35,250.82
0.78%
1,811,968.36
40.00%
2,207,809.14
48.74%
474,567.62
10.48%
4,529,595.94
2014
29,149.82
0.59%
1,118,227.46
22.45%
3,219,326.81
64.62%
615,373.36
12.35%
4,982,077.45
2015
29,683.73
0.57%
1,795,033.57
34.61%
2,816,715.07
54.31%
544,821.43
10.51%
5,186,253.80
2016
5,495.44
0.59%
242,709.63
26.23%
541,797.01
58.56%
135,233.24
14.62%
925,235.32
T O T A L
128,999.03
5,626,315.88
10,471,721.06
2,117,528.17
18,344,564.15
Tabel 1.1 Premi Bruto dan Rasio Berdasarkan Okupasi per 30 Juni 2016
Table 1.1 Gross Premium and Ratio By Occupation as at 30 June 2016
Underwriting
Year
Okupasi / Occupation
Total
Asahan. Sedangkan di Provinsi Kalimantan
Timur, penurunan jumlah risiko penutupan yang
relative signifikan ada di Kota Balikpapan.
East Kalimantan, relatively significant decrease
in number of risks cover was in Balikpapan city.
Jika terdapat asosiasi antara kontribusi
premi dengan banyaknya risiko maka belum
tentu asosiasi tersebut berbentuk linear dan
If there is any association between the
premium contribution and the number of risks then
the association is not necessarily linear nor
Tabel 1.2 Jumlah Risiko Berdasarkan Okupasi per 30 Juni 2016
Table 1.2 Number of Risk By Occupation as at 30 June 2016
Jumlah /
Total
%
Jumlah /
Total
%
Jumlah /
Total
%
Jumlah /
Total
%
Jumlah /
Total
%
Agricultural / Agricultural A 420 0.24 535 0.28 753 0.32 390 0.17 189 0.35
Komersial / Commercial C 94,595 54.42 100,683 53.12 124,558 52.94 123,845 54.78 25,085 46.31
Industrial / Industrial I 17,199 9.89 18,433 9.73 18,903 8.03 17,165 7.59 4,236 7.82
Residensial / Residential R 61,613 35.45 69,873 36.87 91,061 38.70 84,669 37.45 24,661 45.52 173,827 100.00 189,524 100.00 235,275 100.00 226,069 100.00 54,171 100.00
Occupation
Jumlah / Total
Okupasi
U/Y 2012
U/Y 2013
U/Y 2014
U/Y 2015
U/Y 2016
Number of Risk By Occupation
As at 30 June 2016
UY 2012
UY 2013
UY 2014
UY 2015
UY 2016
Agricultural
UY 2012
UY 2013
UY 2014
UY 2015
UY 2016
Commercial
UY 2012
UY 2013
UY 2014
UY 2015
UY 2016
Industrial
UY 2012
UY 2013
UY 2014
UY 2015
UY 2016
positif. Hal ini dibuktikan dengan apabila
melihat dari premi bruto tertinggi berada di
okupasi industrial sedangkan banyak risiko
tertinggi berada pada okupasi komersial.
positive. This is proved which the highest gross
premium is on the industrial occupation while the
highest total risk is under commercial occupation.
Berdasarkan data okupasi, okupasi
Komersial terdiri dari beberapa kode okupasi.
Jumlah risiko terbesar berdasarkan kode
okupasi di
Underwriting Year
2012
–
2016
adalah sebagai berikut:
Based on occupation data, Commercial
occupation consist of several occupation codes.
The highest number of risks by occupation code
in Underwriting Year 2012
–
2016 are as follows:
Okupasi Residensial terdiri dari beberapa
kode okupasi. Jumlah risiko terbesar
berdasarkan kode okupasi di
Underwriting
Year
2012
–
2016 adalah sebagai berikut:
Residential occupation consist of several
occupation codes. The highest number of risks by
occupation code in Underwriting Year 2012
–
2016 are as follows:
Jumlah Risiko Terbesar pada Okupasi Residensial Berdasarkan Kode Okupasi per 30 Juni 2016
The Highest Number Of Risk in Residential Occupation as at 30 June 2016 by Occupation Code
U/Y 2012
U/Y 2013
U/Y 2014
U/Y 2015
U/Y 2016
Total
Total
Total
Total
Total
Dwelling Houses, not classified
as Shop-Houses (Ruko), not
exceeding 3 storeys.
2976
35,736
34,338
48,485
44,746
14,226
35,736
34,338
48,485
44,746
14,226
Description & Occupation Code
Total
Jumlah Risiko Terbesar pada Okupasi Komersial Berdasarkan Kode Okupasi per 30 Juni 2016
The Highest Number Of Risk in Commercial Occupation as at 30 June 2016 by Occupation Code
U/Y 2012
U/Y 2013
U/Y 2014
U/Y 2015
U/Y 2016
Total
Total
Total
Total
Total
Shops
2934
0
0
33,421
33,483
6,768
Shops - Subject to Waranty A
29341
23,045
16,013
0
0
0
Private Warehouses and
Storehouses - Subject to
Warranty A
29371
13,080
14,355
0
0
0
Veem and Bonded Warehouses -
Subject to Warranty A
293941
2
3
0
0
0
36,127
30,371
33,421
33,483
6,768
Description & Occupation Code
E.
Incurred Claim
E. Incurred Claim
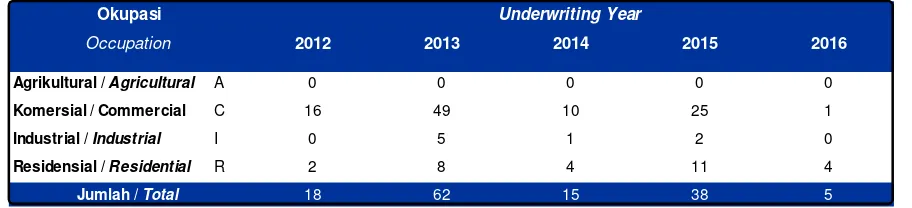
Berdasarkan tabel 1.3, frekuensi klaim
gempa bumi paling banyak terjadi di
Underwriting Year
2013 yaitu sebanyak 62
klaim dan didominasi okupasi Komersial
sebanyak 49 klaim. Hal ini disebabkan oleh
kejadian Erupsi Gunung Kelud, 13 Februari
2014. Klaim akibat Erupsi ini sebagian besar
berasal dari Provinsi Jawa Timur khususnya
Kota & Kab. Kediri, Kab. Malang dan Kota
Surabaya.
Based on table 1.3, the highest earthquake
claim frequency occurred in Underwriting Year
2013 was 62 claims and it dominated by
Commercial occupation of 49 claims. It was
caused by Kelud Eruption, on 13 February 2014.
This claim due to Eruption was mostly come from
East Java Province especially City and District of
Kediri, Malang District and Surabaya city.
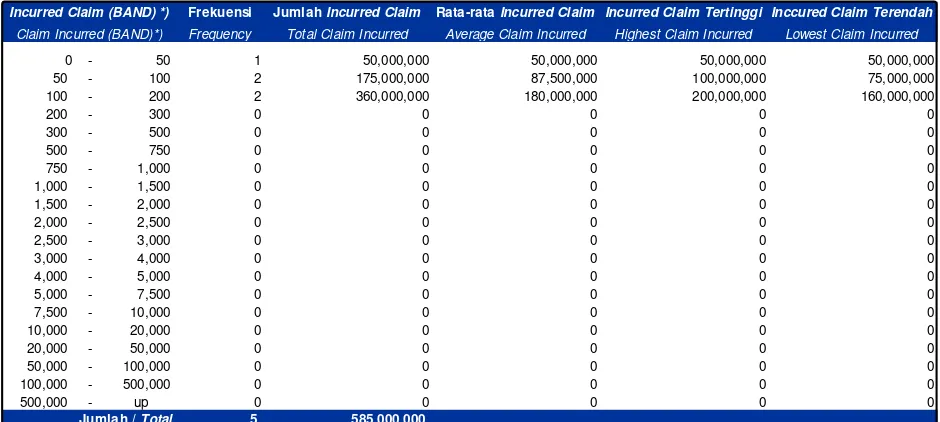
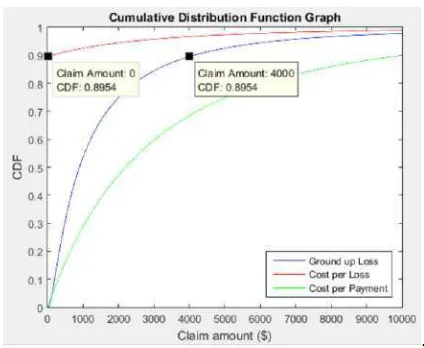
Berdasarkan Tabel 1.4 dan grafik terlihat
bahwa untuk frekuensi klaim tinggi berada
pada Total
Incurred Claim
yang relatife kecil,
sedangkan untuk frekuensi klaim kecil berada
pada Total Incurred Claim yang relative besar.
Gambaran tersebut adalah untuk Underwriting
Year 2016 selama 6 bulan terakhir dimana
masih memungkinkan terjadi perubahan jika
terjadi event ke depan.
Based on table 1.4 and graph below it can be
seen that the high frequency claims lies in
relatively small Total Claim Incurred, while low
frequency claims lies in relatively big Total Claim
Incurred. The picture was for Underwriting Year
2016 during the last six month which probably any
changes if an event occurs in the future.
2012
2013
2014
2015
2016
Agrikultural / Agricultural
A
0
0
0
0
0
Komersial / Commercial
C
16
49
10
25
1
Industrial / Industrial
I
0
5
1
2
0
Residensial / Residential
R
2
8
4
11
4
18
62
15
38
5
Tabel 1.3 Frekwensi Klaim Berdasarkan Okupasi per 30 Juni 2016
Occupation
Jumlah /
Total
Table 1.3 Claim Frequency By Occupation as at 30 June 2016
Underwriting Year
*) Dalam Rupiah *) In IDR
Frekuensi
Jumlah Incurred Claim
Rata-rata Incurred Claim Incurred Claim Tertinggi Inccured Claim Terendah
Frequency
Total Claim Incurred
Average Claim Incurred
Highest Claim Incurred
Lowest Claim Incurred
0
-
50
1
50,000,000
50,000,000
50,000,000
50,000,000
Table 1.4 Frequency Incurred Claim Underwriting Year 2016 as at 30 June 2016
Claim Incurred (BAND)*)
Incurred Claim (BAND) *)
Jumlah / Total
Dari tabel 1.5 tampak bahwa jumlah klaim
terbesar berada pada
Underwriting Year
2013.
Klaim yang terbesar adalah pada okupasi
Komersial, yaitu 99.63% dari total klaim di
Underwriting Year
2013 atau sebesar
Rp.271,3 miliar.
From the table 1.5 below, it shows that the
largest claim is in the Underwriting Year 2013. The
largest claim is under Commercial occupation that
is 99.63% of the total claim in Underwriting Year
2013 or
Rp.
271.3 billion.
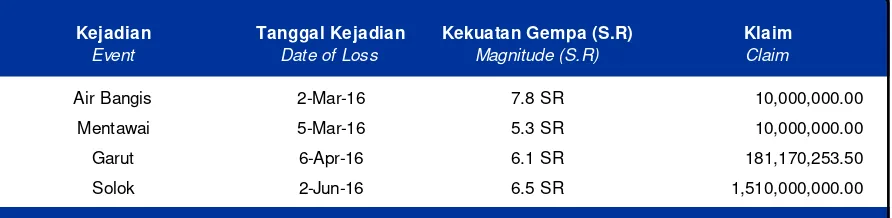
Tabel 1.6 menyajikan kejadian Gempa
Bumi Tahun 2016 dan
Incurred Claim
sampai
dengan 30 Juni 2016.
Table 1.6 shows earthquake events occurred
in 2016 and the corresponding incurred claims as
at 30 June 2016.
Table 1.5 Claim Amount By Occupation as at 30 June 2016
Dalam RupiahIn IDR
2012
2013
2014
Jumlah / Total % Jumlah / Total % Jumlah / Total % Jumlah / Total % Jumlah / Total % Agrikultural / Agricultural A 0.00 0.00 0.00 0.00 0.00 0.00 0.00 0.00 0.00 0.00 Komersial / Commercial C 1,636,685,520.49 92.33 271,246,520,180.70 99.63 624,550,950.05 67.66 5,959,405,013.50 38.45 200,000,000.00 0.00 Industrial / Industrial I 0.00 0.00 890,057,888.00 0.33 200,000,000.00 21.67 7,680,965,985.00 49.56 0.00 0.00 Residensial / Residential R 135,984,751.35 7.67 104,486,089.00 0.04 98,536,193.51 10.67 1,857,064,680.00 11.98 385,000,000.00 0.00 1,772,670,271.84 100.00 272,241,064,157.70 100.00 923,087,143.56 100.00 15,497,435,678.50 100.00 585,000,000.00 0.00
2016
Jumlah / Total
Underwriting Year
Tabel 1.5 Jumlah Klaim Berdasarkan Okupasi per 30 Juni 2016
2015
Okupasi / Occupation
Tabel 1.6 Kejadian Gempa Bumi Tahun 2016 dan Klaim per 30 Juni 2016
Table 1.6 Earthquak e Event in 2016 and Claim as at 30 June 2016
Dalam Rupiah
In IDR
Kejadian
Tanggal Kejadian
Kekuatan Gempa (S.R)
Event
Date of Loss
Magnitude (S.R)
Air Bangis
2-Mar-16
7.8 SR
10,000,000.00
Mentawai
5-Mar-16
5.3 SR
10,000,000.00
Garut
6-Apr-16
6.1 SR
181,170,253.50
Solok
2-Jun-16
6.5 SR
1,510,000,000.00
Claim
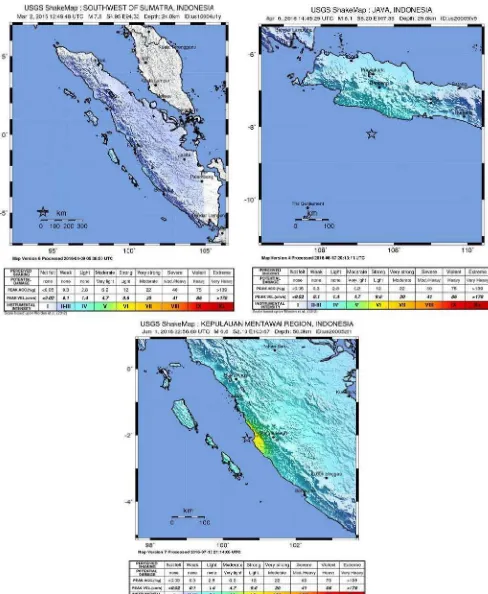
Gambar 3. Peta Intensitas dan ShakeMap Gempa Air Bangis, Garut dan Solok setelah kejadian (sumber peta intensitas:
http://www.earthquake.usgs.gov
).
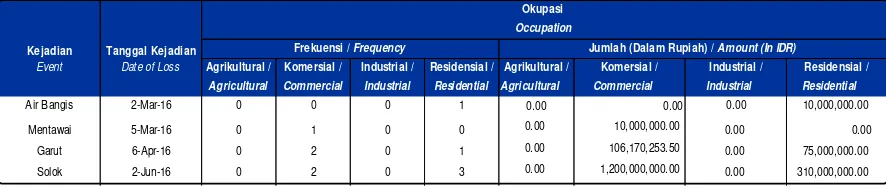
Tabel 1.7 menyajikan klaim untuk
event
Air
Bangis, Mentawai, Garut dan Solok perjenis
okupasi. Dapat dilihat bahwa okupasi yang
terdampak pada beberapa event tersebut adalah
Komersial dan Residensial. Hal ini dimungkinkan
masih sedikit/belum adanya penutupan pada
Okupasi Industrial dan Agrikultural sehingga
dampak ke Okupasi tersebut belum ada atau
mungkin laporan klaim untuk kedua Okupasi
tersebut belum masuk.
Table 1.7 shows Air Bangis, Mentawai,
Garut and Solok event by occupation. It can be
seen that Commercial and Residential
Occupation
affected
with
some event
mentioned. This is probably a little/there is not
yet cover in Industrial and Agricultural
Occupation so the impact to the occupation
does not exist or may the claim report was not
received yet (Incurred But Not Reported
).
Tabel di bawah ini adalah daftar klaim
terbesar sampai dengan tanggal 30 Juni 2016.
Event Pariaman merupakan event dengan besar
klaim terbesar dalam kurun waktu 5 tahun pasca
event Aceh.
The table below is a list of the largest claims
as at 30 June 2016. Pariaman event was the
biggest claim in the period of 5 years since the
Aceh event.
Tabel 1.7 Kejadian Gempa Bumi Tahun 2016 dan Klaim per Okupasi per 30 Juni 2016 Table 1.7 Earthquak e Event in 2016 and Claim per Occupation as at 30 June 2016
Event Date of Loss Agrikultural / Komersial / Industrial / Residensial /
Agricultural Commercial Industrial Residential Agricultural Commercial Industrial Residential
Air Bangis 2-Mar-16 0 0 0 1 10,000,000.00
Mentawai 5-Mar-16 0 1 0 0 0.00
Garut 6-Apr-16 0 2 0 1 75,000,000.00
Solok 2-Jun-16 0 2 0 3 310,000,000.00
Occupation
Residensial / Agrikultural / Komersial / Industrial /
Kejadian Tanggal Kejadian
Okupasi
Frekuensi / Frequency Jumlah (Dalam Rupiah) / Amount (In IDR)
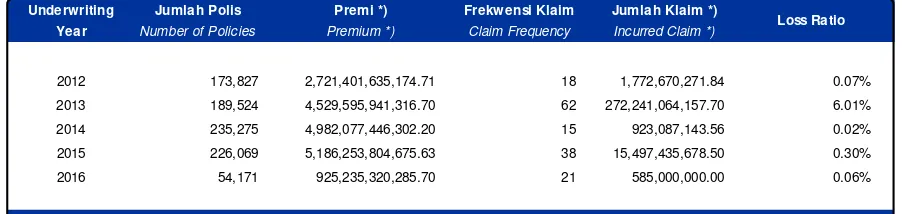
Tabel 1.8 menyajikan data jumlah polis dan
loss ratio per 30 Juni 2016. Tabel tersebut
menunjukkan loss ratio
Underwriting Year
2016
masih lebih kecil dari 5
Underwriting Year
.
Sedangkan loss ratio tertinggi berada pada
Underwriting Year
2013 sebesar 6.01%. Hal ini
dipengaruhi oleh nilai klaim yang cukup tinggi yang
mayoritas disebabkan dari Erupsi Gunung Kelud
tahun 2014.
Table 1.8 shows number of policies, and
loss ratio as at 30 June 2016. The table show
that the biggest loss ratio was at Underwriting
Year 2013 i.e. 6.01%. It was influenced by
large amount of claim that resulting majority
from Kelud Eruption in 2014.
Dalam Rupiah
In IDR
No.
Kejadian
Tanggal Kejadian
Kekuatan Gempa (S.R)
Klaim
Event
Date of Loss
Magnitude (S.R)
Claim
1
ACEH
26-12-2004
9
781,709,354,691.64
2
YOGYA
27-05-2006
5.9
286,314,259,635.72
3
PADANG
06-03-2007
5.8
22,445,090,553.18
4
BENGKULU
12-09-2007
7.9
48,880,150,344.02
5
PADANG
16-08-2009
6.9
42,782,942,555.00
6
TASIKMALAYA
02-09-2009
7.3
24,305,724,396.26
7
PARIAMAN
30-09-2009
7.6
1,083,648,012,851.01
8
BIMA
09-11-2009
6.7
43,046,593,135.48
9
MERAPI
25-10-2010
*)
27,499,741,856.40
10
KELUD
13-02-2014
*)
322,962,107,319.64
*) Penyeba b terka i t l etus a n gunung bera pi
*) Caused by volcanic eruption
Daftar Klaim - Klaim Terbesar Posisi 30 Juni 2016
List of The Largest Claims as at 30 June 2016
Tabel 1.8 Jumlah Polis dan Loss Ratio per 30 June 2016
Table 1.8 Number of Policies and Loss Ratio as at 30 June 2016
Underwriting
Jumlah Polis
Premi *)
Frekwensi Klaim
Jumlah Klaim *)
Year
Number of Policies
Premium *)
Claim Frequency
Incurred Claim *)
2012
173,827
2,721,401,635,174.71
18
1,772,670,271.84
0.07%
2013
189,524
4,529,595,941,316.70
62
272,241,064,157.70
6.01%
2014
235,275
4,982,077,446,302.20
15
923,087,143.56
0.02%
2015
226,069
5,186,253,804,675.63
38
15,497,435,678.50
0.30%
2016
54,171
925,235,320,285.70
21
585,000,000.00
0.06%
Keterangan :
*) Dalam Rupiah*) In IDR