Statistik Asuransi Gempa Bumi Indonesia
2016
Indonesia Earthquake Insurance Statistics 2016
Kata Pengantar
Foreword
Bapak dan Ibu Direksi Perusahaan Asuransi yang
saya hormati,
Dengan mengucap Puji Syukur Kehadirat Tuhan
Yang Maha Esa, buku
“
Laporan Statistik Asuransi
Gempa Bumi Indonesia (LSAGBI) Desember 2016
”
telah selesai
disusun. Penyusunan LSAGBI ini
selaras dengan salah satu Visi MAIPARK yaitu
menjadi
“Center
Of
Excellence”
dan sebagai upaya
dalam memberikan pelayanan yang terbaik bagi
Industri Asuransi Umum di Indonesia khususnya
mengenai statistik serta pengetahuan risiko gempa
bumi.
Sebagai salah satu publikasi rutin, LSAGBI ini
memuat
hasil kajian risiko-risiko gempa bumi
terkait data exposure, premi nasional, jumlah risiko
dan perkembangan risiko gempa bumi. Di dalam
laporan ini kami juga menyajikan ulasan aktuaria
dan risiko exposure dari sudut pandang asuransi
gempa bumi. Kami melakukan analisis atas eksposur
utama kita di Jawa Bagian Barat yang kami lengkapi
dengan analisis Probable Maximum Loss untuk area
ini. Selain itu, data statistik nasional ini juga
memperlihatkan kecenderungan penurunan produksi
premi
dari
underwriting
risiko
bencana
oleh
perusahaan
asuransi
di
Indonesia
walaupun
penurunan
premi
ini
tidak
diimbangi
dengan
penurunan eksposurnya.
Seperti yang kita sadari bersama, dukungan dari
seluruh perusahaan asuransi umum sangat berarti
bagi kami dalam upaya pengembangan laporan
statistik ini agar dapat digunakan sebagai panduan
yang baik dalam kita melaksanakan bisnis
sehari-hari.
Akhir
kata,
kami
menyadari
kebutuhan
penyempurnaan buku ini sangat tinggi sehingga
kritik maupun saran sangat kami harapkan. Semoga
laporan ini dapat menjadi referensi yang berkualitas
dan dapat memberikan manfaat bagi perusahaan
yang menangani
asuransi
gempa bumisehingga
dapat
memperkuat
industri
asuransi
umum
di
Indonesia.
Kami
mohon
maaf
apabila
masih
ditemukan kesalahan
data dan informasi yang
disajikan dalam buku ini.
Hormat kami,
Dear Sir / Madam,
Our gratitude to God Almighty, the
“Indonesian
Earthquake Insurance Statistic Report as at
December 2016
”
is ready to publish. This report
publication is aligned with
MAIPARK’s
vision,
which is to be a "Center of
Excellence”
and also
to provide the best service for the General
Insurance
Industry
in
Indonesia,
especially
statistic and earthquake risks knowledge.
As a regular publication, it contains earthquake
risks study related to the national Exposure,
premium, number of risks and development of the
earthquake risks management. We also include
actuarial and Exposure risks reviews
from
earthquake insurance point of view. We do an
analysis to our main exposure in West Java that
also provide with Probable
Maximum Loss
analysis for this area. The national statistics also
show decreasing trend in premium production
from disaster risk underwriting by insurance
companies in Indonesia although the decline in
premiums is not followed by a decrease in
exposure.
Support from the General Insurance Industry will
be meaningful to us in order to improve this
Statistic Report.
We
realize
the
need
for
improvement of this report is very high so that
critics and suggestions are appreciate.
Finally, we hope that this report could be used as
a qualified reference and will be beneficial for all
general insurance industries in Indonesia. We
apologize for any possible data and information
errorspresented in this report.
Sincerely,
Yasril Y. Rasyid
President Director
Daftar Isi
Contents
Kata Pengantar...i
Foreword
Daftar Isi...ii
Contents
Keadaan Ekonomi 2016- Produk Domestik Bruto 2016...2
Economic Outlook 2016- Gross Domestic Product 2016
Keadaan Asuransi 2016
Insurance Outlook 2016:
Premi Asuransi 2016...3
Insurance Premium 2016
Industri Asuransi 2016...3
Insurance Industry 2016
Catatan Asuransi Gempa Bumi 2004 -2016:
Earthquake Insurance 2004-2016:
Premi 2004-2016 ...4
Premium 2004-2016
Eksposur 2004-2016 ...5
Exposure 2004-2016
10 Besar Klaim Events 2004-2016 ...6
Top 10 Claim Events 2004-2016
Premi Asuransi Gempa Bumi 2016:
Earthquake Insurance Premium 2016:
Premi Per Okupasi UY 2012-2016 ... 8
Premium by Occupation UY 2012-2016
Premi Per Interest UY 2012-2016 ... 9
Premium by Interest UY 2012-2016
Premi: Distribusi Okupasi UY 2016 ...10
Premium: Occupation Distribution UY 2016
Eksposur Asuransi Gempa Bumi 2016:
Earthquake Insurance Exposure 2016:
Eksposur Per Okupasi UY 2012-2016 ...11
Exposure by Occupation UY 2012-2016
Eksposur Per Interest UY 2012-2016 ...12
Exposure by Interest UY 2012-2016
Eksposur: Distribusi Okupasi UY 2016 ...13
Exposure: Occupation Distribution UY 2016
Jumlah Risiko Asuransi Gempa Bumi 2016:
Earthquake Insurance Number of Risk 2016:
Jumlah Risiko Per Okupasi UY 2012-2016 ...14
Number of Risk by Occupation UY 2012-2016
Klaim Events Asuransi Gempa Bumi 2016 ...15
Earthquake Insurance Claim Events 2016
Shakemap untuk Gempa Pidie dan Solok ...16
Shakemap for Pidie and Solok Event
Daftar Gempa Bumi 2016 Magnitudo
≥
6.0 Mw ...18
Earthquake List 2016 Magnitude
≥
6.0 Mw
Daftar Isi
Contents
Ulasan Aktuaria: Cadangan Atas Risiko Bencana ...20
Actuarial Review: Cat Reserve
Risk Analysis:
Risk Analysis:
Portfolio & PML Jawa Bagian Barat ...26
Portfolio & PML of Western Java
Catatan Gempa di Jakarta ...27
Historical
Earthquake in Jakarta
Data Detail:
Detail Data:
Tabel 2.1
National Aggregate Exposure By Cresta Zone ...30
Table 2.1
National Aggregate Exposure By Cresta Zone
Tabel 2.2
National Aggregate Exposure By Okupasi...32
Table 2.2
National Aggregate Exposure By Occupacy
Tabel 2.3
National Aggregate Exposure By Interest...34
Table 2.3
National Aggregate Exposure By Interest
Tabel 2.4
National Aggregate Exposure By Province...36
Table 2.4
National Aggregate Exposure By Province
Tabel 2.5
National Aggregate Exposure By Class Construction...37
Table 2.5
National Aggregate Exposure By Class Construction
Tabel 3.1
National Gross Premium By Cresta Zone...39
Table 3.1
National Gross Premium By
Cresta Zone
Tabel 3.2
National Gross Premium By Occupation...41
Table 3.2
National Gross Premium By
Occupation
Tabel 3.3
National Gross Premium By Interest ...43
Table 3.3
National Gross Premium By
Interest
Tabel 3.4
National Gross Premium By Province ...45
Table 3.4
National Gross Premium By
Province
Tabel 3.5
National Gross Premium By Class Construction ...46
Table 3.5
National Gross Premium By Class Construction
Tabel 4.1
Number Of Risk By Cresta Zone ...47
Table 4.1
Number Of Risk By Cresta Zone
Tabel 4.2
Number Of Risk By Occupation ...50
Table 4.2
Number Of Risk By Occupation
Tabel 4.3
Number Of Risk By Class Construction ...52
Table 4.3
Number Of Risk By Class Construction
Tabel 4.4
Number Of Risk By Province ...54
Table 4.4
Number Of Risk By Province
Tabel 5.1
Claim Frequency By Cresta Zone ...55
Table 5.1
Claim Frequency By Cresta Zone
Tabel 5.2
Claim Frequency By Occupation ...56
Table 5.2
Claim Frequency By Occupation
Tabel 5.3
Claim Frequency By Province ...59
Table 5.3
Claim Frequency By Province
Tabel 5.4
Claim By Cresta Zone ...60
Table 5.4
Claim By Cresta Zone
Tabel 5.5
Claim By Occupation ...62
Table 5.5
Claim By Occupation
Tabel 5.6
Claim By Province ...64
Table 5.6
Claim By Province
Daftar Isi
Contents
Risk & Loss:
Risk & Loss:
Underwriting Year 2012 - 2016, Seluruh Okupasi ...66
Underwriting Year 2012 - 2016, Seluruh Okupasi
Underwriting Year 2016, Seluruh Okupasi ...67
Underwriting Year 2016, All Occupation
Underwriting Year 2015, Seluruh Okupasi ...68
Underwriting Year 2015, All Occupation
Underwriting Year 2014, Seluruh Okupasi ...69
Underwriting Year 2014, All Occupation
Underwriting Year 2013, Seluruh Okupasi ...70
Underwriting Year 2013, All Occupation
Underwriting Year 2012, Seluruh Okupasi ...71
Underwriting Year 2012, All Occupation
Underwriting Year 2016, Okupasi Agrikultural ...72
Underwriting Year 2016, Occupation Agricultural
Underwriting Year 2016, Okupasi Komersial ...73
Underwriting Year 2016, Occupation Commercial
Underwriting Year 2016, Okupasi Industrial ...74
Underwriting Year 2016, Occupation Industrial
Underwriting Year 2016, Okupasi Residensial ...75
Underwriting Year 2016, Occupation Residential
Underwriting Year 2015, Okupasi Agrikultural ...76
Underwriting Year 2015, Occupation Agricultural
Underwriting Year 2015, Okupasi Komersial ...77
Underwriting Year 2015, Occupation Commercial
Underwriting Year 2015, Okupasi Industrial ...78
Underwriting Year 2015, Occupation Industrial
Underwriting Year 2015, Okupasi Residensial ...79
Underwriting Year 2015, Occupation Residential
Underwriting Year 2014, Okupasi Agrikultural ...80
Underwriting Year 2014, Occupation Agricultural
Underwriting Year 2014, Okupasi Komersial ...81
Underwriting Year 2014, Occupation Commercial
Underwriting Year 2014, Okupasi Industrial ...82
Underwriting Year 2014, Occupation Industrial
Underwriting Year 2014, Okupasi Residensial ...83
Underwriting Year 2014, Occupation Residential
Underwriting Year 2013, Okupasi Agrikultural ...84
Underwriting Year 2013, Occupation Agricultural
Underwriting Year 2013, Okupasi Komersial ...85
Underwriting Year 2013, Occupation Commercial
Underwriting Year 2013, Okupasi Industrial ...86
Underwriting Year 2013, Occupation Industrial
Underwriting Year 2013, Okupasi Residensial ...87
Underwriting Year 2013, Occupation Residential
Underwriting Year 2012, Okupasi Agrikultural ...88
Underwriting Year 2012, Occupation Agricultural
Underwriting Year 2012, Okupasi Komersial ...89
Underwriting Year 2012, Occupation Commercial
Underwriting Year 2012, Okupasi Industrial ...90
Underwriting Year 2012, Occupation Industrial
Underwriting Year 2012, Okupasi Residensial ...91
Underwriting Year 2012, Occupation Residential
Daftar Isi
Contents
Exposure, Premi Bruto, Jumlah Risiko & Klaim
per Cresta Zone, Underwriting Year 2016 ...92
Exposure, Gross Premium, Number of Risk & Claim
by Cresta Zone, Underwriting Year 2016
Exposure, Premi Bruto, Jumlah Risiko & Klaim
per Cresta Zone, Underwriting Year 2015 ...93
Exposure, Gross Premium, Number of Risk & Claim
by Cresta Zone, Underwriting Year 2015
Exposure, Premi Bruto, Jumlah Risiko & Klaim
per Cresta Zone, Underwriting Year 2014 ...94
Exposure, Gross Premium, Number of Risk & Claim
by Cresta Zone, Underwriting Year 2014
Exposure, Premi Bruto, Jumlah Risiko & Klaim
per Cresta Zone, Underwriting Year 2013 ...95
Exposure, Gross Premium, Number of Risk & Claim
by Cresta Zone, Underwriting Year 2013
Exposure, Premi Bruto, Jumlah Risiko & Klaim
per Cresta Zone, Underwriting Year 2012 ...96
Exposure, Gross Premium, Number of Risk & Claim
by Cresta Zone, Underwriting Year 2012
Exposure, Premi Bruto, Jumlah Risiko & Klaim
per Okupasi, Underwriting Year 2016 ...97
Exposure, Gross Premium, Number of Risk & Claim
by Occupation, Underwriting Year 2016
Exposure, Premi Bruto, Jumlah Risiko & Klaim
per Okupasi, Underwriting Year 2015
………
98
Exposure, Gross Premium, Number of Risk & Claim
by Occupation, Underwriting Year 2015
Exposure, Premi Bruto, Jumlah Risiko & Klaim
per Okupasi, Underwriting Year 2014 ...99
Exposure, Gross Premium, Number of Risk & Claim
by Occupation, Underwriting Year 2014
Exposure, Premi Bruto, Jumlah Risiko & Klaim
per Okupasi, Underwriting Year 2013 ...100
Exposure, Gross Premium, Number of Risk & Claim
by Occupation, Underwriting Year 2013
Exposure, Premi Bruto, Jumlah Risiko & Klaim
per Okupasi, Underwriting Year 2012 ... ...101
Exposure, Gross Premium, Number of Risk & Claim
by Occupation, Underwriting Year 2012
Exposure, Premi Bruto, Jumlah Risiko & Klaim
per Provinsi, Underwriting Year 2016 ...102
Exposure, Gross Premium, Number of Risk & Claim
Daftar Isi
Contents
Exposure, Premi Bruto, Jumlah Risiko & Klaim
per Provinsi, Underwriting Year 2015 ...103
Exposure, Gross Premium, Number of Risk & Claim
by Province, Underwriting Year 2015
Exposure, Premi Bruto, Jumlah Risiko & Klaim
per Provinsi, Underwriting Year 2014 ...104
Exposure, Gross Premium, Number of Risk & Claim
by Province, Underwriting Year 2014
Exposure, Premi Bruto, Jumlah Risiko & Klaim
per Provinsi, Underwriting Year 2013 ...105
Exposure, Gross Premium, Number of Risk & Claim
by Province, Underwriting Year 2013
Exposure, Premi Bruto, Jumlah Risiko & Klaim
per Provinsi, Underwriting Year 2012 ...106
Exposure, Gross Premium, Number of Risk & Claim
by Province, Underwriting Year 2012
Lampiran:
Annexes:
Daftar Istilah Statistik ...108
Statistical Glossary
Tarif dan Zona Asuransi Gempa Bumi Indonesia ...110
Indonesia
Earthquake
Insurance Tariff and Zone
Daftar Cresta Zone Untuk Indonesia ...124
Cresta Zone List For Indonesia
Skala untuk First Loss, Rate Polis Jangka Pendek, Periode Indemnity ...131
Scale for Fisrt Loss, Short Period Policy Rate, Indemnity Period
Kode Okupasi ...134
Occupation Code
Gambaran Ekonomi
–
Industri Asuransi 2016
Economic
–
Insurance Industry Outlook 2016
8,564.9
8,982.5
9,433.0
Year 2014
Year 2015
Year 2016
4.88%
5.02%
IDR 9.433 Trillion
IDR 378,2 Trillion
IDR 9.433 triliun adalah total Produk Domestik Bruto (PDB) Indonesia pada tahun 2016. Tiga sektor
usaha dengan kontribusi paling besar adalah: (i) Industri Pengolahan
–
21,39%, (ii) Perdagangan Besar
Eceran; Reparasi Mobil dan Sepeda Motor
–
13,31% dan (iii) Pertanian, Kehutanan dan Perikanan
–
12,82%.
IDR 9.433 Trillion is
Indonesia’s
GDP for 2016. Three sectors with highest contribution are: (i)
Processing Industry
–
21.4%, (ii) grocery, retail and automotive trading
–
13.3% and (iii) Farming,
Forestry and Fisheries
–
12.82%.
IDR 378,2 trilyun adalah besaran PDB dalam kelompok usaha Jasa Keuangan dan Asuransi. Sektor ini
berkontribusi 4% dari total PDB Indonesia pada tahun 2016, masih berada di bawah sektor Konstruksi;
Pertambangan dan Penggalian; Informasi dan Komunikasi.
IDR 378,2 Trillion is the GDP from Financial Services and Insurance sector. This sector contributes 4%
of Indonesia's total GDP by 2016, below Construction sector; Mining and excavation; Information and
Communication.
Keadaan Ekonomi 2016.
Economic Outlook 2016
Indonesia mengalami pertumbuhan ekonomi sebesar 5.02% pada tahun 2016. Namun demikian laju
pertumbuhan pada sektor Jasa Keuangan dan Asuransi mencapai 8.9%, tertinggi dibandingkan sektor
lainnya. Laju pertumbuhan 8.9% ini juga menjadi laju pertumbuhan tertinggi bila dibandingkan dengan
tahun sebelumnya yaitu 4.7% pada tahun 2014 dan 8.6% pada tahun 2015.
Indonesia’s
economic growth in 2016 reached 5.02%. However, growth rates in the Financial Services
and Insurance sector was 8.9%, the highest compared to other sectors. The 8.9% growth rate is also
the highest growth rate compared to 4.7% in 2014 and 8.6% in 2015.
In trillion IDR
Reasuransi MAIPARK | 2
69.01%
9.55%
21.44%
Produksi premi Asuransi Jiwa lebih tinggi dibandingkan dengan Asuransi Umum/kerugian. Dari Total
produksi premi 2016 sebesar 199 Triliun rupiah, Asuransi Jiwa berkontribusi sebesar 69,01%.
Sedangkan Asuransi Umum/Kerugian hanya 30,99%. Dari total Asuransi Umum tersebut ada 30%
merupakan produksi premi Asuransi Umum/Kerugian dari Lini Bisnis Harta Benda.
Life Insurance premium production is higher than General Insurance/Non Life. Life Insurance
contributed 69.01% of 199 Trillion rupiah, the total premium production in 2016. While General
Insurance / Non Life is only 30.99%. The premium production of General Insurance / Non Life from the
Business Line of Property is 30% of the total Premium of General Insurance.
6
Perusahaan
Reasuransi
Reinsurance
77
Perusahaan
Asuransi Umum
General Insurance
55
Perusahaan
Asuransi Jiwa
Life Insurance
5
Asuransi
Wajib dan Sosial
Mandatory and
Social Insurance
Keadaan Asuransi 2016.
Insurance Outlook 2016
AJ
AU-O
AU-P
Uraian/Description
Premi /Premium
Asuransi Jiwa/
Life Insurance (AJ)
137,785,583
Asuransi Umum - Harta Benda/
General Insurance - Property (AU-P)
19,072,900
Asuransui Umum - Lainnya/
General Insurance - Others (AU-O)
42,797,300
In million IDR
3 |Reasuransi MAIPARK
Source: Otoritas Jasa Keuangan, 2017
Asosiasi Asuransi Umum Indonesia, 2017
Grafik ini menampilkan pertumbuhan premi dari underwiring year (UY) 2004-2016. UY 2016 masih
belum matang per 31 Januari 2017, dan diperkirakan masih bertambah sampai dengan akhir tahun
2017 nanti. Bila melihat dari pola UY sebelumnya, maka penambahan premi untuk UY 2016 sendiri
dapat mencapai kira-kira 19% atau sekitar Rp4,3 Triliun.
Dengan proyeksi UY 2016 menjadi Rp4,3 Triliun, maka dapat kita lihat terjadi penurunan produksi
premi dari UY 2015 ke UY 2016 untuk asuransi gempa bumi sebesar 19%. Hal ini berbanding
terbalik dengan pertumbuhan Jasa Keuangan dan Asuransi secara umum di Indonesia yang tumbuh
sebesar 8,9%.
This graph shows premium growth from underwriting year 2004-2016. UY 2016 is still developing
as obtained per January 31, 2017, and still increasing until the end of 2017. Looking at the previous
UY pattern, the additional premium for UY 2016 can reach approximately 19% or about Rp4.3
Trillion.
The projection of UY 2016 to 4.3 Trillion, we can see a decrease in premium production for
earthquake insurance from UY 2015 to UY 2016 by 19%. This is inversely related to the growth of
Financial Services and Insurance in general in Indonesia which grew by 8.9%.
Catatan Asuransi Gempa Bumi 2004 - 2016.
Earthquake Insurance 2004
–
2016.
3.1
3.2
3.3
Premi di UY 2016 terdistribusi 56,7% di Cresta 3
yang mencakup 3 Area yaitu 3.1- Provinsi DKI
Jakarta, 3.2-Kota Bandung dan 3.3-Kota/Kabupaten
Lain selain Jakarta dan Bandung di Provinsi Banten
dan Jawa Barat.
Premiums in UY 2016 were distributed 56.7% in
Cresta 3 that covering 3 Area ie 3.1- Province of
DKI Jakarta, 3.2-City of Bandung and 3.3-City/
Regency Other than Jakarta and Bandung in Banten
and West Java Province.
Cresta 3
56,7%
871
1,334
1,645
2,076
1,982
1,782
2,116
2,823
2,721
4,530
4,959
5,305
3,659
1,000
2,000
3,000
4,000
5,000
6,000
2004
2005
2006
2007
2008
2009
2010
2011
2012
2013
2014
2015
2016
In
Bi
llion
s
IDR
Reasuransi MAIPARK | 4
Catatan Asuransi Gempa Bumi 2004 - 2016.
Earthquake Insurance 2004
–
2016.
Grafik ini menampilkan pertumbuhan eksposur dari underwiring year 2004-2016. Untuk UY 2016
dimana angka eksposur didapatkan per 31 Januari 2017 kami perkirakan masih dapat bertambah
sampai dengan akhir tahun 2017 nanti. Bila melihat dari pola UY sebelumnya, maka penambahan
eksposur untuk UY 2016 sendiri dapat mencapai kira-kira 20% atau sekitar Rp3,4 Kuadriliun.
Dengan proyeksi UY 2016 menjadi 3,4 Quadtriliun maka dapat kita lihat terjadi penurunan eksposur
dari UY 2015 ke UY 2016 untuk asuransi gempa bumi sebesar 5,6%.
This graph shows exposure growth from underwiring year 2004-2016. Exposure of UY 2016 is
obtained as of January 31, 2017, we estimate it can still increase until the end of 2017. When
looking at the previous UY pattern, the additional exposure for UY 2016 can reach approximately
20% or about Rp3.4 QuadTrillion.
The projection of UY 2016 to Rp3.4 QuadTrillion, we can see a decrease in exposure production for
earthquake insurance from UY 2015 to UY 2016 by 5.6%.
Cresta 3
53,2%
3.1
3.2
3.3
Eksposur di UY 2016 terdistribusi 53,2% di Cresta
3 yang mencakup 3 Area yaitu 3.1- Provinsi DKI
Jakarta, 3.2-Kota Bandung dan 3.3-Kota/Kabupaten
Lain selain Jakarta dab Bandung di Provinsi Banten
dan Jawa Barat.
Exposure in UY 2016 are distributed 53.2% in
Cresta 3 that covering 3 Area ie 3.1- Province of
DKI Jakarta, 3.2-City of Bandung and 3.3-City/
Regency Other than Jakarta and Bandung in Banten
and West Java Province.
692
1,026
1,458
1,606
1,481
1,498
1,671
2,156
1,974
2,759
3,115
3,642
2,884
500
1,000
1,500
2,000
2,500
3,000
3,500
4,000
2004
2005
2006
2007
2008
2009
2010
2011
2012
2013
2014
2015
2016
In
Tri
llion
s
IDR
5 |Reasuransi MAIPARK
Dilihat dari sisi intensitas gempa yang digambarkan oleh intensitas maksimum, Gempa Aceh 2004,
Gempa Yogyakarta 2006 dan Gempa Padang 2009 adalah tiga gempa terbesar yang terjadi dari
tahun 2004.
Loss ratio
tertinggi terjadi pada event Gempa Aceh 2004 dan Gempa Padang 2009
masing-masing sebesar 77,85% dan 78,38% sementara itu Gempa Yogyakarta 2006 hanya memiliki
loss ratio
1.25%.
Fakta ini salah satunya disebabkan mekanisme gempa dimana pada gempa subduksi
(Aceh dan
Padang) intensitas tinggi dapat terjadi pada area yang sangat luas sehingga
loss ratio
sangat tinggi,
sedangkan gempa patahan (Yogyakarta) intensitas tinggi hanya berdampak pada area yang relative
lebih kecil, sehingga
loss ratio
tidak terlalu besar.
From the earthquake intensity point of view, three biggest earthquake are Aceh EQ 2004, Yogya EQ
2006 and Padang EQ 2009. the highest loss ratio experienced in Aceh and Padang events each
77,85% dan 78,38% while Yogya EQ only resulted a minor loss ratio of 1.25%.
One of the probable cause is the mechanism of earthquake where the subduction type of EQ (Aceh
and Padang) affected larger high intensity areas than the fault EQ (Yogya), which this was affected
the loss ratio of these particular events.
Catatan Asuransi Gempa Bumi 2004 - 2016.
Earthquake Insurance 2004
–
2016.
No.
Kejadian
Tanggal
Kejadian
Kekuatan
Gempa
Kedalaman
(KM)
MMI
Maksimum
Eksposure
Terdampak
Klaim
Rasio Kerugian
Number
Event
Date of Loss
Magnitude
Depth (KM)
Maximum MMI Affected Exposure
Claim
Loss Ratio
1
ACEH
26/12/04
9.1 Mw
30.00
IX
958,757.93 746,364.47
77.85%
2
YOGYA
27/05/06
6.3 Mw
12.50
IX
22,607,377.57 283,523.14
1.25%
3
PADANG
06/03/07
6.3 Mwc
11.00
VIII
5,975,640.89 28,753.80
0.48%
4
BENGKULU
12/09/07
8.4 Mw
34.00
VIII
870,834.57 61,180.16
7.03%
5
PADANG
16/08/09
6.7 Mwc
20.00
VI
3,105,777.10 42,782.94
1.38%
6
TASIKMALAYA
02/09/09
7.0 Mw
46.00
VII
37,059,693.77 33,508.29
0.09%
7
PADANG
30/09/09
7.6 Mw
81.00
IX
1,434,892.35 1,124,652.86
78.38%
8
BIMA
09/11/09
6.6 Mwc
18.00
VI
10,261,909.77 47,771.65
0.47%
9
MERAPI
25/10/10
6,912,282.28 30,534.72
0.44%
10
KELUD
13/02/14
51,122,470.86 270,749.97
0.53%
volcanic eruption
volcanic eruption
Reasuransi MAIPARK | 6
In million IDR
Asuransi Gempa Bumi 2012 - 2016
Earthquake Insurance 2012-2016
Tabel di atas adalah data produksi premi selama 5 tahun terakhir. Pada Okupasi Agrikultur, kenaikan
paling tinggi terjadi antara UY 2011-2012 yaitu sebesar 23,1%. Pada Okupasi Komersial dan
Residential, kenaikan paling tinggi terjadi antara UY 2012-2013 yaitu masing-masing sebesar
175,3% dan 36,6%. Pada Okupasi Industrial kenaikan paling tinggi terjadi antara UY 2013-2014
yaitu sebesar 44,7%.
Bila angka UY 2016 dibandingkan dengan UY 2012 maka kenaikan produksi premi tertinggi terjadi
pada Okupasi Komersial yaitu sebesar 52,2%. Sementara itu, premi dari okupasi agrikultur
mengalami penurunan sebesar 7.8%.
The table above is the premium production for the last 5 years. In the Agricultural Occupation, the
highest increase occurred between UY 2011-2012 that is equal to 23,1%. In the Commercial and
Residential Occupation, the highest increase occurred between UY 2012-2013, i.e 175.3% and
36.6%, respectively. In Industrial Occupation, the highest increase occurred between UY 2013-2014
which is equal to 44,7%.
If the figure of UY 2016 compared to UY 2012, the highest increase of premium production occurred
in Commercial Occupation that is equal to 52,2%. Meanwhile, the premium amount from agricultural
occupation decreased 7.8%.
Premi Asuransi Gempa Bumi 2016
Earthquake Insurance Premium 2016
UY
Agrikultural
∆
Komersial
∆
Industrial
∆
Residensial
∆
Total
∆
2012
29.42
23.1%
658.34
-13.2%
1,686.07
-0.8%
347.54
1.5%
2,721.36
-3.6%
2013
35.25
19.8%
1,812.23
175.3%
2,208.13
31.0%
474.72
36.6%
4,530.33
66.5%
2014
28.85
-18.2%
1,119.71
-38.2%
3,195.59
44.7%
614.99
29.5%
4,959.13
9.5%
2015
29.55
2.5%
1,802.33
61.0%
2,897.32
-9.3%
575.52
-6.4%
5,304.72
7.0%
2016
27.34
-7.5%
1,001.97
-44.4%
2,155.41
-25.6%
474.48
-17.6%
3,659.21
-31.0%
2012 to 2016
-7.1%
52.2%
27.8%
36.5%
34.5%
Reasuransi MAIPARK | 8
In billion IDR
Tabel di atas adalah data produksi premi selama 5 tahun terakhir. Pada Interest Building, Others dan
Business Interuption, kenaikan paling tinggi terjadi antara UY 2012-2013 yaitu masing-masing
sebesar 47,1%, 74,5% dan 274,7%. Pada Interest Machinery, kenaikan paling tinggi terjadi antara
UY 2013-2014 yaitu sebesar 35,4%. Pada Interest Stock, kenaikan paling tinggi terjadi antara UY
2013-2014 yaitu sebesar 73,8%.
Bila angka UY 2016 dibandingkan dengan UY 2012 maka pertumbuhan tertinggi produksi premi
terjadi pada Interest Building yaitu sebesar 41,1%. Sementara pertumbbuhan terendah terjadi pada
interest Stock sebesar 17.4%.
The table above is the premium production data for the last 5 years. In the Building, Others and
Business Interuption Interest, the highest increase occurred between UY 2012-2013, i.e 47.1%,
74.5% and 274.7% respectively. In the Machinery Interest, the highest increase occurred between
UY 2013-2014 which is 35.4%. In the Stock Interest, the highest increase occurred between UY
2013-2014 which is equal to 73.8%.
If the figure of UY 2016 compared to UY 2012, the highest growth in premium production occurs in
the Interest Building that is equal to 41.1%, which the lowest growth is come from Stocks 17.4%.
Premi Asuransi Gempa Bumi 2016
Earthquake Insurance Premium 2016
UY
Building
∆
Machinery
∆
Others
∆
Stock
∆
Interruption
Bussiness
∆
Total
∆
2012
1,109.99
-14.3%
540.32
-3.6%
452.83
39.4%
377.17
2.7%
241.06
-12.5%
2,721.36
-3.6%
2013
1,632.36
47.1%
694.83
28.6%
790.30
74.5%
509.68
35.1%
903.15
274.7%
4,530.33
66.5%
2014
2,036.80
24.8%
940.76
35.4%
619.12
-21.7%
885.58
73.8%
476.87
-47.2%
4,959.13
9.5%
2015
2,754.09
35.2%
920.39
-2.2%
637.03
2.9%
576.81
-34.9%
416.38
-12.7%
5,304.72
7.0%
2016
1,565.76
-43.1%
708.82
-23.0%
620.01
-2.7%
442.68
-23.3%
321.93
-22.7%
3,659.21
-31.0%
2012 to 2016
41.1%
31.2%
36.9%
17.4%
33.5%
34.5%
9 |Reasuransi MAIPARK
In billion IDR
Kode Ukupasi dan Keterangan
Description & Occupation Code
Jumlah Risiko
Number of Risk
Premium
Premi
Exposure
Exposure
Private Building
297
76.292
507.543.348.366,93 356.534.521.091.664,00
Trading and storage
293
60.265
454.438.237.985,54 352.215.048.368.483,00
Hotels, Entertainment, Sport,
Services
294
8.779
258.685.294.963,58 189.853.581.229.423,00
Conventional power station . .
281
242
254.200.632.649,54 184.559.210.302.184,00
Mass communication
292
9.639
184.847.249.329,61 122.983.990.617.974,00
Edible fats, edible oil and desiccated
coconut producers
274
638
135.087.154.106,32 116.242.728.581.394,00
Tobacco, cigars and cigarettes
manufacture
279
404
134.531.401.654,95 133.199.023.516.826,00
Mining (underground or above
ground) of precious metal . . .
200
26
126.611.096.193,12
88.838.188.575.950,00
Cement, Chalk, Lime and Gypsum
Industry
211
213
122.352.807.348,26 105.505.506.691.319,00
Industrial, Mining and Commercial
Machinery . . .
221
963
107.635.376.746,15 100.860.184.394.393,00
Premi Asuransi Gempa Bumi 2016
Earthquake Insurance Premium 2016
Reasuransi MAIPARK | 10
In IDR
Tabel di atas adalah data eksposur selama 5 tahun terakhir. Pada Okupasi Agrikultur, kenaikan
paling tinggi terjadi antara UY 2011-2012 yaitu sebesar 16,7%. Pada Okupasi Komersial dan
Residential, kenaikan paling tinggi terjadi antara UY 2012-2013 yaitu masing-masing sebesar
117,5% dan 37,5%. Pada Okupasi Industrial, kenaikan paling tinggi terjadi antara UY 2013-2014
yaitu sebesar 38,4%.
Bila angka UY 2016 dibandingkan dengan UY 2012 maka kenaikan eksposur tertinggi terjadi pada
Okupasi Komersial yaitu sebesar 60,1%.
The table above is the exposure for the last 5 years. In the Agricultural Occupation, the highest
increase occurred between UY 2011-2012 that is equal to 16,7%. In the Commercial and Residential
Occupation, the highest increase occurred between UY 2012-2013, i.e 117.5% and 37.5%
respectively. In the Industrial Occupation, the highest increase occurred between UY 2013-2014 i.e
38,4%.
If the number of UY 2016 compared to UY 2012, the highest increase in exposure occurred at
Commercial Occupation that is equal to 60,1%.
Eksposur Asuransi Gempa Bumi 2016
Earthquake Insurance Exposure2016
11 |Reasuransi MAIPARK
In Trillion IDR
UY
Agri
∆
Commercial
∆
Industrial
∆
Residensial
∆
Total
∆
2012
23.54
-99.9%
458.52
-99.9%
1,261.13
-99.9%
231.08
-99.9%
1,974.28
-99.9%
2013
25.96
10.3%
997.42
117.5%
1,417.71
12.4%
317.64
37.5%
2,758.72
39.7%
2014
22.35
-13.9%
746.06
-25.2%
1,961.85
38.4%
385.09
21.2%
3,115.35
12.9%
2015
24.20
8.3%
1,163.69
56.0%
2,068.54
5.4%
385.82
0.2%
3,642.25
16.9%
2016
21.73
-10.2%
734.06
-36.9%
1,797.00
-13.1%
331.69
-14.0%
2,884.48
-20.8%
2012 to 2016
-7.7%
60.1%
42.5%
43.5%
46.1%
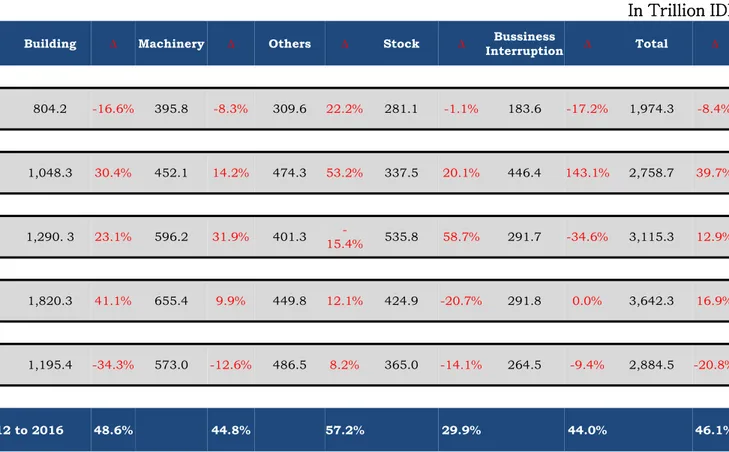
Tabel di atas adalah data eksposure selama 5 tahun terakhir. Pada Interest Others dan Business
Interuption kenaikan paling tinggi terjadi antara UY 2012-2013 yaitu sebesar 53,2% dan 143,1%.
Pada
Interest Machinery dan Stock kenaikan paling tinggi terjadi antara UY 2013-2014 yaitu
sebesar 31,9% dan 58,7%. Pada Interest Building kenaikan paling tinggi terjadi antara UY
2014-2015 yaitu sebesar 41,1%.
Bila angka UY 2016 dibandingkan dengan UY 2012 maka kenaikan eksposure terjadi pada Interest
Building yaitu sebesar 57,2%.
The table above is the exposure for the last 5 years. In The Others and Business Interuption
Interest, the highest increase occurred between UY 2012-2013, i.e 53.2% and 143.1%. In The
Machinery and Stock Interest, the highest increase occurred between UY 2013-2014 i.e 31.9% and
58.7%. In the Building Interest, the highest increase occurred between UY 2014-2015 i.e 41.1%.
If the number of UY 2016 compared to UY 2012, the exposure increase occurs in the Building
Interest i.e 57.2%.
Eksposur Asuransi Gempa Bumi 2016
Earthquake Insurance Exposure2016
UY
Building
∆
Machinery
∆
Others
∆
Stock
∆
Bussiness
Interruption
∆
Total
∆
2012
804.2
-16.6%
395.8
-8.3%
309.6
22.2%
281.1
-1.1%
183.6
-17.2%
1,974.3
-8.4%
2013
1,048.3
30.4%
452.1
14.2%
474.3
53.2%
337.5
20.1%
446.4
143.1%
2,758.7
39.7%
2014
1,290. 3
23.1%
596.2
31.9%
401.3
-15.4%
535.8
58.7%
291.7
-34.6%
3,115.3
12.9%
2015
1,820.3
41.1%
655.4
9.9%
449.8
12.1%
424.9
-20.7%
291.8
0.0%
3,642.3
16.9%
2016
1,195.4
-34.3%
573.0
-12.6%
486.5
8.2%
365.0
-14.1%
264.5
-9.4%
2,884.5
-20.8%
2012 to 2016
48.6%
44.8%
57.2%
29.9%
44.0%
46.1%
Reasuransi MAIPARK |12
In Trillion IDR
Eksposur Asuransi Gempa Bumi 2016
Earthquake Insurance Exposure 2016
13 |Reasuransi MAIPARK
Kode Okupasi dan Keterangan
Description & Occupation Code
Jumlah Risiko
Number of Risk
Premium
Premi
Eksposure
Exposure
Private Building
297
76,292
507,543,348,367
356,534,521,091,664
Trading and storage
293
60,265
454,438,237,986
352,215,048,368,483
Hotels, Entertainment, Sport,
Services
294
8,779
258,685,294,964
189,853,581,229,423
Conventional power station,
buildings with boiler houses . . .
281
242
254,200,632,650
184,559,210,302,184
Tobacco, cigars and cigarettes
manufacture
279
404
134,531,401,655
133,199,023,516,826
Mass communication
292
9,639
184,847,249,330
122,983,990,617,974
Edible fats, edible oil and
desiccated coconut producers
274
638
135,087,154,106
116,242,728,581,394
Cement, Chalk, Lime and Gypsum
Industry
211
213
122,352,807,348
105,505,506,691,319
Industrial, Mining and Commercial
Machinery, . . .
221
963
107,635,376,746
100,860,184,394,393
Petrochemical works
232
133
99,884,265,243
89,767,796,081,455
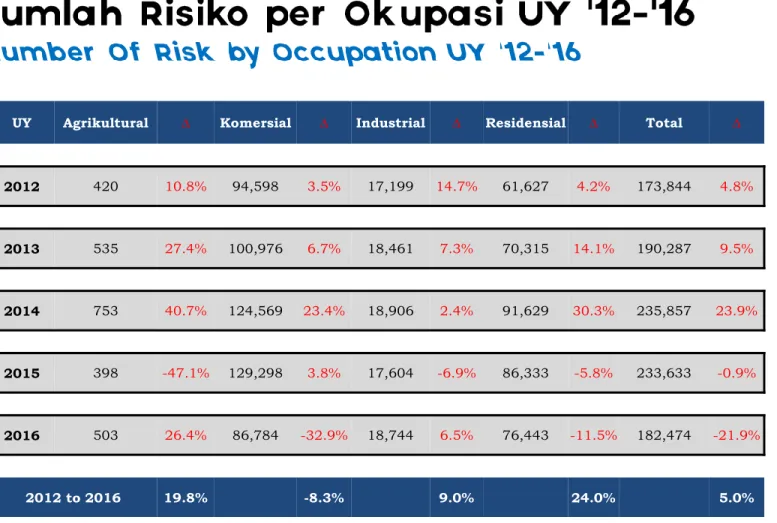
Tabel di atas adalah data Jumlah Risiko selama 5 tahun terakhir. Pada Okupasi Agrikultur,
penurunan paling rendah terjadi antara UY 2014-2015 yaitu sebesar 47,1%. Pada Okupasi Komersial
penurunan paling rendah terjadi antara UY 2015-2016 yaitu sebesar 32,9%. Pada Okupasi Industrial
kenaikan paling tinggi terjadi antara UY 2011-2012 yaitu sebesar 14,7%. Pada Okupasi Residensial
kenaikan paling tinggi terjadi antara UY 2013-2014 yaitu sebesar 30,3%.
Bila angka UY 2016 dibandingkan dengan UY 2012 maka kenaikan Jumlah Risiko tertinggi terjadi
pada Okupasi Residensial yaitu sebesar 24,0%.
The table above is the Number of Risk for the last 5 years. In The Agricultural Occupation, the
lowest decrease occurred between UY 2014-2015 i.e 47,1%. In The Comercial Occupation, the
lowest decrease occurred between UY 2015-2016 i.e 32,9%. In the Industrial Occupation, the
highest increase occurred between UY 2011-2012 i.e 14,7%. In Residential Occupational, the
highest increase occurred between UY 2013-2014 i.e 30.3%.
If the number of UY 2016 compared to UY 2012, the highest increase of Number of Risk occurs in
Residential Occupation i.e 24.0%.
Jumlah Risiko Asuransi Gempa Bumi 2016
Earthquake Insurance Number of Risk 2016
UY
Agrikultural
∆
Komersial
∆
Industrial
∆
Residensial
∆
Total
∆
2012
420
10.8%
94,598
3.5%
17,199
14.7%
61,627
4.2%
173,844
4.8%
2013
535
27.4%
100,976
6.7%
18,461
7.3%
70,315
14.1%
190,287
9.5%
2014
753
40.7%
124,569
23.4%
18,906
2.4%
91,629
30.3%
235,857
23.9%
2015
398
-47.1%
129,298
3.8%
17,604
-6.9%
86,333
-5.8%
233,633
-0.9%
2016
503
26.4%
86,784
-32.9%
18,744
6.5%
76,443
-11.5%
182,474
-21.9%
2012 to 2016
19.8%
-8.3%
9.0%
24.0%
5.0%
Reasuransi MAIPARK | 14
Tabel di atas menampilkan kejadian Gempabumi yang terjadi selama 2016. Data MMI, Kedalaman
dan Magnitude merujuk kepada data USGS. Meskipun Gempa Air Bangis berkekuatan relative
besar yaitu 7,8Mw namun hanya dirasakan pada intensitas III sehingga mengakibatkan kerugian
relative kecil. Hal ini berbeda dengan Gempa Solok dan Pidie Jaya, dengan kekuatan 6,6 Mw dan
6,5 Mw dirasakan hingga MMI VII dan IX mengakibatkan kerugian yang besar.
Pada table tersebut disajikan informasi Exposure Terdampak yang diperoleh dari data exposure
on-risk
atas risiko yang terdampak pada saat kejadian gempa. Sedangkan Loss Ratio disini
dimaksudkan sebagai perbandingan antara Jumlah Klaim terhadap Exposure Terdampak. Loss
Ratio terbesar adalah event Solok sebesar 3,68%.
The table above shows the earthquake events that occurred during 2016. MMI, Depth and
Magnitude refer to USGS data. Although the Air Bangis earthquake is relatively large i.e 7.8Mw
and felt to MMI III, it has resulted in relatively small losses. This is different from the Solok and
Pidie Jaya Earthquakes, which has magnitude of 6.6 Mw and 6.5 Mw is felt until MMI VII and IX
resulted in substantial losses.
The table is presented information Affected Exposure from data exposure onrisk for the risks that
were affected at the time of the earthquake. Loss Ratio here is intended as a comparison between
the Claim Amounts to Affected Exposure. Loss Ratio for event Solok is the largest i.e 3.68%.
Claim Events
Asuransi Gempa Bumi 2016
Earthquake Insurance Claim Events 2016
Event
Date of Loss
Magnitude
Depth (km)
Max Intensity
(MMI)
Affected Exposure
Claim
Loss Ratio
Halmahera
24/02/16
5.4 Mb
13.70
I
18,548.39
-
0.000000%
Air Bangis
02/03/16
7.8 Mw
24.00
III
2,521,420.33
10.00 0.000397%
Mentawai
05/03/16
5.4 Mw
10.00
I
5,051,567.91
10.00 0.000198%
Garut
06/04/16
6.1 Mw
29.00
IV
166,952.86
59.91 0.035884%
Bengkulu
10/04/16
5.7 Mw
41.00
V
1,071,880.14
-
0.000000%
Solok
02/06/16
6.6 Mw
50.00
VII
573,578.45 21,102.04 3.679015%
Bengkulu
12/09/16
8.4 Mw
34.00
VIII
1,775,903.72
-
0.000000%
Padang
21/09/16
4.1 Mw
162.50
I
19,320,111.46
25.00 0.000129%
Irian Jaya
17/10/16
4.7 Mw
33.40
I
2,526,522.97
-
0.000000%
Manado
27/10/16
5.8 Mw
61.00
IV
2,752,815.31
5.55 0.000202%
Malang
16/11/16
5.7 Mw
85.00
IV
6,009,281.11
-
0.000000%
Pidie Jaya
07/12/16
6.5 Mw
8.20
IX
771,388.24
2,350.00 0.304646%
In million IDR
15 |Reasuransi MAIPARK
Gambar 5. Peta Intensitas dan ShakeMap Gempa Solok.
Gambar 6. Peta Intensitas dan ShakeMap Gempa Pidie Jaya.
Peta di atas menggambarkan penyebaran intensitas MMI merujuk kepada data USGS.
Berdasarkan peta tersebut dapat diperoleh informasi wilayah-wilayah yang memiliki MMI
I-X+. Gempa Solok yang terjadi pada tanggal 2 Juni 2016 menimbulkan MMI maksimal VII yang
berdampak di wilayah Kota Sungai Penuh. Sedangkan Gempa Pidie Jaya yang terjadi pada 7
Desember 2016 menimbulkan MMI hingga IX yang berdampak pada wilayah Kabupaten Pidie
Jaya.
The map above illustrates the spread of MMI intensity referring to USGS data. Based on the
map it can be obtained information areas that have MMI I-X+. Solok earthquake that occurred
on June 2, 2016 raises the maximum MMI VII that impacts in the area of City of Sungai Penuh.
While the Pidie Jaya Earthquake that occurred on December 7, 2016 cause MMI to IX which
affects the Regency of Pidie Jaya.
Claim Events
Asuransi Gempa Bumi 2016
Earthquake Insurance Claim Events 2016
Reasuransi MAIPARK | 16
Katalog Gempa Bumi 2016
Earthquake Catalog 2016
≥
≥
Daftar Gempa Bumi 2016 Magnitudo
≥ 6.0 Mw
Earthquake List 2016 Magnitude
≥
6.0 Mw
No. Tanggal Kejadian Bujur Lintang USGS BMKG Kota Terdekat
Number Date of Loss Longitude Latitude Magnitude (Mw) Depth (KM) Magnitude
(Mw) Depth (KM) Nearest Population
1 1/11/2016 126.97 BT 3.8 LU 6.50 13 6.4 10 KEP-TALAUD-SULUT 58 KM Tenggara 2 2/12/2016 119.34 BT 9.77 LS 6.30 28 6.6 10 SUMBABARAT-NTT 14 KM Barat Daya 3 3/2/2016 94.39 BT 4.92 LS 7.80 24 7.8 10 KEP-MENTAWAI-SUMBAR 636 KM Barat Daya 4 4/6/2016 107.32 BT 8.3 LS 6.10 29 6.1 10 101 KM Barat Daya GARUT-JABAR 5 5/2/2016 104.37 BT 5.39 LS 5.70 117 6.1 115 TANGGAMUS-LAMPUNG 23 KM Barat Daya 6 6/2/2016 100.46 BT 2.29 LS 6.60 50 6.5 72 79 KM Barat Daya PESISIR SELATAN-SUMBAR 7 6/5/2016 125.74 BT 4.63 LS 6.30 429.6 6.3 445 BURUSELATAN-MALUKU 146 KM Barat Daya 8 6/9/2016 116.24 BT 11.42 LS 6.10 19 6.2 10 SUMBAWA BARAT-NTB 286 KM Barat Daya 9 8/24/2016 122.54 BT 7.46 LS 6.0 533 6.1 537 105 KM Barat Laut FLORES TIMUR-NTT 10 10/9/2016 127.41 BT 1.79 LU 5.8 128 6.2 117 HALMAHERA BARAT-MALUT 52 KM Barat Laut 11 10/19/2016 108 BT 5.29 LS 6.6 614 6.5 654 120 KM Timur Laut SUBANG-JABAR 12 10/27/2016 125.79 BT 1.32 LU 5.8 61 6.1 10 BITUNG-SULUT 75 KM Tenggara 13 11/8/2016 104.59 BT 8.35 LS 5.8 33 6.0 10 271 KM Barat Daya LEBAK-BANTEN 14 11/16/2016 113.12 BT 9.32 LS 5.7 85 6.2 69 KAB MALANG-JATIM 127 KM Tenggara 15 12/5/2016 123.4 BT 7.32 LS 6.3 526 6.4 524 FLORES TIMUR-NTT 120 KM Timur Laut 16 12/7/2016 96.36 BT 5.19 LU 6.5 13 6.4 10 KAB PIDIE JAYA-ACEH 18 KM Timur Laut 17 12/21/2016 128.01 BT 7.75 LS 6.7 152 6.6 173 MALUKU BARAT DAYA 184 KM Timur Laut 18 12/30/2016 118.63 BT 9.37 LS 6.3 79 6.6 91 59 KM Barat Laut SUMBA BARAT DAYA-NTT