Electronic copy available at: https://ssrn.com/abstract=2977231
A Performance Evaluation for Interconnected Construction Sectors of
Turkey: An Analysis Using TOPSIS and MAUT
Gökberk CAN, Ph.D 1
Çiğdem Özarı, Ph.D2
Özge Eren, Ph.D 3
Abstract
In this research, in total 68 construction related companies, which belong to three different interconnected sectors (manufacturing, construction and finance), are ranked according to their business performance by TOPSIS and MAUT method with two different weighting system, equal-weighted and entropy-weighted. The most important and well-known five ratios such as Gross Margin, Operating Margin, Net Margin, Return on Asset and Return on Equity were used to rank the companies from best to worst years between 2005 and 2015. Calculation of
each company’s business performance ranking is a tool to reach main purpose of this research that to measure and rank the annual performance of three interconnected sectors. The empirical results show that there is no significant difference between weight distribution of equal and entropy, but only in TOPSIS method the best year for construction material manufacturing sector changes from equal to entropy-weighted method; respectively 2014 to 2006.
Keywords: Construction industry, Performance Ratios, Entropy, TOPSIS, MAUT.
JEL Code: C44, D81, L25
Introduction
Construction industry is crucial for Turkey’s economy on micro and macro levels. Real
estate investments are greater and more important than financial investments for Turkish citizens. Also, with its backward and forward connections, construction industry pushed forward national economy with consecutive high growth rates. Considering the benefits, the
industry was Justice and Development Party’s (Adalet ve Kalkınma Partisi, AKP) primary key
to create economic developments. Recent reports prepared by different Turkish organizations show that Turkish construction industry slowed down due to the 2008 global crisis but it still
attracts the local and international investors (Özorhon, 2012; Türkiye İnşaat Sanayicileri
İşveren Sendikası, 2016). According to the industrial report for Türkiye İş Bankası, prepared
by Sezgin & Aşarkaya (2015), the industry growing percentage is higher than Gross Domestic
Product’s (GDP) on the other hand any decrease in the GDP gets a higher reaction from the
industry.
1 İstanbul Aydın University, Anadolu BİL Vocational School, Business Management (Eng) Programme, Accounting Lecturer. (Corresponding Author: [email protected], [email protected])
2İstanbul Aydın University, Faculty of Economics and Administrative Sciences, Department of Economics and Finance, Assistant Professor
Electronic copy available at: https://ssrn.com/abstract=2977231
Turkish Contractors Association (TCA, Türkiye Müteahhitler Birliği) regularly prepares
bulletins about the country’s construction sector and in according to the analysis of October
2016, Turkish construction investments (government and private) volatility varies through years. In the last five years, the sector never reached the its peak of 18.3% growth on average, as 19.1% growth in governmental investments and 17.7% in private investments of 2010 (Türkiye Müteahhitler Birliği, 2016). In the first half of 2016, the sector development rate was
6.7% that exceeded the past two years but the coup attempt of July, 15 2016 hit the country’s
economy on a national scale and it caused significant changes on the economic indicators. According to the same report, the 9-month property sales of 2016 is less than 2015’s same period and it is expected that annual property sales of 2016 will not exceed the annual amount of 2015.
This study aims to understand whether the construction related sectors (construction material manufacturing, real estate investment funds and construction) move towards the same direction on the financial and market performance through the years. Although their operations are different than each other, these sectors are connected in a simple way: Construction material manufacturers provide the material that are used in the buildings (residences, business centers and others) which are completed by the constructions companies and then those buildings are invested into by the REIFs. Regarding the relationship of these three sectors, any performance related measure must be in the same direction. Hence, the companies of these sectors are surviving with a mutualism, earnings expectations and realization will be similar for them.
The ranking system, which will be utilized in this research, can also be used for on the company-level to compare the internal and market-wide performance. Top management can
compare the effect of previous decisions over the company’s earnings or a politician can
measure the impact of changed regulations on the country’s GDP through years. In the statistics literature, one can find different methods to rank the units according to the desired criteria with or without weighting them. This research contributes to the literature in different ways. Regarding the aforementioned importance of the construction sector, this research looks for the answer of whether interconnected sectors of construction follow up each other in the means of performance. In addition, the results revealed that using equal-weighted and entropy-weighted analysis made no significant difference on the ranking of the sectors. On the general use of the methods, using time-specific ranking is not popular among the literature as this study demonstrates the effect of time on the interconnected sectors.
Literature Review
Using 1,484 firm-year of construction sample between 1970-2006, Tserng, Liao, Jaselskis, Tsai, and Chen (2012) predicted contractor default by using barrier option model and financial
ratio model created by the authors and supported with Altman’s Z-Score. Their results showed that the barrier option model outperforms the financial ratio models created in this paper and
data. Alcock, Baum, Colley and Steiner (2013) evaluated 169 global private real estate funds’ performance with leverage using financial data between 2001-2011 and they revealed that fund managers effectively track the performance of the target markets, and they found a systematic underperformance which may be caused by costs, fees, and other market frictions.
Dumanoğlu (2010) studied a sample of 15 Turkish cement companies with the period of 2004-2009 and his results show there are three different companies in the league. There are performance-steady companies, which are suitable for risk-avoiding investors, second type of firms is the ones, which’s performances have increased in the ending periods and third are the companies without a consistent performance. Ertuǧrul and Karakaşoǧlu (2009) evaluated
Turkish cement firms’ performance using various financial ratios using Fuzzy Analytic Hierarchy Process (FAHP) and Technique for Order Preference by Similarity to Ideal Solution (TOPSIS) methods with a sample of 15 listed cement firms. Seçme, Bayrakdaroǧlu and Kahraman (2009) used FAHP and TOPSIS methods to test five Turkish banks’ performance using a set of financial ratios and non-financial data. Performance criteria were determined with the research model and using the scope of the model, Turkish banks have been analyzed. Using TOPSIS and VIKOR as the MCDM (Multiple-criteria Decision Making Analysis) methods, Yalçın, Bayrakdaroğlu and Kahraman (2012) investigated the performance of Turkish manufacturing companies with financial data of 2007 for 94 companies of 7 industries. They found that ranking of the companies depending on their performances varies between methods and through sectors.
With a sample of 2003-2008 of 10 banks, 5 insurance and 3 miscellaneous financial companies and Analytic Hierarchy Process (AHP), grey relational analysis (GRA) and LEarning via SAmple (LEvSA) as the MCDM methods, Hamzaçebi and Pekkaya (2011) showed that heuristic scenarios cannot give satisfactory to the investors due to the subjectivity and improper-basis of weight determination operation. Their comparison results also revealed that LEvSA is better than the others MCDM methods. Önüt, Efendigil and Soner Kara (2010) used a combined Fuzzy MCDM approach based on the Fuzzy AHP and Fuzzy TOPSIS
techniques to select a suitable location for a mall to be built in İstanbul. Their result shows that
the proposed method is practical for ranking alternatives with respect to multiple conflicting criteria for the large scale problems. Using Fuzzy AHP and Fuzzy TOPSIS methods, Eyüboğlu & Çelik (2016) provided important insights of financial performances of the listed energy firms by evaluating 13 listed energy firms with 5 main and 15 sub-financial criteria for the period of 2008-2013.
projects of a construction small medium sized enterprises were adopted test the applicability of the system. The priorities and degree of importance of intangible risk criteria and the alternatives are determined and it provides the optimal and impartial decisions for the company. C. M. Tang, Leung, & Lam, (2006) proposed a four main steps model for determining priorities they point out that application of entropy in multi-project cash-flow situations is a more accurate, objective, reliable, and realistic decision and it facilitates the cash-flow management decision problem.
Methodology
To evaluate the business performance of three interconnected sectors, five different type of performance ratios are chosen. In this research, firstly companies’ performance were analyzed depending on their margin and return using financial data from Turkey’s national stock
exchange, Borsa İstanbul (BIST). There are 536 listed companies in BIST, which was
established in 1986 as İstanbul Stock Exchange, and the name was changed in April 4, 2013. The BIST indices varies with the company size, city, industry type, dividend payment and corporate governance score. The reason why three interconnected sectors were chosen is to understand if their direct relationship can be observed through their performance ratios. In other words, three different type of sectors, which are manufacturing (construction material manufacturing, CMM), construction and finance (real estate investment funds, REIF), construct the sample of this research. We did not exclude any companies from the sample and the number of total companies are presented below in Table 1.
Table 1: Distribution of sectors among population
Sector Number of Company
Construction Material Manufacturing 27
REIF 33
Construction 8
Population 68
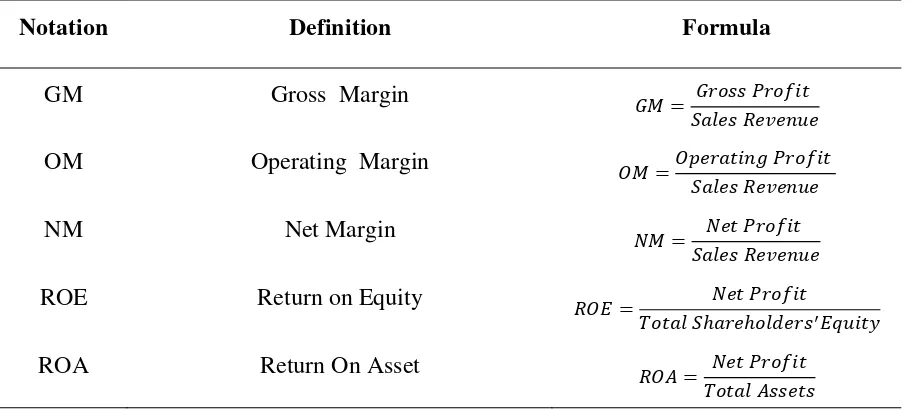
Table 2: Performance ratio notations and formulas
Notation Definition Formula
GM Gross Margin � = �
�
OM Operating Margin = �
�
NM Net Margin =
�
ROE Return on Equity � =
� ℎ� ℎ ′�
ROA Return On Asset � =
� �
Margin and return ratios preferred because they show the amount sales revenue left for the company as the profit. GM shows percentage of the sales left for the company after deducting the costs of the goods sold and/or services rendered to the customers from the sales revenue (Helfert, 2001; Tjia, 2004). OM reveals the percentage of the sales left after deducting the production costs and operating expenses such as administration and marketing but it doesn’t cover the interest expenses of the current period (Jackson & Fogarty, 2006; Mooney, 2008). Comparing to many accounts in the set of financial statements, net profit is one of the most publicly important by itself which affects many ratios. It is the bottom line of the income statement by deducting every kind of expense from, and adding every other income to the sales revenue and NM reveals the percentage of total revenue will remain in the company after all of the expenses, including taxes, deducted (Mooney, 2008; Needles, Powers, & Crosson, 2011). ROA is the ratio that calculates profit per asset. It can be interpreted as a single “currency” asset investment’s share in the profit and measures the profitability with the asset turnover and net profit margin (Fabozzi & Peterson, 2003; Mooney, 2008). ROE shows the rate of return shareholders will have on their investment and measure the productivity of the equity (Fridson & Alvarez, 2002; Stice, Stice, & Diamond, 2005) but one must be reminded that denominator actually stands for the book value of the equity and the ratio ignores the market value of the share price.
of criteria, ratio, variable and so on. They can be usually categorized into two groups; subjective and objective. The subjective methods such as AHP, Weighted Least Squares and Delphi determine weights solely according to the preference or judgments of decision makers and the objective methods determine by solving mathematical models automatically without any
consideration of the decision maker’s preferences, for example, the entropy method, multiple
objective programming, principal element analysis etc. (Lotfi and Fallahnejad, 2010). The entropy was preferred due to entropy-weighted method is often used to determine the index weight in social sciences.
One of the main objective weighting measures is the entropy method, also known as Shannon entropy. Firstly it has been defined by Rudolph Clausius (1865) as a measure of uncertainty and irregularity in the system (Zhang, 2011). It can be thought as a second rule of
thermodynamics. In today’s world it was widely used primarily in physics including mathematics and engineering sciences has been adapted to information theory by Shannon (1948).
Entropy-weighted method is used to measure the amount of useful information provided by the available data (Wu, 2011). As long as the entropy-weighted of evaluation index grows, the index of the useful information rate increases. Besides, entropy-weighted technique is an available measure, which can be used to make an assessment at different decision-making processes. It is seen that entropy-weighted method is often used to determine the index weight in social sciences. In the literature, the number of studies using entropy-weighted method has increased significantly.
To apply the entropy method, first is to construct a value using weighted average method
of annual data from 2005 to 2015. Weighted average method is used when not all of the criteria have the equal weight. For instance, if one desires to forecast the tomorrow’s currency in a stationary economy, comparing the data effectiveness of yesterday and a latter period, obviously yesterday’s data will be more important and effective. Relating to the weighted average method, as in the currency example, 2005 was given the lowest weight and 2015 was given the highest weight. This method includes following steps;
Step 1: Define the evaluation matrix: � ×
The dimension of evaluation matrix is × , m rows and n columns. In this research, m denotes the number of companies in the population and n denotes the number of performance ratio.
Step 2: Standardized each criteria:
Each criteria are normalized with the help of equations (1) and (2).
= ��� , where i=1, 2, … , m. and j=1, 2, …, n. (1)
� × = [� ] = [
… …
… … … … …
…
or
= � , where i=1, 2, …, m. and j=1, 2, …, n. (2)
For the application part, since we want to maximize the value of performance ratios, we must use equation (1).
Step 3: Calculate all index values of entropy: w
w = −∑−m
=1 , where ∑ w= = .
e = −∑m=1 , where i=1, 2, …, m. and j=1, 2, …, n.
f =∑mr r
=1 , where i=1, 2, …, m. and j=1, 2, …, n.
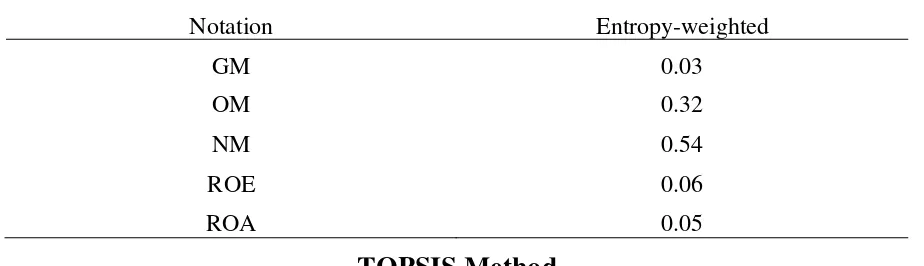
As a result of entropy method, the weights of criteria are presented in Table 3. According to the results, the weights of NM and OM are not surprising since these are the two of most important performance ratios. Considering the REITs and their difference in the cost of sales comparing with the other sectors, gross margin is expected to be less than other ratios. A similar ranking was claimed by Safardokht and Barandagh (2013) in their research.
Table 3: Notation and weights of the criteria (performance ratio)
Notation Entropy-weighted
GM 0.03
OM 0.32
NM 0.54
ROE 0.06
ROA 0.05
TOPSIS Method
To rank the performance of each company, one of the MCDM method named TOPSIS has been applied and it is explained in detailed. This method was first developed in 1981 by Hwang and Yoon and ranks the alternatives according to their distances from the positive ideal and the negative ideal solution, i.e. the best alternative has simultaneously the shortest distance from the positive ideal solution and the farthest distance from the negative ideal solution. The positive (negative) ideal solution is identified with a hypothetical alternative that has the best (worst) values for all considered criteria. (Hwang and Yoon, 1981)
Step 1: Construct the Normalized Decision Matrix: ×
× = [ ] = [
… …
… … … … …
…
= �
√∑�=1� , i=1, 2, 3, …, m. and j=1, 2, 3, …, n.
The dimension of the normalized decision matrix is × , m rows and n columns. In this research, m denotes the number of periods between 2005 and 2015, and n denotes the number
of performance ratios, which are also the criteria to rank the companies’ performance with respect to year. To demonstrate the performance analysis MRGYO is randomly selected and all the following tables are based solely on this company.
Table 4: Normalized decision matrix with TOPSIS method
MRGYO GPM OPM NPM ROA ROE
2015 0.34 0.29 -0.62 -0.57 -0.59
2014 0.25 0.22 0.78 0.79 0.76
2013 0.20 0.22 -0.09 -0.17 -0.24
2012 0.13 0.08 0.00 0.01 0.01
2011 0.13 0.09 0.01 0.02 0.02
2010 0.16 0.13 0.03 0.10 0.08
2009 0.25 0.37 0.01 0.03 0.04
2008 0.37 0.46 0.02 0.03 0.04
2007 0.32 0.41 0.02 0.05 0.07
2006 0.47 0.17 -0.03 -0.06 -0.07
2005 0.46 0.49 -0.01 -0.01 0.00
Step 2: Construct the Weighted Normalized Decision Matrix: ×
The weighted normalized value is calculated as;
= , i=1, 2, 3, …, m. and j=1, 2, 3, …, m.
where is the weight of the ith criteria, and ≤ ≤ , ∑
= = , for all i=1, 2,…, n.
× = [ ] = [
… …
… … … … …
…
Table 5: Weighted normalized decision matrix with TOPSIS
MRGYO GPM OPM NPM ROA ROE
2015 0.07 0.06 -0.12 0.00 -0.12
2014 0.05 0.04 0.16 0.00 0.15
2013 0.04 0.04 -0.02 0.00 -0.05
2012 0.03 0.02 0.00 0.00 0.00
2011 0.03 0.02 0.00 0.00 0.00
2010 0.03 0.03 0.01 0.00 0.02
2009 0.05 0.07 0.00 0.00 0.01
2008 0.07 0.09 0.00 0.00 0.01
2007 0.06 0.08 0.00 0.00 0.01
2006 0.09 0.03 -0.01 0.00 -0.01
2005 0.09 0.10 0.00 0.00 0.00
Step 3: Determine Positive Ideal and Negative-Ideal Solutions
= �+ = { +, +, … , +}, where + = ( � , � ), ( , � ′)
= �− = { −, −, … , −}, where − = ( , � ), ( � , � ′)
where is associated with benefit criteria, and ′ is associated with cost criteria.
Step 4: Calculate the Separation Measure
+=√∑ − +
= and −=√∑ = − −
+ and − are the Euclidean distance from positive ideal solution �+ and negative ideal solution �− for each alternative.
Step 5: Calculate the Relative Closeness to the Ideal Solution
� =�−�+�−+, where ≤ � ≤ .
Step 6: Rank the Preference Order
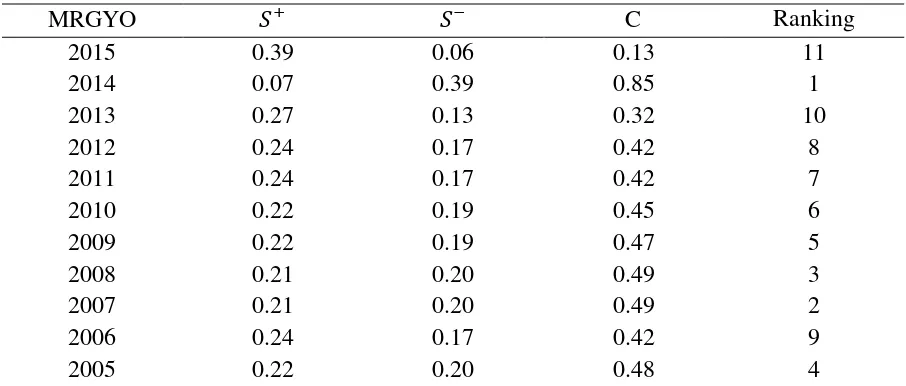
The highest value of relative closeness indicates the highest-ranking order. In other words, the best alternatives are those that have higher � value and therefore should be chosen because they are closer to the positive ideal solution.
Table 6: Separation measure, relative closeness and ranking for MRGYO with TOPSIS
MRGYO + − C Ranking
2015 0.39 0.06 0.13 11
2014 0.07 0.39 0.85 1
2013 0.27 0.13 0.32 10
2012 0.24 0.17 0.42 8
2011 0.24 0.17 0.42 7
2010 0.22 0.19 0.45 6
2009 0.22 0.19 0.47 5
2008 0.21 0.20 0.49 3
2007 0.21 0.20 0.49 2
2006 0.24 0.17 0.42 9
2005 0.22 0.20 0.48 4
Table 7 illustrates frequencies of best business performance with TOPSIS method. For instance from first row, one can understand that 2015 is the best year for 1 company in CMM, 2 companies in CONST and 8 companies in REIF with entropy-weighted TOPSIS method. In addition, from the same row, one can understand that 2015 is the best year for 2 companies in both CMM and CONST, 10 companies in REIF.
Table 7: Frequencies of best business performance with TOPSIS
Entropy-Weighted Equal-Weighted
Year CMM CONST REIF CMM CONST REIF
2015 1 2 8 2 2 10
2014 3 3 3 9 3 3
2013 0 1 3 0 0 2
2012 0 0 2 0 1 2
2011 3 0 7 3 0 7
2010 2 1 3 2 0 3
2009 0 2 1 2 2 1
2008 0 0 3 4 0 3
2007 7 0 2 3 0 2
2006 8 0 1 1 1 0
2005 2 0 0 0 0 0
Max Freq. 8 3 8 9 3 10
Max Year 2006 2014 2015 2014 2014 2015
MAUT
MAUT method can be used both discrete and continuous alternative problems also for quantitative and qualitative criteria. Discrete type alternative problems includes a set of limited alternatives, continuous ones also called multiple optimization problems, which consist of number of infinitely many alternatives (Wallenius, Dyer, Fishburn, Steuer, Zionts and Deb, 2008). The most common method of multi criteria utility function is the additive model (Keeney and Raiffa, 1993). In this article, this technique is preferred additively separable with respect to single attribute utility.
= ∑ = , for all i, = Utility value (overall) of alternative i
Uij = Utility value for the ith alternative of and jth criteria n = Number of criteria in the method
m = Number of alternatives in the method
MAUT method includes five important steps (Alp, Öztel and Köse, 2015); Step 1: Set the criteria and alternatives
Step 2: Calculate weights of each criteria: , ∑= = .
Step 3: Generate the normalized the decision matrix by calculating utility values;
For criteria to be maximized: = �−�− �+−�−
For the criteria to be minimized: = ��++−�−�−
where
+ = the best value of the alternatives − = the worst value of the alternatives
To demonstrate the performance of the MAUT method, MRGYO is randomly selected and all the following tables are based solely on this company. Table 8 illustrates normalized decision matrix that was obtained by the help of the equations described in Step 3.
Table 8: Normalized decision matrix
MRGYO GPM OPM NPM ROA ROE
2015 0.62 0.52 0.00 0.00 0.00
2014 0.35 0.35 1.00 1.00 1.00
2013 0.22 0.36 0.38 0.30 0.26
2012 0.00 0.00 0.44 0.43 0.45
2011 0.00 0.04 0.44 0.43 0.45
2010 0.08 0.13 0.46 0.49 0.50
2009 0.36 0.71 0.45 0.44 0.47
2008 0.71 0.92 0.45 0.44 0.47
2007 0.57 0.80 0.46 0.46 0.49
2006 1.00 0.22 0.42 0.37 0.39
The Worst 1.00 0.92 1.00 1.00 1.00
The Best 0.00 0.00 0.00 0.00 0.00
Step 4: Calculate total utility
= ∑ = for all i.
After getting normalized values, total utility value has been calculated for the each company with equal-weighted and entropy-weighted.
Step 5: Rank the alternatives from the highest to lowest of utility value.
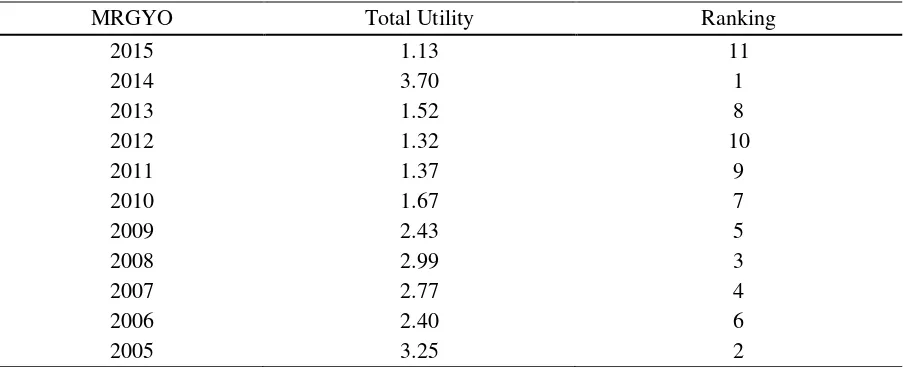
The utility value with the highest value is the best value and by the help of the results of the calculations from Step 3, in Step 4 total utility values were calculated and in Step 5 years were ranked from best to worst depending from highest to lowest value of total utility. The results of these steps are shown in Table 9.
Table 9: Total utility values and ranking for MRGYO with MAUT
MRGYO Total Utility Ranking
2015 1.13 11
2014 3.70 1
2013 1.52 8
2012 1.32 10
2011 1.37 9
2010 1.67 7
2009 2.43 5
2008 2.99 3
2007 2.77 4
2006 2.40 6
2005 3.25 2
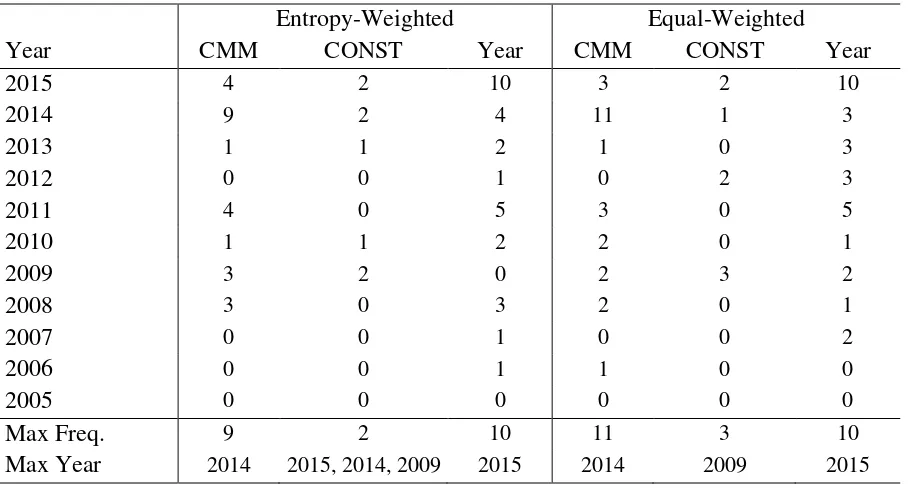
Table 10: Frequencies of best business performance with MAUT
Entropy-Weighted Equal-Weighted
Year CMM CONST Year CMM CONST Year
2015 4 2 10 3 2 10
2014 9 2 4 11 1 3
2013 1 1 2 1 0 3
2012 0 0 1 0 2 3
2011 4 0 5 3 0 5
2010 1 1 2 2 0 1
2009 3 2 0 2 3 2
2008 3 0 3 2 0 1
2007 0 0 1 0 0 2
2006 0 0 1 1 0 0
2005 0 0 0 0 0 0
Max Freq. 9 2 10 11 3 10
Max Year 2014 2015, 2014, 2009 2015 2014 2009 2015
Conclusion
The main aim of this research is to evaluate business performance of the interconnected companies during the period 2005-2015 by using entropy based TOPSIS and MAUT Method. It also serves to understand whether three interconnected sectors’ (CMM, REIF and CONST) performances are similar in the same or following years. The sample consists of 11 years of data (2005-2015) of 68 companies listed in BIST. To rank the years from best to worst of a sector, first it was obviously required to rank the years of every company in each sector. Since we desire to rank the years of each sector/company according to their business performance, the most common five different business performance ratio are used. In other words, regarding
each company’s five ratios, years were ranked from best to worst using TOPSIS and MAUT methods taking account of equally and entropy-weighted. To determine the best years of each interconnected sector, companies of same sector were grouped and the best year frequency in each group was observed.
According to the results using TOPSIS method, best business performance for CMM, REIF and CONST are 2014, 2015 and 2014 respectively, with the assumption of weights are equally distributed. When we change the assumption of equally to weight distributed, and use the weight that were found from entropy method, the best years of REIF and CONST did not change but 2006 became the best performance for CMM. The MAUT method with equally distributed weights resulted that best business performance for CMM, REIF and CONST are 2014, 2009 and 2015 respectively. MAUT method results with the weights calculated with entropy method, the best years of REIF and MAT did not change but in addition to 2009, 2014 and 2015 were also ranked as first for CONST.
distributed analysis but only 2014 and 2015 were added for the CONST. For the TOPSIS method, regarding the weight distribution, MAT’s best performance changed from 2006 to 2014. The research population revealed no significant difference between equal-weighted and entropy-weighted distribution. However, this condition may change in a country and/or a sector, also time.
This research contributes the accounting and statistics literature in two ways; first, it provides a simple method to compare the years instead of units, and as second, using TOPSIS and MAUT methods with and without weighting the criteria, we ranked the years from best to worst measured by the margin and return ratios. The results showed the best performance occurred in 2014 and 2015 for Turkish listed companies in the construction sectors and the result of the criteria are not highly affected by the weight distribution. Considering the limitations (number of companies and periods) of this research, one might observe different results on a wider sample and the method could be applied to other connected sectors (e.g. oil, utility and energy).
References
Abidali, A. F., and Harris, F. (1995). A methodology for predicting company failure in the construction industry. Construction Management and Economics, 13(3), 189–196. Alcock, J., Baum, A., Colley, N., and Steiner, E.V.A. (2013). The Role of Financial Leverage
in the Performance of Private Equity Real Estate Eunds. The Journal of Portfolio Management, 39(5), 99–111.
Alp, I., Öztel, A., Köse, S.M. (2015). Corporate sustainability performance measuring with entropy based MAUT method: A case study. The International Journal of Economic and Social Research, 11(2), 65-81.
Altman, E.I. (2000). Predicting financial distress of companies: revisiting the z-score and zeta models.
Chan, E. H., Suen, H. C., and Chan, C. K. (2006). MAUT-Based Dispute Resolution Selection Model Prototype for International Construction Projects. Journal of Construction Engineering and Management, 132(5), 444–451.
Clausius, R. (1865). The Mechanical Theory of Heat: with its Applications to the Steam Engine and to Physical Properties of Bodies. London: J. Van Voorst.
Dumanoğlu, S. (2010). İMKB’De İşlem Gören Çimento Şirketlerinin Mali Performansının TOPSIS Yöntemi ile Değerlendirilmesi. Marmara Üniversitesi İİBF Dergisi, 5(5), 323– 340.
Ertuǧrul, I., and Karakaşoǧlu, N. (2009). Performance evaluation of Turkish cement firms with
fuzzy analytic hierarchy process and TOPSIS methods. Expert Systems with Applications, 36(1), 702–715.
Eyüboğlu, K., and Çelik, P. (2016). Financial performance evaluation of Turkish energy companies with Fuzzy AHP and Fuzzy TOPSIS methods. Business & Economics Research Journal, 7(3), 21-37.
Figueroa, J., Greco, S., and Ehrgott, M. (2005). Multiple criteria decision analysis: state of the art surveys. Boston, Springer.
Frank, A. G., Souza, D. V. S. De, Ribeiro, J. L. D., and Echeveste, M. E. (2013). A framework for decision-making in investment alternatives selection. International Journal of Production Research, 51(19), 5866–5883.
Fridson, M., and Alvarez, F. (2002). Financial Statement Analysis (3rd ed.). New York, NY, USA: John Wiley and Sons.
Hamzaçebi, C., and Pekkaya, M. (2011). Determining of stock investments with grey relational analysis. Expert Systems with Applications, 38(8), 9186–9195.
Helfert, E. A. (2001). Financial Analysis Tools and Techniques. New York, NY, USA: McGraw-Hill.
Hwang, C. L., and Yoon K. (1981). Multiple attribute decision making: methods and applications: a state-of-the-art survey. New York, NY, USA: Springer-Verlag.
Jackson, P. M., and Fogarty, T. E. (2006). Sarbanes-Oxley and Nonprofit Management. Hoboken, NJ, USA: John Wiley and Sons, Inc.
Keeney, R., and Raiffa, H. (1976). Decisions with multiple objectives: preferences and value Tradeoffs, Cambridge University Press, New York.
Lotfi, F.H. and Fallahnejad, R. (2010). Imprecise Shannon’s Entropy and Multi Attribute
Decision Making. Entropy, 12, 53-62.
Mooney, K. (2008). The Essential Accounting Dictionary. Naperville, IL, USA: Sphinx Publishing.
Mustafa, M.A., and Ryan, T.C. (1990). Decision support for bid evaluation. International journal of Project Management, 8(4), 230-235.
Needles, B. E., Powers, M., and Crosson, S. V. (2011). Principles of Accounting (11th ed.). Mason, OH, USA: South-Western Cengage Learning.
Önüt, S., Efendigil, T., and Soner Kara, S. (2010). A combined fuzzy MCDM approach for selecting shopping center site: An example from Istanbul, Turkey. Expert Systems with Applications, 37(3), 1973–1980.
Özorhon, B. (2012). Türkiye’de İnşaat Sektörü ve Dünyadaki Yeri.
Safardokht, M., & Barandagh, M. (2013). Financial Evaluation and Prioritization of base
metals ındustries listed in Tehran Stock Exchange based on Analytic Hierarchy.
International Journal of Business Economics and Management Studies, 1(2), 160-171. Shannon, C. E. (1948). A mathematical theory of communication. Bell System Technical
Journal, 27, 379–423.
Seçme, N. Y., Bayrakdaroǧlu, A., and Kahraman, C. (2009). Fuzzy performance evaluation in
Turkish Banking Sector using Analytic Hierarchy Process and TOPSIS. Expert Systems with Applications, 36(9), 11699–11709.
Sezgin, A. G. Ş., and Aşarkaya, A. (2015). İnşaat Sektörü.
Stewart R., and Mohamed S. (2002). IT/IS project selection using multi-criteria utility theory. Logistics Inf. Manage, 15(4), 254-270.
Tang, C. M., Leung, A. Y. T., and Lam, K. C. (2006). Entropy Application to Improve Construction Finance Decisions. Journal of Construction Engineering and Management, 132(10), 1099–1113.
Tang, L. C. M., and Leung, A. Y. T. (2009). An entropy-based financial decision support system (e-FDSS) for project analysis in construction SMEs. Construction Management and Economics, 27(5), 499–513.
Tjia, J. S. (2004). Building Financial Models. New York, NY, USA: McGraw-Hill.
Tserng, H. P., Liao, H., Jaselskis, E. J., Tsai, L. K., and Chen, P. (2012). Predicting Construction Contractor Default with Barrier Option Model. Journal of Construction Engineering and Management, 138(5), 621–630.
Türkiye İnşaat Sanayicileri İşveren Sendikası. (2016). İnşaat Sektörü Raporu.
Türkiye Müteahhitler Birliği. (2016). İnşaat Sektörü Analizi.
Wallenius, J., Dyer, J. S., Fishburn, P. C., Steuer, R. E., Zionts, S., & Deb, K. (2008). Multiple criteria decision making, multiattribute utility theory: Recent accomplishments and what lies ahead. Management Science, 54(7), 1336-1349.
Wu, J. Z., and Zhang, Q. (2011). Multicriteria decision making method based on intuitionistic fuzzy weighted entropy. Expert Systems with Applications, 38(1), 916-922.
Yalçın, N., Bayrakdaroğlu, A., and Kahraman, C. (2012). Expert Systems with Applications
Application of fuzzy multi-criteria decision making methods for financial performance evaluation of Turkish manufacturing industries. Expert Systems With Applications, 39(1), 350–364.