Foreword
his document describes the OECD Economic Outlook database – 101th edition - Volume 2017/1.
Section 1 describes the content of the database and gives some information on how data have been compiled and how they can be accessed. Section 2 focuses on the main changes implemented in the last edition of the Economic Outlook database.
Summary tables, codes and formulas have been grouped at the end of this document (annexes) to form a practical user’s guide.
More detailed information - notably on Sources and Methods - can be found online in the OECD Economic Outlook website. The latter should be considered as an important complement to this document:
TABLE OF CONTENTS
Foreword ... 3
Table of contents ... 4
1. Description of the database ...
61.1. The Economic Outlook publication ... 6
1.2. The Economic Outlook database ... 6
1.2.1. Countries and country groupings ... 6
1.2.2. Variables ... 6
1.2.3. Series’ codes used in the Economic Outlook statistical annex ... 7
1.2.4. Frequency, annualisation and seasonal adjustment ... 7
1.2.5. Scale, units, currency and base year ... 7
1.2.6. Data processing ... 8
1.3. Sources and methods ... 9
1.3.1. Online sources and methods ... 9
1.3.2. General assessment of the macroeconomic situation ... 9
1.3.3. Frequently asked questions ... 9
1.3.4. Main sources ... 10
1.3.5. Identities ... 10
1.4. Where to find the data? What are the different electronic formats? ... 11
1.4.1. OECD.stat ... 11
1.4.2. Excel files ... 12
1.4.3. Export to Excel and other formats (CSV, XML…) ... 12
1.5. Recommended uses ... 12
2. Main changes to the database (May 2017)
... 132.1. Date of last update ... 13
Countries and country groupings ... 13
Variables ... 13
2.4. Changes in methodology ... 13
2.4.1. National Accounts ... 13
2.4.2. Balance of payments ... 14
2.4.3. Quarterly National Accounts ... 14
2.4.4. OECD supply-side estimates ... 15
2.4.5. Main changes by country ... 16
2.4.6. Last historical points ... 18
ANNEXES
Annex 1: Codes
... 19Table A1-1: Country codes ... 20
Table A1-2: Variable codes ... 22
Table A1-3: Codes of variables presented in the Economic Outlook statistical annex ... 28
Annex 2: The 10 economic blocks which form the EO database
... 31Table A2-1: External sectors, trade and payments ... 32
Table A2-2: Government accounts ... 34
Table A2-3: Expenditure and GDP ... 36
Table A2-4: Supply block ... 37
Table A2-5: Household sector accounts ... 38
Table A2-6: Prices and deflators ... 39
Table A2-7: Selected variables ... 39
Table A2-8: Labour markets ... 40
Table A2-9: Monetary data ... 40
Table A2-10: Oil and commodities ... 40
Annex 3: Country specifics
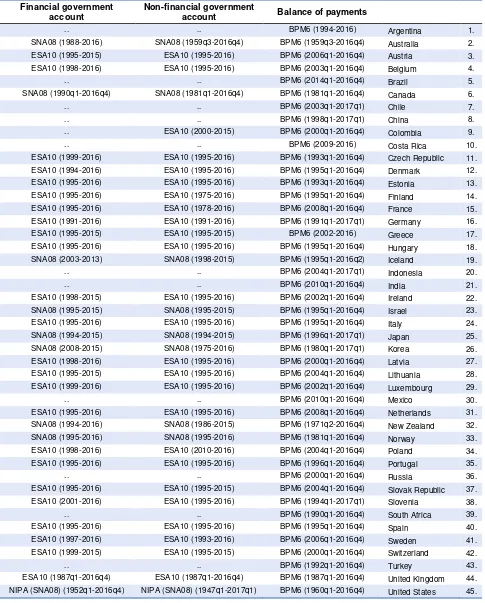
... 41Table A3-1: Coverage and reporting systems ... 42
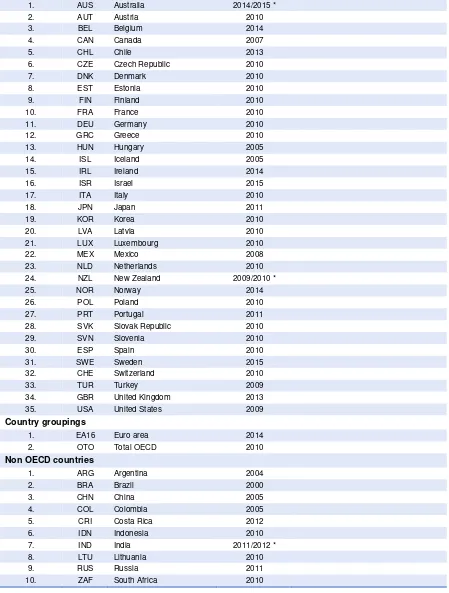
Table A3-2: Reference years ... 44
Table A3-3: National currencies ... 45
Table A3-4: Euro irrevocable exchange rates ... 48
Annex 4: Identities
... 47Annex 5: Miscellaneous indicators ...
65Key international aggregates formula ... 66
1. Competitiveness indicators (XDR) ... 66
2. Export market for goods and services, volume, US$, 2010 prices (XMKT) ... 67
3. Price of non-commodity exports (imports) of goods and services (PXGSX (PMGSX)) ... 68
4. Shadow price of non-commodities goods and services imports (PMSHX) ... 68
5. Competitor’s price of non-commodity goods and services exports (PXCX) ... 68
6. Competitor’s prices of goods and services exports (PXC) ... 68
7. Consistency adjustment series for non-factor services exports, volume ... 68
8. World prices, Goods and services, USD ... 68
9. RAS adjustment series imports prices ... 69
10. Nominal effective exchange rate, constant trade weights ... 69
11. Goods and services trade volume, USD, 2010 prices (TGSVD) ... 69
12. Share of country’s trade in the world trade (SHTGSVD) ... 69
13. Contribution to world trade volume (CTGSVD) ... 69
14. Shares in world exports (XSHA) and imports (MSHA) ... 69
Table A5-1: Cyclical adjustment of fiscal balances - Values of tax and outlays elasticities ... 70
Annex 6: Country groupings and aggregates
... 71Annex 7: Archived changes in previous issues
... 721. DESCRIPTION OF THE ECONOMIC OUTLOOK DATABASE
1.1. The
Economic Outlook
publication
The OECD Economic Outlook (EO) publication presents the OECD’s twice-yearly analysis of the major economic trends and prospects for the next two years.
Prepared by the OECD Economics Department, the Outlook puts forward a consistent set of projections for all OECD member countries as well as for selected non-member countries.
Most data presented in the OECD Economic Outlook publication (and more specifically in the statistical annex) are available in the EO database.
1.2. The
Economic Outlook
database
1.2.1. Countries and country groupings
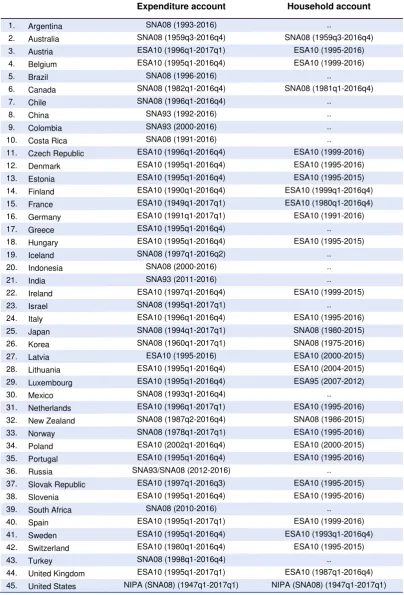
The Economic Outlook (EO) database includes a comprehensive and consistent set of macroeconomic data for the 35 OECD countries and 10 non-OECD countries (Argentina, Colombia, Costa Rica, Brazil, China, India, Indonesia, Lithuania, Russia, South Africa). Data are also available for two major country groupings: total OECD which includes the 35 countries and the OECD euro area (16 countries that are both members of the OECD and the euro area: Austria, Belgium, Estonia, Finland, France, Germany, Greece, Ireland, Italy, Latvia, Luxembourg, Netherlands, Portugal, Slovak Republic, Slovenia, Spain).
Some data related to non-OECD trade regions are also available in the database. Annex 1 - Table A1-1: Country codes
Annex 6 - Country groupings and aggregates
1.2.2. Variables
For the OECD countries, the Economic Outlook database includes data on expenditure, foreign trade, output, employment and unemployment, interest and exchange rates, balance of payments, outlays and revenues of government and of households, government debt, supply and fiscal indicators.
For the non-OECD countries and non-OECD trade regions, only a subset of key national accounts variables, foreign trade indicators and current account series are available.
Annex 1 - Table A1.2: Variable codes
1.2.3. Series’ codes used in the Economic Outlook statistical annex
Annex 1 - Table A1-3: Codes of variables presented in the Economic Outlook statistical annex
1.2.4. Frequency, annualisation and seasonal adjustment
The EO database contains yearly and quarterly data (when relevant) over the historical and projection periods, for OECD countries and OECD country groupings.
Quarterly levels are annualised (i.e. multiplied by 4). Annual levels are derived by averaging annualised quarterly levels.
Preference is given to seasonal adjustments performed by countries. However when adjusted data are not available, seasonal adjustments are performed by the OECD.
OECD quarterly projections are on a seasonally adjusted and working-day-corrected basis for selected key variables. Annual figures are obtained by averaging the quarters, thereby implying that differences between adjusted and unadjusted annual data may occur, though these in general are quite small. In some countries, official forecasts of annual figures do not include working-day correction. Even when official forecasts do adjust for working days, the size of the adjustment may in some cases differ from that used by the OECD.
1.2.5. Scale, units, currency, base years
Constant prices (or volume) and current prices data are expressed in units (they are not in thousands, millions or billions).
Most data are expressed at local currency, sometimes also in US dollars. For country aggregates, different rules apply. See Annex 6 for more information.
For almost all countries, data at constant prices are “chained” volume data.
For most variables at constant prices (volume), base years (or reference years) are specific to each country.
Labour force data are expressed as number of persons.
Prices and indices are based on 100. Like volume data, they vary as to base year depending on national conventions.
Prices and indices related to the external sector (Balance of payments and trade) are based on2010=100
Some aggregates are in index form with 2010=1.
The information is usually given in the “unit” column in OECD.stat and in the series’ labels.
1.2.6. Data processing
Variables are defined in such a way that they are as homogeneous as possible over the countries. Breaks in underlying series are corrected as far as possible.
The following treatments are applied to national data, when necessary:
Back-splicing of data: For several countries, some historical data have been estimated by the OECD Economics Department; if countries revise their methodologies but only supply revised data for recent years, the historical data are estimated by mechanically linking the new and old series. Prior to the first year for which actual historical data are available, data have been spliced backward using the growth rates from the previous national accounts. Calculation of chained volume measures: a common computation of chained volume measures, which may differ from national methodologies, has been introduced over the forecast period for most of the countries and the level of a particular volume aggregate is thus no longer the simple summation of the level of its components. Contributions to changes in real GDP, shown in the OECD Economic Outlook Annex table, but not included in the database release, have been based on a Laspeyres chain-type aggregation: the stock building contribution is computed as the weighted difference between the growth of real gross capital formation (investment including changes in inventories) and the growth of real gross fixed capital formation (investment excluding changes in inventories), the weights reflect the share of the different components of GDP at current prices in the previous period; similarly, the net trade contribution is computed as the weighted difference between the growth of real exports and the growth of real imports, the weights reflect the share of the different components in GDP at current prices in the previous period.
Data processing
Financial statistics
1.3. Economic Outlook sources and methods
1.3.1. Online Sources & Methods
The Economic Outlook Sources & Methods are described on the OECD Economic Outlook website:
http://www.oecd.org/eco/outlook/economicoutlook.htm Statistics>Sources and Methods of the Economic Outlook Direct link: http://www.oecd.org/eco/sources-and-methods.htm Online material includes detailed information on:
Key facts about the OECD Economic Outlook Forecasting methods and analytical tools Economic policies and other assumptions Aggregation methods
References and more...
1.3.2. General assessment of the macroeconomic situation
The policy and other assumptions underlying the projections are described in the “General Assessment of the Macroeconomic Situation”, which is available on line on the OECD website: http://www.oecd.org/eco/outlook/economicoutlook.htm
1.3.3. Frequently Asked Questions (FAQs)
Some of the frequently asked questions are listed on the OECD Economic Outlook website. For example:
When is the Economic Outlook database updated? How can I access previous editions?
How are growth rates calculated?
Are the series final, preliminary or projected? What are the last historical points? What are the differences between the SNA08 and Maastricht definitions of
government financial liabilities?
Why do OECD data for gross financial liabilities differ from IMF estimates? How are country-groupings, such as the euro area, computed?
What is the difference between the revenue statistics and the SNA government revenues?
What is the difference between public debt and government financial liabilities?
Answers to these questions are given on the OECD Economic Outlook website: http://www.oecd.org/eco/outlook/economicoutlook.htm
1.3.4. Main sources
Sources for historical data (i.e. excluding projections) are publications of national statistical agencies and OECD statistical databases such as the OECD Quarterly National Accounts, OECD Annual National Accounts, OECD Annual Labour Force Statistics, and OECD Main Economic Indicators.
More information on sources and methods by country is available on line on the OECD Economic Outlook website:
http://www.oecd.org/eco/sources-and-methods.htm
1.3.5. Identities
Many data in the Economic Outlook database are calculated or re-calculated by formulas. These formulas – or identities – have been established to ensure the consistency of projections.
Definitions of variables and the relations between variables are presented by mathematical expressions between variable codes in the Annex 4. These expressions are identities and hold therefore exactly. Not presented are behavioural relations between variables and other non-identities.
The identities are shown at a quarterly level. Some identities are slightly different on an annual level.
Most identities are identical for all OECD countries.
The base year (or reference year) is relevant for some identities. There are two kinds of base years:
Country specific base years, relevant for volume and price series forexpenditure and GDP (see Annex 2 for current base year). These base years are presented in the identities as “base year”.
1.4. Where to find the data? What are the different electronic formats?
1.4.1. OECD.Stat
The Economic Outlook database is available via OECD iLibrary or OECD.stat (“OECDdotStat” is the OECD official data warehouse).
http://www.oecd-ilibrary.org/content/datacollection/eo-data-en http://stats.oecd.org/Index.aspx
Under the theme “Economic Projections”, select “OECD Economic Outlook > Past and recent issues of the Economic Outlook”.
From issue 60, data can be extracted in the different formats proposed by the browser. For technical reasons, issues up to 59 are available only as pdf files, or as zipped Excel files.
Structure of the Economic Outlook database in OECD.Stat
Data are presented according to three dimensions: Country, Variable and Time & Frequency. Since the Economic Outlook 83, more than 200 variables are implicitly presented in ten different economic blocks, which appears in the following order:
EXT: External sectors, trade and payments GOV Government accounts
EXP: Expenditure and GDP SUP: Supply block
HOU: Household sector accounts PRI: Prices and deflators
SEL: Selected variables (pre-defined indicators, e.g. growth rates) LAB: Labour markets
MON: Monetary data OIL: Oil and commodities
1.4.2. Excel files
The Economic Outlook statistical annex is also available in MS Excel format. However, only broad indicators are available (i.e. growth rates, ratios, indices...). Input series used to calculate these indicators are only available in OECD.stat.
http://www.oecd.org/eco/outlook/economicoutlookannextables.htm
1.4.3. Export to Excel and other formats (CSV, XML…)
Data selection in OECD.stat can be exported to Excel, CSV, PC-axis and XML. A csv file containing all EO data can be found under Export > Related files
1.5. Recommended uses
.The following points should be borne in mind when using the EO data:
Depending on the countries and variables, data are shown from 1960 onwards,
however users should be aware that most of the long time series are constructed using different vintages of data and older information is subject to caution;
Historical data correspond to the data available at the cut-off date for the respective Economic Outlook, and may diverge from data present in other OECD data sets which are updated on a rolling basis;
The list of variables may differ from one edition to the next, following changes in concepts and suppression/addition of indicators;
2. MAIN CHANGES TO THE DATABASE (May 2017)
2.1. Date of last updates
The cut-off date for information used in the current Economic Outlook database (EO101) is 16 May 2017.
2.2. Countries and country groupings
Countries in the Economic Outlook database, 101 edition have not changed compared to previous edition.
With Latvia joining the OECD on 1st July 2016, a new OECD euro area zone coded EA16 was introduced in the previous edition EO100. The former aggregate which excludes Latvia (coded EA15) is now discontinued.
2.3. Variables
Total population (POP) has been added to the database.
Historical data for population are prepared from statistics reported to the OECD Statistics Directorate by member countries in the annual national accounts questionnaire. For the projection period (2016/2017-2018), the historical series are extended on the basis of Eurostat (2013) projections for European countries, and United Nations World Population Prospects (2015 Revision) for other countries. Population aged 15-74 are OECD estimates.
Also added:
GDPV_CAP: Real gross domestic product per capita, national currency GDPVD_CAP: Real gross domestic product per capita, USD, constant PPPs GDPVTR_ANNPCT: Gross domestic product, volume, growth, annualised rate KTPV_AV: Average productive capital stocks over the year, volume
KTPV_AV_ANNPCT: Average productive capital stocks over the year, volume, growth, annualised rate
2.4. Changes in methodology
2.4.1. National accounts – Implementation of SNA08 / ESA2010
The 96th edition of the Economic Outlook (October 2014) saw a major revision of the National Accounts definitions.
Most OECD countries have now implemented the SNA 2008 methodology (or ESA2010, its European equivalent). The impact on data, notably on GDP, can be substantial. Major changes relate to "Research and development (R&D)" which is recognised for the first time as a produced asset and "Military weapons systems" which are now considered as fixed assets. In addition to the new international definitions, some countries have also implemented a new benchmark year and additional improvements.
National statistical offices and international organisations have produced extensive information to explain the impact of new definitions. The following OECD web page includes links to international manuals and country-specific material:
http://www.oecd.org/std/na/implementingthesystemofnationalaccount2008.htm The status of national accounts in OECD countries is summarised in Annex 3:
All changes undertaken by national statistical offices (revisions in national accounts, implementation of new classifications, revised seasonal adjustment techniques, or extension of series in the past) which were available before the above-mentioned cut-off date have been taken into account in the EO database.
2.4.2. Balance of payments – implementation of BPM6
BPM6 is the acronym for the sixth edition of the “Balance of Payments and International Investment Position Manual”. The Manual serves as the standard framework for the compilation of statistics on the transactions and positions between an economy and the rest of the world. It promotes consistency between different data sets, notably with national accounts. Among the numerous changes, the concept of “economic ownership” is introduced.
The balance of payments methods used by each country is summarised in Annex 3:
Table A3-1: Coverage and reporting systems
Sixth Edition of the IMF's Balance of Payments and International Investment Position Manual (BPM6)
2.4.3 Quarterly national accounts
Flash estimates
For some countries, the EO database incorporates preliminary “flash” estimates of GDP for the first quarter 2017Q1. These releases are often accompanied by a revision of past quarters. A second release published latter on after the Economic Outlook release will confirm or adjust the first “flash” estimates.
For some countries, only total GDP at constant prices (code: GDPV) is concerned by the flash release. In consequence, the breakdown between expenditure components over the recent period should be regarded as a judgmental projection.
Frequency issues
As explained in section 1.2.4. Frequency, annualisation and seasonal adjustment, annual data in the EO database are usually derived from quarterly figures. Consequently, annual EO data may sometimes include working day adjustments (WDA) and thus slightly differ from the official release of annual data (which usually exclude this kind of adjustments or apply a different one).
When seasonal adjustments do not respect an annual constraint or when annual and quarterly revisions are published at different dates and when the differences between the two frequencies are too important, then quarterly figures may be benchmarked on the annual values (Chow Lin method), i.e. the quarterly profiles are kept but the quarterly levels in national currency are modified so that, when adding them up, they lead to the official annual data. (See
2.4.4 OECD supply-side estimates
Capital stock
For OECD countries, the physical capital is defined as productive capital stock1 (code KTPV) and is derived from non-housing investment flows.
Potential output
A new formula used to calculate the potential output (GDPVTR) was introduced in EO99. Series on human capital (HCAP) are no longer used and the code for trend labour efficiency has changed from LABEFFS to EFFLABS.
Potential labour
Since EO98, the definition of potential labour has changed in two ways:
o First, working-age population, age 15-74 (code POP1574), is used for potential output rather than age 15 and above. This change ensures more consistency with the labour force statistics. The sources and methods for the labour force participation rate (LFPR1574) have also been revised2.
o Second, for all countries, the equilibrium unemployment rate (code NAIRU) is estimated using a Kalman filter in a Phillips curve framework which assumes inflation expectations are anchored at the central bank’s inflation target3. The NAIRU is then projected forward from the last estimated period using an autoregressive rule, exceptionally modified to account for recent labour market reforms, until the end of the forecasting horizon.
Computation of the underlying fiscal balance
Frequent recourse to large one-off operations in a number of OECD countries has undermined the accuracy of cyclically-adjusted fiscal balance as a measure of both the sustainability of public finance and the fiscal stance. To overcome this problem, the Economic Outlook database includes the underlying fiscal balance, which effectively eliminates the impact of one-offs and cyclical developments. Formally, for each OECD economy, the underlying net lending (NLGQU) is computed as the difference between the cyclically-adjusted net lending (NLGQA) and the net one-offs (NOOQ), all expressed in per cent of GDP. Historical data for net one-offs are derived from previous Economic Outlooks4. Over the projection period, net one-offs are estimated using Budget information or official announcement.
1 OECD (2009), Measuring Capital: OECD Manual, Second Edition. Paris.
2 Working-age population (POP1574) is taken from Eurostat demographic projections (EUROP2013) for EU countries (with the exception of Greece, Switzerland and Norway) and UN World Population Prospects (the 2015 revision) for other countries.
3 Rusticelli E., Turner D. and M. C. Cavalleri (2015), "Incorporating anchored inflation expectations in the Phillips Curve and in the derivation of OECD measures of equilibrium unemployment", OECD Economics Department Working Paper No.1231, OECD Publishing. http://dx.doi.org/10.1787/5js1gmq551wd-en
4
References
The methodology underlying supply variables is further detailed in the OECD Economics Department working paper No.1000, "Long-Term Growth Scenarios" (2013)5 as well as the OECD Economics Department working paper No.1294, “An investigation into improving the real-time reliability of OECD output gap estimates” (2016)6.
The supply data are only available on an annual basis. The absence of quarterly figures is the result of a major revision of the forecasting procedures which was undertaken in the 91st edition of the Economic Outlook (EO91). Supply indicators are calculated by combining various series which for most of them are only available on an annual basis.
2.4.5 Main changes by country
Annex 3 of this documentation shows national reference years, periods covered, system of definition used, national currencies.
Additional and complementary information can be found in the “Economic Outlook Statistical Sources” file:
http://www.oecd.org/eco/sources-and-methods.htm Sources and Methods > Economic Outlook Statistical Sources
Direct link: http://www.oecd.org/eco/outlook/Economic_Outlook_Statistical_Sources.xls
Belgium
o New base year: 2014 (previously 2013) Brazil
o National accounts: Real gross capital formation has been estimated by the OECD. Chile
o New baseyear: 2013 (previously 2008)
o National accounts: Definitions are now consistent with the 2008 System of National Accounts (SNA 2008)
Colombia
o Labour market: Seasonal adjustment is performed by DANE (previously by the OECD)
Czech Republic
o National accounts: Benchmarking of quarterly figures on annual data has been removed. Annual data
are derived by averaging annualized quarterly series.
Germany
o Labour market: 2016 national accounts based total employment has been revised by DESTATIS
because of significant correction of one of their main data source.
5
Johansson, Å., et al. (2013), "Long-Term Growth Scenarios", OECD Economics Department Working Papers, No. 1000, OECD Publishing, Paris. DOI: http://dx.doi.org/10.1787/5k4ddxpr2fmr-en
6 Turner, D., et al. (2016), "An investigation into improving the real-time reliability of OECD output gap estimates", OECD Economics Department Working Papers, No. 1294, OECD Publishing, Paris.
Ireland
o The Irish GDP has been revised up with a 26.3% growth for GDP in 2015. Read the full story about this
revision:
o http://www.oecd.org/std/na/Irish-GDP-up-in-2015-OECD.pdf
o http://ec.europa.eu/eurostat/documents/24987/6390465/Irish_GDP_communication.pdf
o Gross value added excluding sectors dominated by foreign-owned multination enterprises
(IRL.GDPVCSA) is used tp compute supply side variables (see potential output and output gap formulas)
Israel
o National accounts: New source for annual data. In the last edition of the EO, annual levels were calculated as the sum of non-seasonally adjusted quarters. In this edition, GDP and GDP components are taken from the annual accounts which are not strictly identical to the annual values derived from quarters. Quarterly series are benchmarked on these new annual data.
Japan
o National accounts: New base year: 2011 (previously 2005)
o National accountsImplementation of the 2008 System of National Accounts (SNA 2008)
o Gross and net financial liabilities: New source based on ESRI consolidated data based on fical year,
Data have been estimated on a calendar year by the Secretariat .
Lithuania
o Labour market: Changed population coverage for labour force (LF) and total employment (ET). Figures refer to population aged 15 and more (previously the age group was 15-64).
Luxembourg
o National accounts: Definitions are now consistent with the 2010 European System of Accounts
(ESA2010 which is the European equivalent to SNA2008)
New Zealand
o Household sector: Revisions to household saving rate are due to the availability of more accurate data. Russia
o Financial data: The source of data for short and long-term interest rates has been changed to the
following series:
IRL - Russia Government Benchmark Bid Yield 10 Years
IRS - Russia Interbank 31 to 90 Day, Central Bank of the Russian Federation
Slovak Republic
o National accounts: Benchmarking of quarterly figures on annual data has been removed. Annual data are derived by averaging annualized quarterly series.
South Africa
o Labour market: Before 2008, data for total employment 15-64 (ET) and unemployment 15-64 (UN) are
only available on a semester basis. Missing values have been interpolated (linear interpolation). Before performing the interpolation, ET and UN are adjusted to remove a break occurring in 2008Q1. A coefficient defined as the ratio between 2008 new definition and 2008 old definition is applied to the series before 2008
Switzerland
o Labour market: total employment (ET) has been revised from 1995Q3 to 2016Q2. This change reflects a revision of statistics on border workers.
Turkey
o New baseyear: 2009
o National accounts: Definitions are now consistent with the 2008 System of National Accounts (SNA2008 or ESA 2010 its European equivalent)
United States
o Gross and net government financial liabilities: Central government claims of pension funds on pensions
2.4.6. Last historical points
Last historical points can be found in an excel file under “Export > Related files” in OECD.stat. All data after these historical points are forecasts or projections.
2.4.7. Country base years / Standard OECD reference year
A switch to a new reference year may or may not involve major conceptual modification. However, any change in the reference year has an impact on the levels of chained volume measure series rebased to the reference year.
Though the terms often refer to the same concept, “reference year” is usually limited to a simple statistical presentation; in contrast, the term “base year” describes a period during which detailed, revised and improved surveys are conducted. A base year is often used to establish benchmark values from which other data are derived.
For most variables, base years (or reference years) are specific to each country. The following countries have changed their national baseyear since the last edition:
Australia From 2013/14 to 2014/15
Belgium From 2013 to 2014
Chile From 2008 to 2013
Israel From 2010 to 2015
Japan From 2005 to 2011
Turkey From 1998 to 2009
ANNEX 1: CODES
Table A1-1: Country codes
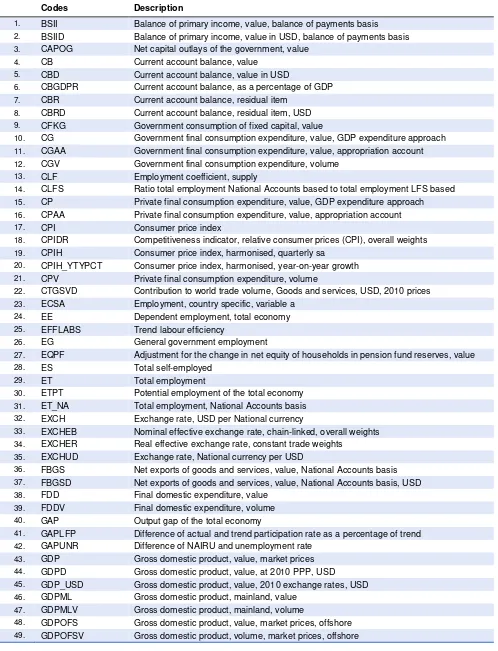
Table A1-2: Variable codes
Table A1.1.
Country Codes
OECD countries
1. AUS Australia
2. AUT Austria
3. BEL Belgium
4. CAN Canada
5. CHL Chile
6. CZE Czech Republic
7. DNK Denmark
8. EST Estonia
9. FIN Finland
10. FRA France
11. DEU Germany
12. GRC Greece
13. HUN Hungary
14. ISL Iceland
15. IRL Ireland
16. ISR Israel
17. ITA Italy
18. JPN Japan
19. KOR Korea
20. LVA Latvia
21. LUX Luxembourg
22. MEX Mexico
23. NLD Netherlands
24. NZL New Zealand
25. NOR Norway
26. POL Poland
27. PRT Portugal
28. SVK Slovak Republic
29. SVN Slovenia
30. ESP Spain
31. SWE Sweden
32. CHE Switzerland
33. TUR Turkey
34. GBR United Kingdom
35. USA United States
Country groupings
1. EA16 Euro Area (16 OECD countries)
2. OTO Total OECD
Non OECD Member countries
1. ARG Argentina
2. BRA Brazil
3. CHN China
4. COL Colombia
5. CRI Costa Rica
6. IND India
7. IDN Indonesia
Non-OECD trade regions
1. DAE Dynamic Asian EconomiesPhilippines, Singapore, Thailand, Vietnam)(Chinese Taipei, Hong Kong, Malaysia, the
2. OOP
Other oil producers (Azerbaijan, Kazakhstan, Turkmenistan, Brunei, Timor-Leste, Bahrain, Iran, Iraq, Kuwait, Libya, Oman, Qatar, Saudi Arabia, United Arab Emirates, Yemen, Ecuador, Trinidad and Tobago, Venezuela, Algeria, Angola, Chad, Rep. of Congo, Equatorial Guinea, Gabon, Nigeria, Sudan)
3. RWD Rest of the world
Note: Codes for the representation of names of countries: ISO 3166 Fourth Edition, 1993-12-15
Table A1.2.
Variable codes
Codes Description
1. BSII Balance of primary income, value, balance of payments basis
2. BSIID Balance of primary income, value in USD, balance of payments basis
3. CAPOG Net capital outlays of the government, value
4. CB Current account balance, value
5. CBD Current account balance, value in USD
6. CBGDPR Current account balance, as a percentage of GDP
7. CBR Current account balance, residual item
8. CBRD Current account balance, residual item, USD
9. CFKG Government consumption of fixed capital, value
10. CG Government final consumption expenditure, value, GDP expenditure approach
11. CGAA Government final consumption expenditure, value, appropriation account
12. CGV Government final consumption expenditure, volume
13. CLF Employment coefficient, supply
14. CLFS Ratio total employment National Accounts based to total employment LFS based
15. CP Private final consumption expenditure, value, GDP expenditure approach
16. CPAA Private final consumption expenditure, value, appropriation account
17. CPI Consumer price index
18. CPIDR Competitiveness indicator, relative consumer prices (CPI), overall weights
19. CPIH Consumer price index, harmonised, quarterly sa
20. CPIH_YTYPCT Consumer price index, harmonised, year-on-year growth
21. CPV Private final consumption expenditure, volume
22. CTGSVD Contribution to world trade volume, Goods and services, USD, 2010 prices
23. ECSA Employment, country specific, variable a
24. EE Dependent employment, total economy
25. EFFLABS Trend labour efficiency
26. EG General government employment
27. EQPF Adjustment for the change in net equity of households in pension fund reserves, value
28. ES Total self-employed
29. ET Total employment
30. ETPT Potential employment of the total economy
31. ET_NA Total employment, National Accounts basis
32. EXCH Exchange rate, USD per National currency
33. EXCHEB Nominal effective exchange rate, chain-linked, overall weights
34. EXCHER Real effective exchange rate, constant trade weights
35. EXCHUD Exchange rate, National currency per USD
36. FBGS Net exports of goods and services, value, National Accounts basis
37. FBGSD Net exports of goods and services, value, National Accounts basis, USD
38. FDD Final domestic expenditure, value
39. FDDV Final domestic expenditure, volume
40. GAP Output gap of the total economy
41. GAPLFP Difference of actual and trend participation rate as a percentage of trend
42. GAPUNR Difference of NAIRU and unemployment rate
43. GDP Gross domestic product, value, market prices
44. GDPD Gross domestic product, value, at 2010 PPP, USD
45. GDP_USD Gross domestic product, value, 2010 exchange rates, USD
46. GDPML Gross domestic product, mainland, value
47. GDPMLV Gross domestic product, mainland, volume
48. GDPOFS Gross domestic product, value, market prices, offshore
50. GDPTR Potential output of total economy, value
51. GDPV Gross domestic product, volume, market prices
52. GDPV_CAP Real gross domestic product per capita, national currency NEW 53. GDPVD_CAP Real gross domestic product per capita, USD, constant PPPs NEW
54. GDPVCSA GDP value country specific (annual non-adjusted GDP or output approach GDP), volume
55. GDPVD Gross domestic product, volume, at 2010 PPP, USD
56. GDPV_USD Gross domestic product, volume, 2010 exchange rates, USD
57. GDPVTR Potential output of total economy, volume
58. GDPV_ANNPCT Gross domestic product, volume, growth, annualised rate NEW 59. GDPVTR_ANNPCT Potential output of total economy, volume , growth, annualised rate
60. GFAR General government gross financial assets, as a percentage of GDP
61. GGFL General government gross financial liabilities, value
62. GGFLM Gross public debt, Maastricht criterion, value
63. GGFLMQ Gross public debt, Maastricht criterion, as a percentage of GDP
64. GGFLQ General government gross financial liabilities, as a percentage of GDP
65. GGINTP Gross government interest payments, value
66. GGINTR Gross government interest receipts, value
67. GNFL General government net financial liabilities, value
68. GNFLQ General government net financial liabilities, as a percentage of GDP
69. GNINTP Net government interest payments, value
70. GNINTQ Net government interest payments, as a percentage of GDP
71. HRS Hours worked per worker, total economy
72. IBGV Private non-residential and government fixed capital formation, volume
73. IBV Private non-residential gross fixed capital formation, volume
74. ICSA Fixed investment, country specific, volume
75. IFU3 Ratio of potential and actual real GDP of the total economy
76. IGAA Government fixed capital formation, value, appropriation account
77. IGV Government gross fixed capital formation, volume
78. IHV Gross fixed capital formation, housing, volume
79. IOBV Private non-residential investment excluding shipping and oil, volume
80. IOILV Fixed investment of the oil industry, volume
81. IRL Long-term interest rate on government bonds
82. IRLR Real long-term interest rate based on lagged GDP deflator
83. IRS Short-term interest rate
84. ISHV Fixed investment of the shipping industry, volume
85. IT Gross fixed capital formation, total, value
86. ITISK Gross capital formation, current prices
87. ITISKV Gross capital formation, total, volume
88. ITV Gross fixed capital formation, total, volume
89. KTPV Productive capital stocks, volume
90. KTPV_AV Average productive capital stocks over the year, volume NEW
91. KTPV_AV_ANNPCT Average productive capital stocks over the year, volume, growth, annualised rate NEW 92. LF Labour force
93. LFPR1574 Labour force participation rate, age 15-74
94. LFPRS1574 Labour force participation rate, age 15-74 (trend)
95. LFS Trend labour force
96. MGS Imports of goods and services, value, National Accounts basis
97. MGSD Imports of goods and services, value, National Accounts basis, USD
98. MGSV Imports of goods and services, volume, National Accounts basis
99. MGSVD Imports of goods and services, volume, USD, 2010 prices
100. MPEN Import penetration, goods and services
102. NAIRU Equilibrium unemployment rate
103. NLG Government net lending, value
104. NLGA Cyclically adjusted government net lending, value
105. NLGC Central government net lending, value
106. NLGCQ Central government net lending, per cent of GDP
107. NLGML Government net lending, value, mainland
108. NLGMLQ Government net lending, mainland, per cent of GDP mainland
109. NLGQ Government net lending, as a percentage of GDP
110. NLGQA Cyclically adjusted government net lending, as a percentage of potential GDP
111. NLGQU Underlying government net lending, as a percentage of potential GDP
112. NLGU Underlying government net lending, value
113. NLGX Government primary balance, value
114. NLGXA Cyclically adjusted government primary balance, value
115. NLGXQ Government primary balance, as a percentage of GDP
116. NLGXQA Cyclically adjusted government primary balance, as a percentage of potential GDP
117. NLGXQU Underlying government primary balance, as a percentage of potential GDP
118. NLGXU Underlying government primary balance, value
119. NOO Net one-offs
120. NOOQ Net one-offs, as a percentage of potential GDP
121. NTR Balance of secondary income, value, balance of payments basis
122. NTRD Balance of secondary income, value, balance of payments basis, USD
123. OILCON Oil market conditions, demand
124. OILMNT Oil market conditions, trade net imports
125. OILSTO Oil, Stocks changes
126. OILSUP Oil market conditions, supply
127. OILXNT Oil market conditions, trade net exports
128. PCG Government final consumption expenditure, deflator
129. PCORE Core inflation index
130. PCOREH Core inflation index, harmonised, HICP excluding energy, food, alcohol and tobacco, quarterly sa
131. PCP Private final consumption expenditure, deflator
132. PCP_YTYPCT Private final consumption expenditure, deflator, year-on-year growth
133. PDTY Labour productivity of the total economy
134. PFDD Final domestic expenditure, deflator
135. PGDP Gross domestic product, deflator, market prices
136. PGDPML Gross domestic product, deflator, mainland
137. PGDPOFS Gross domestic product, deflator, market prices, offshore
138. PIGAA Government fixed capital formation, deflator, based on appropriation account
139. PIT Gross total fixed capital formation, deflator
140. PITISK Gross capital formation, deflator
141. PMGS Imports of goods and services, deflator, National Accounts basis
142. PMGSD Imports of goods and services, 2010 USD deflator, National Accounts basis
143. PMGSX Price of non- commodity imports of goods and services
144. PMNW Price of commodity imports
145. PMSH Shadow price of goods and services imports
146. PMSHX Shadow price of non- commodity goods and services imports
147. POP Total population NEW
148. POP1574 Working-age population, age 15 and older
149. POPS1574 Working-age population, age 15 and older (trend)
150. PPP Purchasing power parity, National currency per USD
151. PSBR Public sector borrowing requirement
153. PTDD Total domestic expenditure, deflator
154. PXC Competitors' price of goods and services exports
155. PXCX Competitors' price of non- commodity goods and services exports
156. PXGS Exports of goods and services, deflator, National Accounts basis
157. PXGSD Exports of goods and services, 2010 USD deflator, National Accounts basis
158. PXGSX Price of non- commodity exports of goods and services
159. PXNW Price of commodity exports
160. RFSH Share of outstanding marketable debt to refinance within coming period
161. RPMGS Relative price of imported goods and services
162. RPXGS Relative price of exported goods and services
163. RSCRP Productive capital stock scrapping rate
164. R_GDPVWDS Ratio of GDPV (sa) to GDPV (adjusted for working days and seasonal correction), real terms
165. SAVG Government saving (net), value
166. SAVGML Government saving, value, mainland
167. SAVH Net household saving, value
168. SAVH_G Gross household saving, value
169. SHTGSVD Share of country's trade expressed in USD volume (2010 prices) in the world trade
170. SRATIO Household and non-profit institutions serving households net saving ratio
171. SRATIO_G Household and non-profit institutions serving households gross saving ratio
172. SSPG Social security benefits paid by general government, value
173. SSRG Social security contribution received by general government, value
174. SSRGA Cyclically adjusted social security contributions received by general government, value
175. TAXQ Taxes and social security contributions, as a percentage of GDP
176. TDDV Total domestic expenditure, volume
177. TEV Total expenditure, volume
178. TEVD Total expenditure, volume, 2010 USD
179. TGSVD Goods and services trade volume, USD, 2010 prices
180. TGSVD_ANNPCT Goods and services trade growth, USD, 2010 prices, annualised rate
181. TIND Taxes on production and imports, value
182. TINDA Cyclically adjusted taxes on production and imports, value
183. TINDML Taxes on production and imports, value, mainland
184. TINDOFS Taxes on production and imports, value, offshore
185. TKPG Capital transfers paid and other capital payments, value
186. TKTRG Capital tax and transfers receipts, value
187. TOCR Other current receipts, general government, value
188. TOCRML Other current receipts, general government, value, mainland
189. TOCROFS Other current receipts, general government, value, offshore
190. TRPDTY Trend labour productivity of the total economy
191. TRPESH Employees and self-employed contribution to social security
192. TRPTSH Total employers social contributions
193. TY Total direct taxes, value
194. TYA Cyclically adjusted total direct taxes, value
195. TYB Direct taxes on business, value
196. TYBA Cyclically adjusted direct taxes on business, value
197. TYBML Direct taxes on business, value, mainland
198. TYBOFS Direct taxes on business, value, offshore
199. TYH Direct taxes on households, value
200. TYHA Cyclically adjusted direct taxes on households, value
201. TYML Total direct taxes, value, mainland
202. ULCDR Competitiveness indicator, relative unit labour costs, overall economy
204. UN Unemployment, level
205. UNR Unemployment rate
206. UNRS National unemployment rate commonly used
207. WAGE Wages, value
208. WPBRENT Crude oil price, fob, spot Brent, USD
209. WPHAMD Agricultural raw materials, world price, HWWI- index in USD
210. WPHD Primary commodities excluding energy, world price, HWWI- index USD
211. WPHFBD Food and tropical beverages, world price, HWWI-index in USD
212. WPHFD Food, world price, HWWI-index in USD
213. WPHMMD Minerals, ores and metals, world price, HWWI- index in USD
214. WPHTBD Tropical beverages, world price, HWWI- index in USD
215. WPI Wholesale price
216. WPOIL OECD crude oil import price, CIF, USD per barrel
217. WRT Wage rate, total economy
218. WSSH Compensation of employees received by households
219. WSSS Compensation of employees, value
220. WSST Compensation rate, total economy
221. XGS Exports of goods and services, value, National Accounts basis
222. XGSD Exports of goods and services, value, National Accounts basis, USD
223. XGSV Exports of goods and services, volume, National Accounts basis
224. XGSVD Exports of goods and services, volume, USD, 2010 prices
225. XMKT Export market for goods and services, volume, USD, 2010 prices
226. XPERF Export performance for goods and services, volume
227. XSHA Share of value exports of goods and services in world exports, USD
228. YDH Net household disposable income, value
229. YDH_G Gross household disposable income, value
230. YDRH Net household disposable income, real
231. YDRH_G Gross household disposable income, real
232. YPEPG Property income paid by government, value
233. YPEPGX Property income paid by government, excluding interest payments, value
234. YPERG Property income received by government, value
235. YPERGML Property income received by government, value, mainland
236. YPERGOFS Property income received by government, value, offshore
237. YPERGX Property income received by government, excluding interest receipts, value
238. YPG Current disbursements, general government, value
239. YPGA Cyclically adjusted current disbursements, general government, value
240. YPGCT Total disbursements, central government, value
241. YPGQ Current disbursements, general government, as a percentage of GDP
242. YPGQA Cyclically adjusted government current disbursements, as a percentage of potential GDP
243. YPGT Total disbursements, general government, value
244. YPGTQ Total disbursements, general government, as a percentage of GDP
245. YPGTX Government total disbursements excluding gross interest payments, value
246. YPGX Current disbursements excluding gross interest payments, general government, value
247. YPGXA Cyclically adjusted current disbursements excluding interest, general government, value
248. YPGXQA Cyclically adjusted government current disbursements excluding interest, as a percentage of potential GDP
249. YPH Current disbursements of households, value
250. YPOTG Other current outlays, general government, value
251. YPOTH Other current income payable by households, value
252. YRG Current receipts, general government value
253. YRGA Cyclically adjusted current receipts, general government, value
255. YRGML Current receipts mainland, general government value
256. YRGOFS Current receipts offshore, general government value
257. YRGQ Government current receipts, as a percentage of GDP
258. YRGQA Cyclically adjusted current receipts, general government, as a percentage of potential GDP
259. YRGT Total receipts, general government, value
260. YRGTML Total receipts, general mainland government, value
261. YRGTQ Total receipts general government, as a percentage of GDP
262. YRGX Current receipts excluding gross interest receipts, general government, value
263. YRH Net current receipts of households, value
264. YRH_G Gross current receipts of households, value
265. YROTH Other current income receivable by households, value
266. YSE Self-employment income received by households, value
Table A1-3.
Codes of variables presented in the Economic Outlook statistical annex
Demand and Output
1. Real GDP GDPV
2. Nominal GDP GDP
3. Real private consumption expenditure CPV
4. Real public consumption expenditure CGV
5. Real total gross fixed capital formation ITV
6. Real gross private non-residential fixed capital formation IBV
7. Real gross residential fixed capital formation IHV
8. Real total domestic demand TDDV
9. Foreign balance contributions to changes in real GDP OECD calculations (CQ_FBGSV)
10. Quarterly demand and output projections CPV, CGV, IBV, ITV, TDDV, XGSV, MGSV, GDPV
11. Contributions to changes in real GDP in OECD countries OECD calculations
12. Output gaps GAP
Inflation, Wages, Costs and Labour Market
13. GDP deflators PGDP
14. Private consumption deflators PCP
15. Consumer prices indices CPI for non-euro area OECD countries and CPIH for euro area countries.
16. Oil and other primary commodity markets WPBRENT, WPHFBD, WPHAMD, WPHMMD, WPHD
17. Compensation of employee WSST
18. Labour productivity PDTY
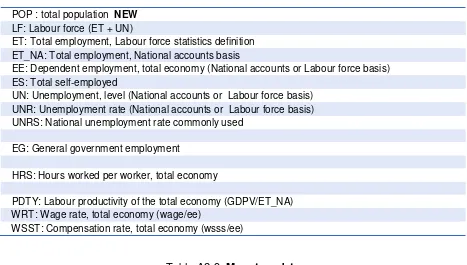
19. Employment and labour force ET, LF
20. Labour force, employment and unemployment LF, ET, UN
21. Unemployment rates: national definitions UNR
22. Harmonised unemployment rates
Not available in Economic Outlook database. Source: OECD Monthly Economic Indicators / Main Economic Indicators
23. Quarterly price, cost and unemployment projections CPI, CPIH, PGDP, ULC et UNR
Key Supply-Side data
24. Potential GDP and capital stock GDPVTR_ANNPCT, KTPV_AV_ANNPCT
25. Structural unemployment and unit labour costs NAIRU, ULC
Saving
26. Household saving rates SRATIO, SRATIO_G
27. Gross national saving SAVTGQ
28. Household wealth and indebtedness
Available in Excel. Source: Canada: Statistics Canada; France: INSEE; Germany: Deutsche Bundesbank; Italy: Banca d'Italia; Japan: Economic Planning Agency; United Kingdom: Office for National Statistics; United States: Federal Reserve
Fiscal Balances and Public Indebtedness
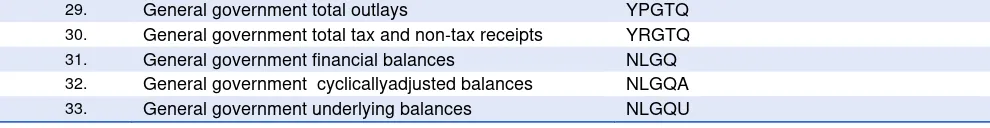
29. General government total outlays YPGTQ
30. General government total tax and non-tax receipts YRGTQ
31. General government financial balances NLGQ
32. General government cyclicallyadjusted balances NLGQA
34. General government underlying primary balances NLGXQU
35. General government net debt interest payments GNINTQ
36. General government gross financial liabilities GGFLQ
37. General government net financial liabilities GNFLQ
38. Maastricht definition of general government gross public
debt GGFLMQ
Interest Rates and Exchange Rates
39. Short-term interest rates IRS
40. Long-term interest rates IRL
41. Nominal exchange rates (vis-à-vis the US dollar) EXCHUD
42. Effective exchange rates EXCHEB
House prices
43. Nominal house prices Source: Various national sources, Nomisma and OECD estimates 7
44. Real house prices Deflated using the private consumption deflator from the national account statistics
45. House price-to-rent ratio Nominal house index divided by rent price index
46. House price-to-income ratio Nominal house price divided by nominal disposable income per head
External Trade and Payments
47. Export volumes of goods and services XGSVD
48. Import volumes of goods and services MGSVD
49. Export prices of goods and services PXGS
50. Import prices of goods and services PMGS
51. Indicators of competitiveness based on relative consumer
prices CPIDR
52. Indicators of competitiveness based on relative unit
labour costs ULCDR
53. Export markets growth in goods and services XMKT
54. Export performance for total goods and services XPERF
55. Import penetration MPEN
56. Shares in world exports and imports XSHA, MSHA
57. Geographical structure of world trade growth TGSVD, CTGSVD
58. Trade balances for goods and services FBGSD
59. Balance of primary income BSIID
60. Balance of secondary income NTRD
61. Current account balances CBD
62. Current account balances as a percentage of GDP CBGDPR
63. Structure of current account balances of major world
regions FBGSD, BSIID, NTRD, CBD
More metadata are available on internet at http://www.oecd.org/eco/sources-and-methods.htm including Notes to the Economic Outlook Annex Tables
7 See table A.1 in Girouard, N., M. Kennedy, P. van den Noord and C. André (2006), “Recent house price developments: the role of fundamentals”, OECD Economics Department Working Papers, No. 475. Data on housing prices are available in OECD.stat in separate datasets:
ANNEX 2: THE 10 ECONOMIC BLOCKS
WHICH FORM THE EO DATABASE
Table A2-1: External sectors, trade and payments
Table A2-2: Government accounts
Table A2-3: Expenditure and GDP
Table A2-4: Supply block
Table A2-5: Household sector accounts
Table A2-6: Prices and deflators
Table A2-7: Selected variables
Table A2-8: Labour markets
Table A2-9: Monetary data
Table A2-1:
External sectors, trade and payments
Current account - National currency
CB: Current account balance, value
BSII: Balance of income, value, balance of payments basis
NTR: Net current international transfers, value, balance of payments basis CBR: Current account balance, residual item
CBGDPR: Current account balance, as a percentage of GDP
Current account - Value in USD
CBD: Current account balance, value in USD
BSIID: Balance of primary income, value in USD, balance of payments basis NTRD: Balance of secondary income, value, balance of payments basis, USD CBRD: Current account balance, residual item, USD
Trade of goods and services, national accounts basis - Value in USD
FBGSD: Net exports of goods and services, value, National Accounts basis, USD MGSD: Imports of goods and services, value, National Accounts basis, USD MGSVD: Imports of goods and services, volume, USD, 2010 prices
XGSD: Exports of goods and services, value, National Accounts basis, USD XGSVD: Exports of goods and services, volume, USD, 2010 prices
Trade prices
PMGSX: Price of non- commodity imports of goods and services PMNW: Price of commodity imports
PXGSX: Price of non- commodity exports of goods and services PXNW: Price of commodity exports
Relative prices
RPMGS: Relative price of imported goods and services RPXGS: Relative price of exported goods and services
Shadow prices
PMSH: Shadow price of goods and services imports
PMSHX: Shadow price of non- commodity goods and services imports
Competitor's prices
PXC: Competitors' price of goods and services exports
PXCX: Competitors' price of non- commodity goods and services exports
Exchange rates
EXCH: Exchange rate, USD per National currency EXCHUD: Exchange rate, National currency per USD
Competitiveness indicators
CPIDR: Competitiveness indicator, relative consumer prices (CPI), overall weights ULCDR: Competitiveness indicator, relative unit labour costs, overall economy
Share in world trade and performance indicators
SHTGSVD: Share of country's trade expressed in USD volume (2010 prices) in the world trade XSHA: Share of value exports of goods and services in world exports, USD
MSHA: Share of value imports of goods and services in world imports, USD TGSVD: Goods and services trade volume, USD, 2010 prices
CTGSVD: Contribution to world trade volume, Goods and services, USD, 2010 prices XMKT: Export market for goods and services, volume, USD, 2010 prices
Table A2-2:
Government accounts
Public debt
GGFL: General government gross financial liabilities, value
GGFLQ: General government gross financial liabilities, as a percentage of GDP GGFLM: Gross public debt, Maastricht criterion, value
GGFLMQ: Gross public debt, Maastricht criterion, as a percentage of GDP GNFL: General government net financial liabilities, value
GNFLQ: General government net financial liabilities, as a percentage of GDP GFAR: General government gross financial assets, as a percentage of GDP
Government deficit
NLG: Government net lending, value
NLGQ: Government net lending, as a percentage of GDP NLGX: Government primary balance, value
NLGXQ: Government primary balance, as a percentage of GDP
Government non-financial accounts Receipts
TIND: Taxes on production and imports, value TY: Total direct taxes, value
TYB: Direct taxes on business, value
YPERG: Property income received by government, value GGINTR: Gross government interest receipts, value
SSRG: Social security contribution received by general government, value TOCR: Other current receipts, general government, value
YRG: Current receipts, general government value (TIND + TY + YPERG + SSRG + TOCR)
Disbursements
CGAA: Government final consumption expenditure, value, appropriation account SSPG: Social security benefits paid by general government, value
YPEPG: Property income paid by government, value GGINTP: Gross government interest payments, value YPOTG: Other current outlays, general government, value
YPG: Current disbursements, general government, value (CGAA + SSPG + YPEPG + YPOTG)
Saving and net lending/borrowing
SAVG: Government saving (net ), value (YRG – YPG) CAPOG: Net capital outlays of the government, value
IGAA: Government fixed capital formation, value, appropriation account TKTRG: Capital tax and transfers receipts, value
TKPG: Capital transfers paid and other capital payments, value CFKG: Government consumption of fixed capital, value NLG: Government net lending, value (SAVG – CAPOG)
YRGT: Total receipts, general government, value YPGT: Total disbursements, general government, value
Central government
YPGCT: Total disbursements, central government, value YRGCT: Total receipts, central government, value NLGC: Central government net lending, value
Mainland/Offshore (Norway-specific variables)
TINDML: Taxes on production and imports, value, mainland
TOCRML: Other current receipts, general government, value, mainland TYBML: Direct taxes on business, value, mainland
TYML: Total direct taxes, value, mainland
YPERGML: Property income received by government, value, mainland SAVGML: Government saving, value, mainland
NLGMLQ: Government net lending, mainland, per cent of GDP mainland YRGML: Current receipts mainland, general government value
YRGTML: Total receipts, general mainland government, value TINDOFS: Taxes on production and imports, value, offshore
TOCROFS: Other current receipts, general government, value, offshore TYBOFS: Direct taxes on business, value, offshore
YPERGOFS: Property income received by government, value, offshore YRGOFS: Current receipts offshore, general government value
Other government variables
GNINTP: Net government interest payments, value
GNINTQ: Net government interest payments, as a percentage of GDP YPGQ: Current disbursements, general government, as a percentage of GDP YRGQ: Government current receipts, as a percentage of GDP
YPGX: Current disbursements excluding gross interest payments, general government, value YRGX: Current receipts excluding gross interest receipts, general government, value
YPGTQ: Total disbursements, general government, as a percentage of GDP YRGTQ: Total receipts general government, as a percentage of GDP
YPGTX: Government total disbursements excluding gross interest payments, value YPEPGX: Property income paid by government, excluding interest payments, value YPERGX: Property income received by government, excluding interest receipts, value TAXQ: Taxes and social security contributions, as a percentage of GDP
PSBR: Public sector borrowing requirement
Table A2-3:
Expenditure and GDP
Gross domestic Product (Expenditure approach) - Current prices
GDP: Gross domestic product, value, market prices GDPD: Gross domestic product, value, at 2010 PPP, USD
GDP_USD: Gross domestic product, value, 2010 exchange rates, USD
CP: Private final consumption expenditure, value, GDP expenditure approach CG: Government final consumption expenditure, value, GDP expenditure approach ITISK: Gross capital formation, current prices
IT: Gross fixed capital formation, total, value
FBGS: Net exports of goods and services, value, National Accounts basis MGS: Imports of goods and services, value, National Accounts basis XGS: Exports of goods and services, value, National Accounts basis
Gross domestic Product (Expenditure approach) - Volume, constant prices
GDPV: Gross domestic product, volume, market prices GDPVD: Gross domestic product, volume, at 2010 PPP, USD
GDPV_USD: Gross domestic product, volume, 2010 exchange rates, USD CPV: Private final consumption expenditure, volume
CGV: Government final consumption expenditure, volume ITISKV: Gross capital formation, total, volume
ITV: Gross fixed capital formation, total, volume
MGSV: Imports of goods and services, volume, National Accounts basis XGSV: Exports of goods and services, volume, National Accounts basis
Final and total expenditure - current and constant prices
FDD: Final domestic expenditure, value FDDV: Final domestic expenditure, volume TEV: Total expenditure, volume
TDDV: Total domestic expenditure, volume
Investment
IHV: Gross fixed capital formation, housing, volume
IBV: Private non-residential gross fixed capital formation, volume
IBGV: Private non-residential and government fixed capital formation, volume IGV: Government gross fixed capital formation, volume
IOILV: Fixed investment of the oil industry, volume ISHV: Fixed investment of the shipping industry, volume
IOBV: Private non-residential investment excluding shipping and oil, volume ICSA: Fixed investment, country specific, volume
Mainland/offshore
GDPML: Gross domestic product, mainland, value GDPMLV: Gross domestic product, mainland, volume