Chapter 2
I
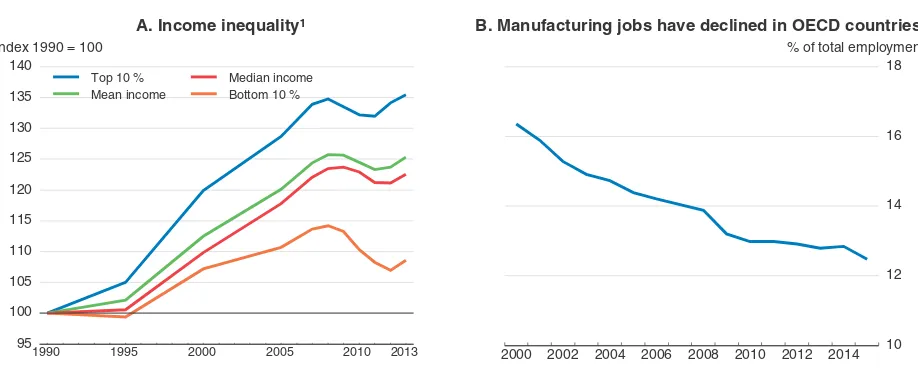
nternational trade has been a powerful engine of global economic growth and convergence in living standards between countries. Trade liberalisation has contributed to large economic gains of emerging market economies and to poverty decline. Specialisation according to comparative advantage and, increasingly, technology-driven and deeper trade integration through global value chains have created new business opportunities and increased economic efficiency. Access to a wider variety of goods and services at cheaper prices has raised well-being and consumers’ purchasing power.Despite these gains, the backlash against international trade has been rising and political support for more protectionism has gained popularity in OECD countries, despite a marked lull in the pace of trade integration since the crisis (Box 2.1). There are multiple reasons for popular dissatisfaction with economic performance. Inequality has risen in many countries since the early 2000s (Figure 2.1, Panel A), contributing to a situation where many households have seen little or no gain in disposable income. Other sources of concern relate to the labour market, with a declining labour share of income and an increase in polarisation as the share of middle-skilled jobs has declined. Manufacturing employment has also continued its declining trend in almost all OECD countries (Figure 2.1, Panel B). Several forces shape these trends, which are common to many OECD countries and some emerging market economies, in particular technological progress, as well as changes in tastes and increased trade integration. Understanding the role played by each of these forces is essential to ensure the appropriate policy response.
Figure 2.1. Income inequality has risen and manufacturing jobs have declined
1. The figure depicts the unweighted average of the 17 OECD countries for which data are available: Canada, Denmark, Finland, France, Germany, Greece, Israel, Italy, Japan, Luxembourg, Mexico, the Netherlands, New Zealand, Norway, Sweden, the United Kingdom and the United States. Some data points have been interpolated or use the value from the closest available year.
Source:OECD estimations based on OECD (2015),In It Together: Why Less Inequality Benefits All, OECD Publishing, Paris; OECD Income Distribution database; OECD National Accounts; and OECD calculations.
1 2 http://dx.doi.org/10.1787/888933502332
95 100 105 110 115 120 125 130 135 140
Index 1990 = 100
1990 1995 2000 2005 2010 2013
Top 10 % Mean income
Median income Bottom 10 %
A. Income inequality¹
2000 2002 2004 2006 2008 2010 2012 2014 10
12 14 16 18 % of total employment
Changes in tastes, technology and trade are fundamental forces underlying a dynamic economy. To exploit their advantages, countries need to have in place policies that promote this dynamism and that develop activities in which their firms and workers are competitive. However, this involves job displacement and changes in relative wages as some industries shrink and demands for skills change. In practice, the gains are often diffuse, while the costs of such changes are likely to be concentrated, long-lasting and very substantial for some people. For instance, the gains coming from cheaper imported goods are spread across all consumers, while the disruption associated with import competition is concentrated on some workers.
This chapter examines the relative importance of these fundamental forces of changing tastes, technology and trade. Then it narrows the examination to considering how rising trade integration has impacted OECD economies and the consequence for their
Box 2.1. Trade integration has risen
The pace of trade integration has been exceptional, particularly in the two decades preceding the financial crisis. From 1990 to 2015, global trade intensity, measured as the share of the total volume of exports and imports of goods and services in world GDP, doubled. Much of the rapid increase in trade intensity can be attributed to the rise of emerging market economies (figure below). Since China joined the WTO in 2001, the share of Chinese exports in total world merchandise export volumes increased from about 4% to 12.6% in 2016 (figure below). The share of OECD goods imports from emerging countries rose threefold over the same period. Emerging market economies have also grown as an export market, notably for large commodity exporters such as Australia and Brazil. By 2010, the G7 countries' share of world manufacturing exports had fallen back to its level in 1900 (Baldwin, 2016). These developments have deeply changed the world economy, particularly by fostering changes in specialisation patterns (Johansson and Olaberria, 2014). Since the financial crisis, trade integration has slowed down (Haugh et al., 2016).
The importance of emerging market economies in trade has risen over the past two decades
1. World trade intensity refers to the sum of exports and imports of goods and services volumes as a share of GDP at market exchange rates.
Source:UN Comtrade database; and OECD calculations.
1 2 http://dx.doi.org/10.1787/888933502294 1975 1980 1985 1990 1995 2000 2005 2010 2015
0 10 20 30 40 50 60 70 % of GDP
A. World trade intensity¹
1995 2000 2005 2010 20150
10 20 30 40 50 60 70 80 90 100 % of world exports of goods
OECD China
Dynamic Asian Economies Rest of the World
labour markets, addressing the effect of trade on job displacement and income inequality. It seeks to answer the following questions:
● What are the main forces which shape the sectoral composition of economies? In particular, what has been the role of trade in the decline of manufacturing employment?
● How has rising trade integration, in particular with emerging market economies, affected export markets of advanced economies?
● What is the impact of trade integration on wage inequality and on the distribution of income? How have regions adjusted, especially at the local level to import competition from low-wage countries?
The main findings of the chapter (Box 2.2) suggest that making trade, and the evolving demands for skills associated with changing tastes and technology, work for all may require more targeted policy action where it is needed most: in regions and for workers who are most vulnerable to disruptions. Measures helping regions to grow and workers to adjust to a new environment are the most likely to bear fruit. Enhanced packages of measures to assist displaced workers, reduce barriers to occupational and geographical mobility and equip workers with skills needed in the labour market would all help the move from declining to expanding activities. Creating the conditions for growth in regions hit by trade, technology, and taste shocks is also necessary.
Box 2.2. Main findings
Tastes, technology, and trade: The drivers behind the evolving nature of jobs at the national level
● The share of manufacturing in employment has continued to decline in OECD countries, although the
extent of the fall varies across countries. Services jobs have expanded.
● Job losses in the manufacturing sector are the result of multiple forces, including shifts in preferences of
consumers, technical progress, and increasing reliance on services inputs in industry and trade.
● The gradual shift towards knowledge-based investment and the consumption of services is driven by
evolving consumer preferences and higher real incomes. Comparatively rapid increases in manufacturing productivity have further driven the decline in the share of manufacturing employment.
● Trade deficits account for part of the decline of the manufacturing sector in some countries. But their impact
has been limited compared to other factors. In a few advanced countries and in many emerging market economies, trade has provided an opportunity for preserving or even expanding manufacturing jobs.
● Importing regions in countries that have strong links to global value chains appear to gain
manufacturing jobs that have a higher trade intensity.
Recent trade patterns and their impact on advanced economies' export markets
● Over the past three decades, the volume of trade in goods and services has risen dramatically, although
the rate of increase has slowed since the financial crisis. The share of emerging market economies in world trade, particularly China, has risen substantially.
● Foreign competition has grown modestly with rising trade integration. Many OECD countries have narrowed
the range of goods on which they are relatively competitive in world markets, while emerging market economies, especially China, have broadened their product specialisation from a narrow base. On average, China's export product mix remains significantly different from that of the advanced economies.
● OECD countries have moved up the complexity ladder. China has also moved up the quality ladder,
The focus of this chapter is on the domestic policies needed to support adjustment to a dynamic environment of evolving jobs and skills, including those related to trade. But domestic policies are only one part of an integrated approach that is needed to meet the challenges of globalisation and technological change. One element of the integrated approach is to strengthen domestic policy packages to ensure that gains are broadly shared and growth is inclusive. The OECD’s work on inclusive growth identifies such policy packages (OECD, 2016f; Causa et al., 2015). Another element of the integrated approach is to adopt policies to create a more level playing field in conjunction with international agreements which are also needed to restore trust (OECD, 2017b). This includes global arrangements to ensure that globalisation does not encourage a race to the bottom in terms of institutions and in terms of standards, in particular for labour and environmental protection standards (OECD, 2017f). Multilateral conventions on tax cooperation, such as on Base Erosion and Profit Shifting (BEPS), are also needed to reduce cross-border shifts in taxable profits that limit governments' capacity to raise revenues (Akgun et al., 2017) and accentuate the perception that globalisation is “unfair’’. The expansion of trade also has implications for corruption, illicit trade and trade in counterfeit products, all of which require international cooperation to tackle the problem (OECD, 2016g; OECD/EUIPO, 2016).
Box 2.2. Main findings(cont.)
Focusing on trade: the benefits
● Rising trade integration has brought substantial aggregate gains in terms of efficiency, firm productivity
and consumer welfare.
● These trends have coincided with a shift in the pattern of specialisation and a strengthening of global
value chains which have resulted in additional gains but also economic disruptions.
Focusing on trade: the costs to regions
● Greater exposure to imports at the regional level is sometimes associated with a decline in regional
manufacturing jobs.
● Shrinking regional manufacturing employment tends to be associated with a decline in overall regional
employment and in earnings. This suggests significant adjustment barriers and spillover effects at the regional level.
● Greater exposure to imports, which is sometimes associated with greater regional disparities, suggests
long-lasting costs for some workers and regions. Low geographical and inter-industry mobility of workers hinders local economies’ ability to adjust to shocks.
Link between trade and income inequality
● Imports from low-wage countries, together with technological advances, contribute to the productivity
dispersion of firms and raise wage dispersion across firms. This reinforces the relationship between wages and productivity at the firm level.
● Trade integration has coincided with growing job polarisation. International evidence suggests that
routine jobs are more likely to be offshored and to be associated with larger wage declines.
● Import competition from low-wage countries is associated with a decline of the labour share in some
Trade, technology and tastes are all changing the structure of economies
This section analyses the main drivers behind the changes in the sectoral composition of GDP. It examines whether trade has played a role in the decline of the manufacturing sector and how large its role has been compared with other drivers, such as technology and tastes. Two approaches are used: an accounting exercise looking at the impact of net trade flows and an econometric analysis looking at the gross impact of trade on manufacturing employment through import competition.
Trade is not the main driver of structural change
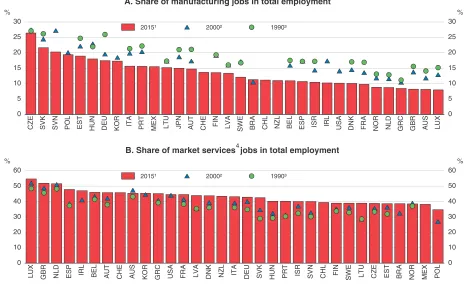
One of the key concerns about increasing trade intensity is that imports are destroying jobs, especially in the manufacturing sector. Concern is high because the strong long-term downward trend in manufacturing employment, coupled with stickiness of the labour market (OECD, 2009) and low job turnover, mean that shocks to the sector, including from trade, are long-lasting. From 2000 to 2015, the share of the manufacturing sector in total employment fell in all advanced economies and the share of jobs in services increased (Figure 2.2). However, there are important differences between countries; for example,
Figure 2.2. Evolution of jobs in manufacturing and services
1. 2013 for Australia and Mexico; 2014 for Brazil, Japan and New Zealand. 2. 2004 for Korea.
3. 1991 for Germany; 1992 for Italy; 1993 for Czech Republic and Sweden; 1994 for Japan and the United Kingdom; 1995 for Belgium, Spain, Estonia, Greece, Hungary, Israel, Lithuania, Luxembourg, Latvia, the Netherlands, Slovak Republic and Slovenia.
4. Market services are defined based on ISIC Rev4 and include distributive trade, repairs, transport, accommodation, food services, information and communication, financial and insurance activities, real estate activities, prof. scientific, tech., administrative support service activities.
Source:OECD National Accounts database.
1 2 http://dx.doi.org/10.1787/888933502351
CZE SVK SVN POL EST HUN DEU KOR ITA PRT MEX LTU JPN AUT CHE FIN LVA SWE BRA CHL NZL BEL ESP ISR IRL USA DNK FRA NOR NLD GRC GBR AUS LUX
2015¹ 2000² 1990³
A. Share of manufacturing jobs in total employment
LUX GBR NLD ESP IRL BEL AUT CHE AUS KOR GRC USA FRA LVA DNK NZL ITA DEU SVK HUN PRT ISR SVN CHL FIN SWE LTU CZE EST BRA NOR MEX POL
4
2015¹ 2000² 1990³
Germany experienced a decline of 4 percentage points in the manufacturing share while the United Kingdom experienced a decline of 8 percentage points. This trend has been long-standing in many countries; for example, it began in the 1950s in the United States and in the 1970s in France. The decline of the share of manufacturing sector in total employment in emerging market economies has been less pronounced.
Identifying the reasons for the changes in the sectoral composition of GDP, and in particular the decline of manufacturing jobs, is difficult because of the simultaneous effects of a number of relevant drivers.
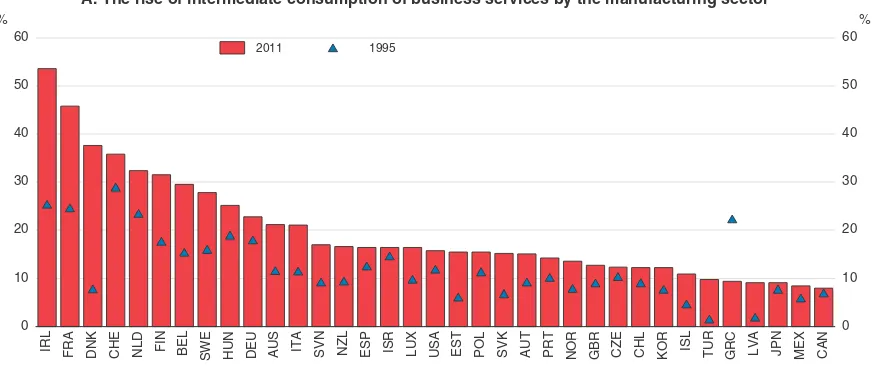
First, part of the measured decline in manufacturing jobs is overstated and is related to the re-organisation of economic activities within and between firms (Berlingieri, 2014; Figure 2.3, Panel A). In particular, partly driven by changing technology, companies have tended to outsource their service operations to other firms in the domestic economy, resulting in a reclassification of jobs from manufacturing to services. This effect is large and accounts, for instance, for 20% of the decline in manufacturing jobs in France between 1980 and 2007 (Demmou, 2010). This change in employment and the associated reclassification is not always neutral for workers, as it can imply significant changes in working conditions, collective bargaining arrangements and wages (Braun and Scheffel, 2007).
Second, part of the decline in manufacturing jobs is related to productivity gains and changes in the composition of consumer demand. Theoretically, to keep manufacturing jobs constant it is necessary that demand for manufacturing goods increases in the same proportion as labour productivity gains. However, this has not been the case for the following reasons:
● At the aggregate level, as consumers get richer, they tend to devote a higher proportion of their income to services compared to manufacturing. This implies a lower need for manufacturing jobs and a higher need for jobs in services (Figure 2.3, Panel B; Herrendorf et al., 2013).
● In addition, technical progress has been faster in manufacturing than in services (Figure 2.3, Panel C). Productivity gains reduce relative manufacturing prices and so increase demand for manufacturing goods. However, stronger productivity has also reduced the need for labour inputs. In the end, the second effect has dominated, and manufacturing employment has declined (Swiecki, 2014; Demmou et al., 2017).
● The composition of investment has similarly shifted away from manufacturing and toward more intangible investment, including more business services, in particular services like transportation, storage, finance services and ICT (Bems, 2008).
Figure 2.3. A portion of job losses in the manufacturing sector is related to domestic outsourcing and changes in consumption patterns
Source:OECD TiVA database; OECD Economic Outlook database; and OECD Productivity database.
1 2 http://dx.doi.org/10.1787/888933502370
DNK CHE NLD FIN BEL SWE HUN DEU AUS ITA SVN NZL ESP ISR LUX USA EST POL SVK AUT PRT NOR GBR CZE CHL KOR ISL TUR GRC LVA JPN MEX CAN
2011 1995
A. The rise of intermediate consumption of business services by the manufacturing sector
0 10000 20000 30000 40000 50000 60000 70000 80000 90000 100000
0
Share of manufacturing goods in consumption, 2011
0 Share of manufacturing goods in consumption, 2011
ARG
GDP per capita, current prices, current PPPs
B. The share of manufacturing in consumption declines with income per capita
2000 2002 2004 2006 2008 2010 2012 2014 2016 90
C. Productivity in manufacturing and services sectors
United States
Manufacturing Services
2000 2002 2004 2006 2008 2010 2012 2014 201690
manufacturing goods and, through this channel, contribute to the decline in the share of manufacturing employment (Demmou et al., 2017).
To try to untangle some of these factors, a simulation exercise based on an accounting framework has been employed.1It suggests that trade has had a significant impact on the sectoral composition of output in advanced economies, although it does not appear to be the main driver, with changes in the organisation of production on account of technological change and in tastes being the main factors pushing down the manufacturing share (Box 2.3).
1. The analysis refers to the impact of changes in specialisation and the sectoral trade balance on the level of sectoral employment. The impact on the level of employment cannot be derived from such an analysis. The overall trade balance (driven by global saving and investment) and the bilateral trade balance (determined by structural factors such as comparative advantages) have only a marginal impact on the level of employment, which remains determined by macroeconomic and structural policies and institutions.
Box 2.3. An accounting framework to assess the contribution of domestic
and international factors to structural change
The aim of the simulations reported below is to analyse the reasons behind changes in the sectoral composition of output in selected countries over the period 1995-2011. The simulations are based on a simple accounting framework linking sectoral value added with the different components of demand (Demmou et al., 2017). The OECD input-output database is used.
Three main drivers are distinguished: changes in the use of intermediate consumption, including via domestic outsourcing of services by the manufacturing sector; changes in the composition of demand from manufactured goods towards services; and changes in trade. The effect of trade on structural change works through two channels: i) a sectoral specialisation effect and ii) the overall trade balance effect (net saving). For a given trade balance, a change in specialisation implies that resources are re-allocated between sectors.
The impact of each effect is calculated by using counterfactual scenarios.
● A technology channel through input-output linkages: The impact of changes in the structure of production
is assessed by looking at what would have been the share of the manufacturing sector in total value added if the share of intermediate consumption used by each sector is set at the value observed in 1995.
● A taste channel: The impact of a change in the structure of demand (mainly in response to technological
change) is assessed by looking at what would have been the share of the manufacturing sector in total value added if the composition of demand (the share of manufacturing goods in consumption and investment) is set at the value observed in 1995.
● A trade balance channel: The impact of trade is assessed by looking at what would have been the share of
the manufacturing sector in value added if the trade deficit and specialisation were the same as in 1995.
● The residual category “other” includes changes in taxes and other demand components (public
consumption and change in inventories). The results suggest that:
● Changes in input-output linkages, including domestic outsourcing (a reclassification largely driven by
technological change) explains a sizeable share of the manufacturing sector decline in all countries.
● Changes in the composition of consumption and investment towards more services (the taste channel)
also explain a substantial part of the decline, especially in high-income countries.
● The trade balance does not appear to be the main driver of the job decline in the manufacturing sector. In
Box 2.3. An accounting framework to assess the contribution of domestic and international factors to structural change(cont.)
Main determinants behind the manufacturing sector decline1
1. Countries are ranked according to the decline in the share of manufacturing in value added between 1997 and 2010.
Source:Demmou, L., C. Thubin and Y. Kalantzis (2017), “De-industrialisation in OECD Countries; A Simple Accounting Approach”, OECD Economics Department Working Papers, forthcoming, OECD Publishing, Paris.
1 2 http://dx.doi.org/10.1787/888933502313
0 5 10 15 20 25 30 35 %
0 5 10 15 20 25 30 35
%
GBR LUX CAN BEL FIN FRA PRT ITA USA SWE CZE EST NLD JPN CHN AUT SVK DEU
1997 2010
A. Share of manufacturing in value added
-10 -8 -6 -4 -2 0 2 4 6 8 %
-10 -8 -6 -4 -2 0 2 4 6 8
%
GBR CAN BEL FIN PRT FRA ITA LUX USA SWE NLD CZE CHN JPN EST AUT DEU SVK
Technical coefficients (including outsourcing) Taste
Trade Others
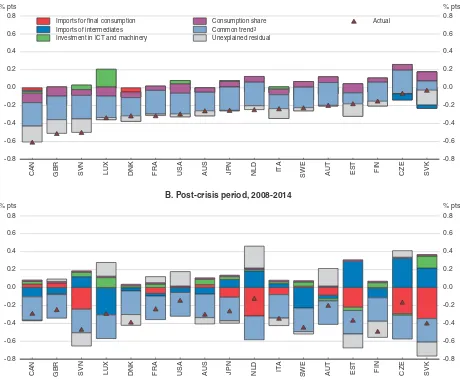
Import competition has a relatively minor effect on manufacturing jobs and value
chains appear to have a positive effect
Regression analysis2supports the results of the accounting framework analysis, by suggesting that import penetration has had a relatively minor impact on manufacturing employment. Indeed, by far the most important contribution to the declining manufacturing employment share is a trend, common across countries and unexplained by the different explanatory variables, which has contributed between ¼ and ½ a percentage point per annum to the decline since the 1990s (Figure 2.4). This common trend can be interpreted as the impact of structural change, once the effects of import penetration and proxies for changing tastes and ICT investment have been accounted for. Most probably, it captures otherwise unmeasured changes in technology and tastes.
Considering the trade channel, however, the impact of import penetration is found to differ significantly for intermediate and final consumption goods:
● Increased import penetration of intermediate goods has been associated with higher manufacturing employment (or rather the employment share falling less steeply) with substantial positive contributions to the manufacturing employment share of at least ¼ percentage point per annum in Czech Republic, Slovakia and Estonia. The contribution to employment has been smaller in most countries in the post-crisis period compared to the pre-crisis period, reflecting the plateauing of global activity in GVCs.
● Conversely, increased import penetration in final consumption goods tends to be associated with lower manufacturing employment, although the effects are not statistically robust and for most countries tend to be relatively small. Moreover, for those countries in which the negative effects are estimated to be larger, they are typically out-weighed by the positive effect of intermediate imports. No statistically significant distinct effect was found for increased import penetration from China, either in terms of intermediate or finished goods, although this does not preclude negative effects via lower wages.
Rising trade integration has strengthened competitive pressure and modified
specialisation in advanced economies
Changes in tastes and technology, together with rising trade integration, have also helped to change trade patterns. In particular, the integration of emerging market economies into the world economy has created new opportunities as well as competition for advanced countries in their export and domestic markets. This section looks at how competitive pressure in export markets has increased and affected specialisation of advanced economies in goods and services.
Advanced economies have narrowed their specialisation in goods and moved up the
complexity ladder
To examine how competition in export markets has changed over the past two decades, the analysis is based on indicators of revealed symmetric comparative advantage (RSCA). This indicator measures the extent of specialisation of each country’s exports and the similarity of
specialisations across advanced and emerging market economies.3A country is said to be “specialised” in a product when the share of that product in their total exports is higher than the corresponding share of the product in world exports (RSCA > 0). The analysis is undertaken at a disaggregated six-digit HS (Harmonised System) product level of nearly 5000 products.
The range of products in which many advanced countries are specialised in world markets has narrowed as global trade intensity has increased (Harrigan, 2001). By contrast,
Figure 2.4. Explaining the decline in the manufacturing employment share
in selected OECD countries
Contributions to the annual average percentage point change in the share of manufacturing in total employment1
1. Decomposition based on equations described in Annex 2.2. Countries are ranked according to the decline in the manufacturing employment share in the pre-crisis period.
2. The start of the pre-crisis sample period varies across countries depending on data availability. 3. The “common trend” effect is calculated as the effect of the constant and the time dummies. Source:OECD calculations.
CAN GBR SVN LUX DNK FRA USA AUS JPN NLD ITA SWE AUT EST FIN CZE SVK
Imports for final consumption Imports of intermediates Investment in ICT and machinery
Consumption share Common trend³ Unexplained residual
Actual
A. Pre-crisis period, 1990-2008²
CAN GBR SVN LUX DNK FRA USA AUS JPN NLD ITA SWE AUT EST FIN CZE SVK B. Post-crisis period, 2008-2014
emerging market economies have increased their product range over this period, as have countries in southern Europe undergoing structural change, including Spain, Portugal and Italy (Figure 2.5).
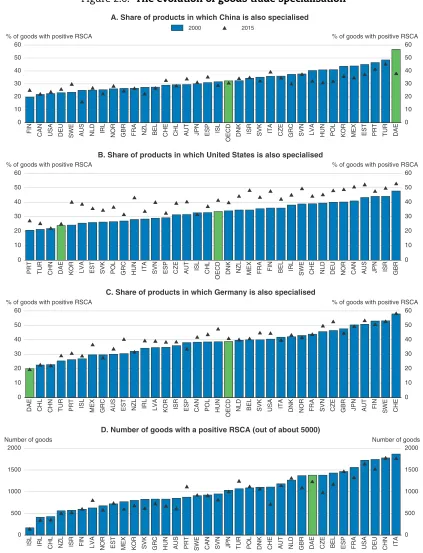
Generally the overlap is low between the types of products in which China and other emerging markets specialise and those in which the advanced countries specialise (Figure 2.6). On the other hand, the overlap is much greater in the types of products in which the advanced economies specialise. The overlap of products in which both advanced and emerging market economies are specialised, including China, is increasing (Araujo et al., 2017; Figure 2.6, Panel A). However, the increase in overlap between emerging and advanced countries is less than that between advanced countries (Figure 2.6, Panels B and C). Why do these overlaps in specialisation matter? Because such overlaps imply increased competition in export markets and associated dynamism in domestic economies, firms, and workers.
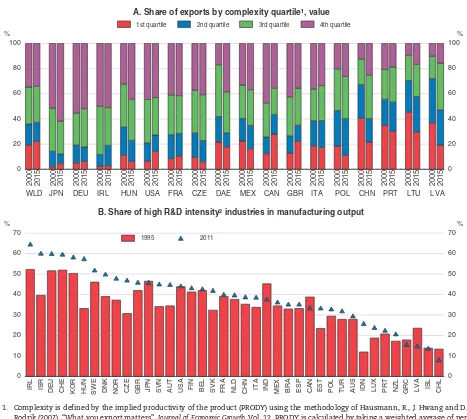
At the same time as competitive pressures have increased, OECD countries have moved up the complexity ladder (Figure 2.7, Panel A). China has also moved up the complexity ladder although the complexity of its product mix still remains behind major OECD economies (Amiti and Feund, 2010; Araujo et al., 2017). Since 1990, emerging market economies have generally increased the share of knowledge-intensive activities in their manufacturing sectors but the share remains below that of OECD countries (Figure 2.7, Panel B). The move up the complexity scale may have contributed to increasing skill bias in labour demand in OECD countries, but more research is needed.
Regression analysis of the export growth of 700 manufactured product categories across 44 countries from 1995 to 2015 confirms that the competitive pressure from emerging market economies has increased. It has, nevertheless, exerted less pressure on the export performance of advanced economies, given their typical export product mix,
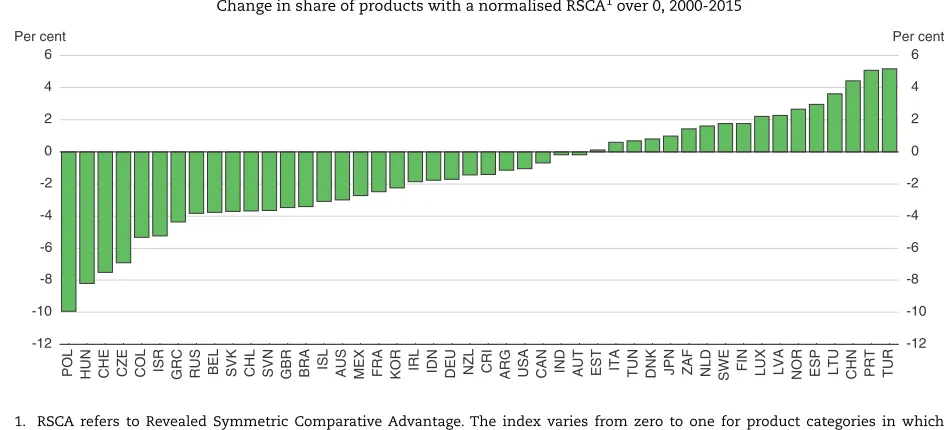
Figure 2.5. The comparative advantage of advanced economies has narrowed
Change in share of products with a normalised RSCA1over 0, 2000-2015
1. RSCA refers to Revealed Symmetric Comparative Advantage. The index varies from zero to one for product categories in which countries and regions have a revealed comparative advantage and from minus one to zero for product categories in which countries/ regions have a revealed comparative disadvantage. The analysis is undertaken at a disaggregated six-digit HS (Harmonised System) product level with about 5 000 products, excluding the main commodities.
Source:UN Comtrade database; and OECD calculations.
1 2 http://dx.doi.org/10.1787/888933502408
-12
-10 -8 -6 -4 -2 0 2 4 6 Per cent
-12 -10 -8 -6 -4 -2 0 2 4 6 Per cent
Figure 2.6. The evolution of goods trade specialisation
Note:RSCA refers to Revealed Symmetric Comparative Advantage. The index varies from zero to one for product categories in which countries and regions have a revealed comparative advantage and from minus one to zero for product categories in which countries or regions have a revealed comparative disadvantage. The analysis is undertaken at a disaggregated six-digit HS (Harmonised System) product level with about 5 000 products, excluding the main commodities. The high level of product disaggregation allows specialisation at different stages of the production chain but nevertheless the data are measured in terms of gross value and not value added as would be used in measures of global value chains (GVCs). DAE refers to Dynamic Asian Economies.
Source:UN Comtrade database; OECD calculations.
1 2 http://dx.doi.org/10.1787/888933502427
SWE AUS NLD IRL NOR GBR FRA NZL BEL CHE CHL AUT JPN ESP ISL OECD DNK
ISR SVK ITA CZE
GRC SVN LVA HUN POL KOR MEX EST PRT TUR DAE
2000 2015
A. Share of products in which China is also specialised
PRT TUR CHN DAE KOR LVA EST SVK POL GRC HUN ITA SVN ESP CZE AUT ISL CHL OECD DNK
NZL MEX FRA FIN BEL IRL SWE CHE NLD DEU NOR CAN AUS JPN ISR GBR
B. Share of products in which United States is also specialised
DAE CHL CHN TUR PRT ISL MEX GRC AUS EST NZL IRL LVA KOR ISR ESP CAN POL HUN OECD NLD
BEL SVK USA ITA DNK NOR FRA SVN CZE GBR JPN AUT FIN SWE CHE
C. Share of products in which Germany is also specialised
ISL IRL CHL NZL ISR FIN LVA NOR EST MEX KOR SVK GRC HUN AUS PRT SWE CAN SVN JPN TUR POL DNK CHE AUT NLD GBR DAE CZE BEL ESP FRA USA DEU CHN ITA
than competition with other advanced economies (Annex 2.1; Araujo et al., 2017). In particular, the competitive pressure on a typical OECD country's exports from an increase in the United States’ specialisation in a product is more than three times that from China and twice that from the Dynamic Asian Economies.
Figure 2.7. Advanced OECD countries specialise in more complex products
than emerging markets
1. Complexity is defined by the implied productivity of the product (PRODY) using the methodology of Hausmann, R., J. Hwang and D. Rodrik (2007), “What you export matters”,Journal of Economic Growth, Vol. 12. PRODY is calculated by taking a weighted average of per capita GDPs of the countries that export the product. The weights are the revealed comparative advantage of each country in that product. The products are then ranked according to their PRODY level. An example of a product in the 4th (highest) quartile is magnetic imaging resonance (MRI) machines used in scans in hospitals, which ranked 18th in 2015 out of 4989 products listed in the Harmonized System 6 classification. A product in the 1st (lowest) quartile is crayons ranked 4218th in 2015. The analysis is carried out using a high level of product disaggregation to capture specialisation at different stages of the production chain. Nevertheless, the data are measured in terms of gross value and not value added as would be used in measures of global value chains (GVCs). DAE refers to Dynamic Asian Economies.
2. Sectoral R&D intensity is calculated in line with the OECD methodology described in Galindo-Rueda, F. and F. Verger (2016), “OECD Taxonomy of Economic Activities Based on R&D Intensity”,OECD Science, Technology and Industry Working Papers, 2016/04, OECD Publishing, Paris.
Source:UN Comtrade database; OECD TiVA database; and OECD calculations.
1 2 http://dx.doi.org/10.1787/888933502446
2000 2015 2000 2015 2000 2015 2000 2015 2000 2015 2000 2015 2000 2015 2000 2015 2000 2015 2000 2015 2000 2015 2000 2015 2000 2015 2000 2015 2000 2015 2000 2015 2000 2015 2000 2015
WLD JPN DEU IRL HUN USA FRA CZE DAE MEX CAN GBR ITA POL CHN PRT LTU LVA
1st quartile 2nd quartile 3rd quartile 4th quartile
A. Share of exports by complexity quartile¹, value
KOR HUN SWE DNK NOR CZE GBR JPN SVN AUT USA FIN BEL SVK FRA NLD CHN ITA IND MEX BRA ESP CAN EST POL TUR AUS IDN LUX PRT NZL GRC LVA ISL CHL
1995 2011
Moreover, competition effects are on average small compared to a change in the world demand for individual products. The negative effect of a one standard deviation decrease in world demand for a product exerts 6 times more pressure than a one standard deviation increase in the specialisation of the United States for that product. In short, specialising in what the world wants to buy is key for exports.
Despite the relative importance of world demand on average across all products and countries, competition effects may still be important in particular products at particular times, especially in markets that account for a large share of a country's exports or if a new competitor enters a product market suddenly with a large share. In addition, competition effects may be more permanent than fluctuations in world demand. Finally, losses in market share may be more noticeable now than in the pre-crisis period, as world trade is growing more slowly.
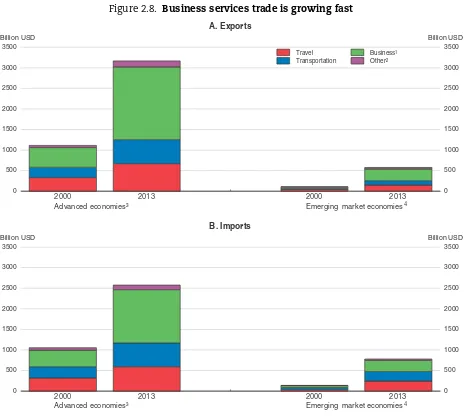
Trade in services has gained importance
While specialisation in goods has narrowed for advanced economies, specialisation in services has strengthened. Trade in services has been one of the most dynamic segments of global trade in the past two decades, and has proved resilient to the post-crisis trade slowdown (Figure 2.8; Ariu, 2016). In particular, business services have been the fastest growing segment of services exports since 2000. Advanced economies dominate global services trade overall, both as exporters and as importers, and have a strong competitive edge in business services. However, the capacity of emerging market economies to benefit from services trade opportunities has also grown over time. Their total exports of services have increased more than four-fold since 2000 and their business-services exports more than seven-fold, with India having emerged as a leader in the IT industry.
About three-quarters of the value of services traded consists of intermediate inputs that serve to coordinate value chains, support production processes and add value to products through quality differentiation and customisation (De Backer and Miroudot, 2013; Miroudot and Cadestin, 2017). Trade in services thus supports the competitiveness of the manufacturing sector in terms of price and quality, by providing access to cost-effective services inputs and by inducing local services suppliers to upgrade their efficiency (OECD, 2017d). In particular, the development of information and communication technologies has broadened the range of offshorable business services – from back-office functions to software development, legal review and other knowledge-intensive tasks.
Adding up the gains: Global trade integration has increased efficiency and welfare
Trade is associated with welfare gains for consumers
Changes in trade specialisations and patterns have brought many benefits. First, for consumers, the integration of emerging market economies, particularly in Asia, into the multilateral trading system has greatly reduced the prices of consumer goods, such as clothes, textiles and electronics in advanced economies (Figure 2.9). The benefit of lower consumer prices accrues disproportionately to low and middle-income groups who spend a larger share of their disposable income on standardised consumer items. Consumers have also benefited from the greater variety of goods and services available to them (Fajgelbaum and Kandhelwal, 2016; Bai and Stumpner, 2016; Broda and Weinstein, 2004).
Figure 2.8. Business services trade is growing fast
1. Business services include communication, computer and information services, financial and insurance services, royalties and license fees, and other business services.
2. Other services include construction, personal, cultural and recreational services, and government services. 3. OECD countries except Chile, Mexico and Turkey.
4. Include Brazil, Chile, China, India, Indonesia, Mexico, Russia, South Africa and Turkey. Source:WTO,Trade in Commercial Services; IMF Balance of Payments Manual, Fifth edition (BPM5).
1 2 http://dx.doi.org/10.1787/888933502465
Advanced economies³ Emerging market economies4
Travel
Trade is associated with productivity gains for firms
Trade has also boosted productivity through access to a wider variety of inputs, the diffusion of foreign knowledge from global frontier firms, and the larger market size that allows firms to take advantage of increasing returns (Box 2.4; Bas and Strauss-Kahn, 2015). A larger market size allows highly productive sectors to expand (McMillan and Rodrick, 2011). This is, for instance, the case for China, where openness to trade has expanded
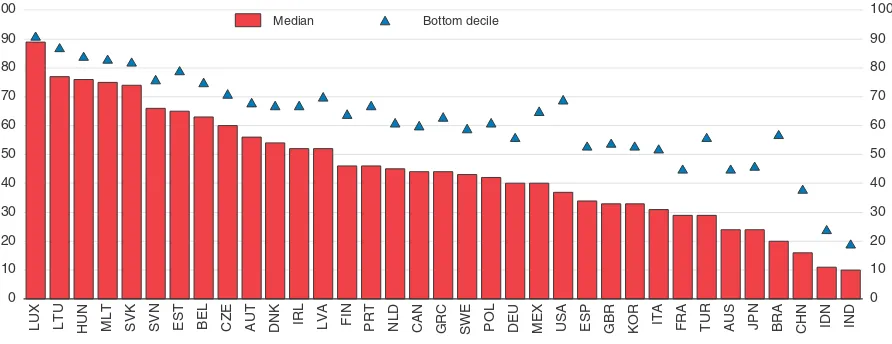
Figure 2.9. Real income gains from trade for the median and lowest income deciles1
1. Vertical axis indicates the decline in real income if no trade was taking place. For exemple, compared to existing trade patterns in the United Kingdom, the real income of the median household of the population would be 33% lower if no trade was taking place and the gap for the poorest 10% is higher at 54%.
Source:Fajgelbaum, P. and A. Kandhelwal (2016),”Measuring the Unequal Gains from Trade”,Quarterly Journal of Economics, Vol. 131.
1 2 http://dx.doi.org/10.1787/888933502484
0 10 20 30 40 50 60 70 80 90 100
0 10 20 30 40 50 60 70 80 90 100
LUX LTU HUN MLT SVK SVN EST BEL CZE AUT DNK IRL LVA FIN PRT NLD CAN GRC SWE POL DEU MEX USA ESP GBR KOR ITA FRA TUR AUS JPN BRA CHN IDN IND
Median Bottom decile
Box 2.4. The gains from trade
Productivity gains associated with trade occur through several channels:
● International division of labour: openness leads to specialisation in the production of goods and services for
which relative costs are the lowest.
● Competition from foreign firms: provides incentives for domestic firms, both exporters and those who serve
the domestic market, to produce more efficiently.
● Economies of scale:access to foreign markets enhances productivity and economic growth by allowing
firms to take advantage of increasing returns to scale.
● Transfers of technology:novel production techniques are more easily transferred across borders when
firms are internationally oriented, including through access to a wider variety of inputs.
Several factors shape the international distribution of the gains from trade:
● Increasing returns effect: different growth rates of productivity at the sectoral level imply that long-term
economy-wide productivity gains may vary depending on the sectoral specialisation of the country.
● Trade elasticity effect: countries that specialise in products with a growing share of expenditure (i.e. with
income elasticities above unity) will capture a larger share of trade.
● Terms of trade effect: the capacity to capture a larger share of world demand may have an effect on the
employment opportunities in highly productive, exporting firms in the manufacturing sector. Similarly, trade integration with Eastern European countries is estimated to have generated around 400 000 manufacturing jobs in Germany in 1988-2008 (Dauth et al., 2014). Openness has also strengthened overall efficiency by forcing the least productive firms to exit from the market (Andrews et al., 2015).
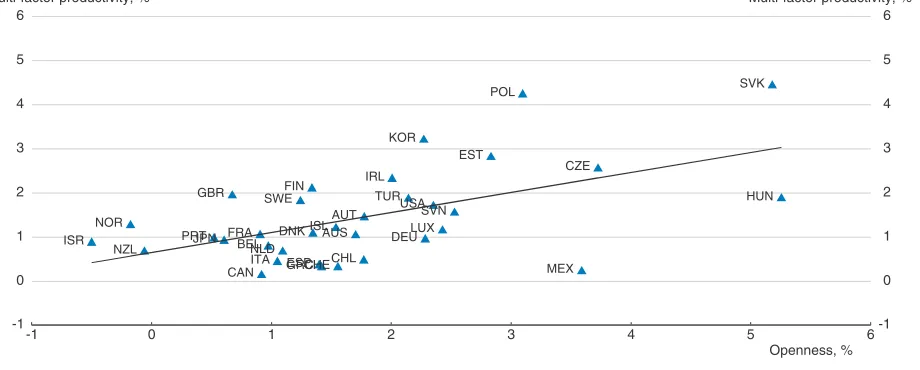
Stronger increases in openness tend to be associated with higher multi-factor productivity growth (Figure 2.10). Recent OECD estimates suggest that a 1 percentage point rise in trade openness (as measured by the ratio of export plus import volumes to GDP), raises multi-factor productivity growth by 0.2% after 5 years and by 0.6% in the long run (Égert and Gal, 2017; Figure 2.10). This positive effect is in line with previous empirical studies (Frankel and Romer, 1999; Newfarmer and Sztajerowska, 2012).
Another source of economic efficiency comes from the reorganisation of the production process at the world level through global value chains (GVCs) and the important rise of offshoring since the mid-1990s (Figure 2.11; Timmer et al., 2014). Technological change in the form of increased use of IT has sharply decreased the cost of transmitting information across borders; and technological change in terms of shipping (containers, for example) has reduced the cost of trading physical goods. Together with a reduction in trade barriers, these factors have allowed production stages to be split across borders in global value chains (Baldwin, 2012; 2016). However, integration along global value chains appears to have slowed or even reversed in recent years (Timmer et al., 2016; Haugh et al., 2016).
Offshoring allows firms and economies to specialise in the stage of the production process in which they are relatively better at, using intermediate goods from other countries without having to develop a whole domestic supply chain from scratch. In this way, efficiency gains associated with specialisation are amplified (Feenstra and Hanson, 1995). Over the period 1995-2011, the countries which have experienced the largest increase in participation in GVCs have also had stronger productivity growth. The
Figure 2.10. Productivity gains and openness1
Average annual growth rates, 1985-2011
1. Openness is measured as the ratio of export plus import volumes to GDP.
Source:Égert, B. (2017), “Regulation, Institutions and Productivity: New Macroeconomic Evidence from OECD Countries”,OECD Economics Department Working Papers, forthcoming, OECD Publishing, Paris; and OECD calculations.
estimated effect over this period ranges from 0.8 percentage point to 2.2 percentage points in industries which offer more opportunities for production fragmentation (OECD, 2017c).
Adding up the costs: Trade has accentuated technology-driven trends toward
higher inequality
Rising trade integration has coincided with a significant change in income inequality. By changing specialisation and modifying the demand for labour, trade can affect the relative price of production factors and hence potentially have a direct impact on the income distribution. However, as the trends of rising inequality, trade integration and technological change have occurred simultaneously, it is difficult to untangle their different impacts.
The evidence on the link between growing income inequalities and increased trade integration is mixed. During the 1990s, the impact of trade on labour markets was limited due to low trade intensity, especially with emerging market economies (Krugman, 1995). The increasing importance of emerging market economies in world markets, and more particularly the rising participation of China and India, which account for more than one-third of the world labour force, suggests that the impact may have become stronger after the 1990s (see figures in Box 2.1; Krugman, 2008). However, at the macroeconomic level, the link between income inequality and trade integration still appears to be weak (OECD, 2011) and, overall, technological change appears to be the main driver of increased income inequality (Helpman, 2016).
Despite inconclusive results at the macroeconomic level, trade can still have an important impact on the earnings of some groups of workers. For example, as discussed below, recent research on the effect of import competition from low wage countries at the regional level finds a negative impact on wages in some regions (Autor et al., 2013). There are also indications that trade has had an impact on the labour share in some OECD
Figure 2.11. Global value chains have expanded markedly since 1990
Structural GVC indicator
1. The structural GVC indicator is computed as the ratio of intermediate goods imports to final domestic demand corrected for commodity price and cyclical effects. For further details, see Haugh, D., A. Kopoin, E. Rusticelli , D. Turner and R. Dutu (2016), “Cardiac Arrest or Dizzy Spell: Why is World Trade So Weak and What can Policy Do About It?”,OECD Economic Policy Papers, No. 18., OECD Publishing, Paris.
Source:OECD STAN Bilateral Trade database by industry and end-use category; OECD Economic Outlook 99 database; and OECD calculations.
1 2 http://dx.doi.org/10.1787/888933502522
1990 1992 1994 1996 1998 2000 2002 2004 2006 2008 2010 2012 2014
100 150 200 250 300 350
Index 1990 = 100
countries. It may have accentuated technology-driven inequality by its effect on productivity at the firm level and by changing the demand for some skills, further increasing the polarisation of labour markets.
Labour markets have polarised
In OECD countries, the share of middle-skilled workers in total employment has declined by more than 7.5 percentage points since 1995 (Figure 2.12). The extent of the polarisation has varied across countries. Untangling the effects of technical progress and trade is difficult. Technology is an important driver of polarisation. Routine jobs, which are characterised by mechanistic tasks and which are generally undertaken by middle-skilled workers, are indeed more likely to be automatised. Technological progress is also associated with an upskilling of workers, which tends to increase the share of high-skilled workers. At the same time, globalisation is associated with integration in global value chains and the offshoring of parts of the production process (Breemersch et al., 2017; Goos et al., 2014). In addition, import competition from low wage countries contributes to the decline of manufacturing jobs which require more middle-level skills. Recent OECD research finds that technology has been the most important factor explaining job polarisation, while trade has had a limited effect (OECD, 2017d). Other studies point to the importance of the offshoring of routine jobs (Ebeinstein et al., 2014; Keller and Utar, 2016). However, while there is a positive and significant correlation between the offshoring of inputs and the level of employment of routine-intensive workers in manufacturing industries, this is not the case for offshoring of final assembly (Marcolin et al., 2016). Overall, the literature is broadly inconclusive and points to the complexity of the relationship between offshoring and polarisation (Marcolin et al., 2016; OECD, 2017d).
The impact of offshoring on inequality is complex as it depends on the composition of the workforce and the type of offshoring (Hijzen and Swaim, 2007; Sourdin et al., 2013). There is some indication that offshoring of low-skilled activities may reduce inequality by boosting the productivity of firms, which in turn contributes to raising wages of
Figure 2.12. Labour markets have polarised across occupations
Percentage point change in employment shares by occupation between 2002 and 2015
Note:OECD estimates based on EU-LFS, Japanese Labour Force Survey, and the BLS Current Population Survey. Source:Eurostat; Statistics Bureau Japan; US Bureau of Labour Statistics; and OECD calculations.
1 2 http://dx.doi.org/10.1787/888933502541
-6 -4 -2 0 2 4 6 % pts
High Medium Medium Low
non-routine routine
European Union
High Medium Medium Low
non-routine routine
Japan
-6
-4 -2 0 2 4 6 % pts
High Medium Medium Low
non-routine routine
non-displaced low-skilled workers. By contrast, the offshoring of high-skilled tasks tends to accentuate inequality as it boosts the relative productivity of high-skilled workers and hence wage gaps (Lopez-Gonzalez et al., 2015). In addition, even though the impact on employment and wages may be positive for some segments of the production process, challenges remain for individual workers, as those who benefit from new jobs created may be different from those workers who lose their jobs or suffer lower wages due to offshoring. Offshoring of services tends to accentuate wage inequality by raising the productivity and wages of skilled workers, while putting downward pressure on demand for low and medium-skilled workers (Crinó, 2012; Geishecker and Görg, 2013). However, available evidence suggests that the job dislocation linked to service imports may be less severe than for manufacturing, as advanced economies retain a competitive edge in providing sophisticated services. Even so, many displaced workers can only find lower-paying jobs (Liu and Trefler, 2011). These results suggest that more research is needed to make an assessment regarding the global impact of offshoring of services. More detailed investigation in terms of occupations and types of offshoring would help.
Productivity and wage disparities have increased
Trade has also an effect on wage dispersion through its impact on firms’ productivity. Recent OECD estimates suggest that import competition tends to increase wage disparities across firms and strengthen the link between productivity and wage dispersion (Berlingieri et al., 2017; Figure 2.13). Only the most productive firms export but trade also has an effect on productivity via a larger market (see Box 2.4). Exporting firms tend to upgrade the skills of their workers and can offer higher wages (Schank et al., 2007). This could be because more productive firms appear more selective in their hiring than non-exporters (Helpman et al., 2010). Exporting firms tend also to be larger and to have more resources devoted to training and mobility, perhaps because such firms are at the technological frontier and use more advanced technologies. Both effects increase productivity and demand for high-skilled
Figure 2.13. Wage dispersion is correlated with productivity dispersion
1. Frontier firms are the 5% of firms with the highest labour productivity by year and sector. Industries included are manufacturing and business services, excluding the financial sector, for firms with at least 20 employees.
Source:Andrews, D., C. Criscuolo, and P. Gal (2016), “The Best versus the Rest: The Global Productivity Slowdown, Divergence across Firms and the Role of Public Policy”,OECD Productivity Working Papers, No. 05, OECD Publishing, Paris; Orbis data of Bureau van Dijk; and OECD calculations.
1 2 http://dx.doi.org/10.1787/888933502560
2002 2004 2006 2008 2010 2012
90 100 110 120 130 140
Index 2001 = 100
Frontier firms (top 5%)¹ Non-frontier firms
A. Labour productivity
2002 2004 2006 2008 2010 2012 90
100 110 120 130 140 Index 2001 = 100
Frontier firms (top 5%)¹ Non-frontier firms
workers in exporting firms. Import competition can also provide incentives for the most productive firms to innovate, which potentially raises firms’ productivity and thereby impacts on wage dispersion. Evidence of such effects is found for UK firms over the period 2000-2007 (Bloom et al., 2016) and for the Mexican manufacturing sector (Verhoogen, 2008).
The labour share has declined
The decline of the aggregate labour share observed in some countries is another source of concern, though there are important differences across countries. Since 1995, the labour share has declined by 14.2 percentage points in Poland and increased by 3.6 percentage points in Sweden, and the size of the decline depends on the sectors included (Schwellnus et al., 2017; Figure 2.14, Panel A). Recent evidence points to a role for trade
Figure 2.14. Trade has contributed to a lower labour share
1. Labour shares excluding primary, housing and non-market sectors. Dotted line without Korea.
Source:Schwellnus, C., A. Kappeler and P. Pionnier (2017), “Decoupling of Wages From Productivity: Macro-level Facts”,OECD Economics Department Working Papers, No. 1373, OECD Publishing, Paris.
1 2 http://dx.doi.org/10.1787/888933502579 1996 1998 2000 2002 2004 2006 2008 2010 2012
100
A. Macro-level decoupling reflects declines in labour shares and increases in wage inequality
Total economy
Labour share Wage inequality
Productivity Real average compensation
1996 1998 2000 2002 2004 2006 2008 2010 2012 100
105
Excl. Primary, housing and non-market sectors
Real median compensation
Change in labour share (1995-2011), % pts
-20 Change in labour share (1995-2011), % pts
AUS
Change in value added imports from China (1995-2011), % pts
(Figure 2.14, Panel B). Also, the offshoring of low productivity jobs to low wage countries may have pushed down the labour share if firms refocus their resources on highly productive activities and substitute low-skilled workers for capital. This is in line with previous evidence on offshoring and with the evidence for the United States that manufacturing sectors where jobs are more likely to be offshored have experienced stronger declines in the labour share (Feenstra and Hanson, 1995; Elsby et al., 2013).
Here again, however, it is difficult to untangle the effects of trade, technology and policy in explaining the decline in the labour share. Trade integration may, for instance, have contributed to the decline by allowing a “winner takes most dynamic” and growing market concentration in a range of sectors with the consequence of a higher profit share (Autor et al., 2017). Regulation that protects incumbents, lack of a robust competition policy and aggressive tax planning can all increase profits when there is growing market concentration. Similarly, technological progress reduces the relative price of capital goods and provides an incentive for firms to substitute capital for labour and to offshore some activities (Karabarbounis and Neiman, 2013).
Focusing on the costs: Regional adjustment to import competition, changing
tastes and technology
In most OECD countries, the regional concentration of employment in the manufacturing sector is typically much higher than in service sectors (Figure 2.15). More disaggregated country-specific evidence confirms that manufacturing industries – in particular the manufacture of motor vehicles, ships and boats, and aircraft as well as pharmaceuticals and chemicals – tend to display high levels of geographical employment concentration. In contrast, industries which have an advantage from being close to the population they serve – such as retail services, restaurants, education and social work – are
Figure 2.15. Employment in manufacturing is more regionally concentrated than in services
Geographic concentration index¹, average 2000-2015
1. The Geographic concentration index measures the extent to which an activity is concentrated in particular regions, varying between 0 (no concentration) and 1 (maximum concentration).
2. Includes distributive trade, repairs, transportation and storage, accommodation and food service activities. 3. Includes public administration, compulsory social security, education, human health and social work activities.
Source: OECD calculations. For details of the calculations, see OECD (2003),Geographic Concentration and Territorial Disparity in OECD Countries, OECD Publishing, Paris.
1 2 http://dx.doi.org/10.1787/888933502598
0.00
0.05 0.10 0.15 0.20 0.25
Concentration index
0.00 0.05 0.10 0.15 0.20 0.25 Concentration index
TUR ITA PRT ESP ISL NOR DNK MEX ISR USA BEL NLD AUT HUN JPN SWE CAN CHL SVN GRC GBR FIN CZE SVK POL KOR AUS IRL
more geographically dispersed (Campos, 2012; OECD, 2016b). Moreover, evidence for the United States also suggests that manufacturing industries that are intensively involved in international trade are significantly more geographically concentrated than manufacturing industries with less involvement in trade (Shelburne and Bednarzik, 1993). The regional concentration of manufacturing employment means that sector-specific shocks to manufacturing, whether originating from changes in trade, tastes, or technology, may have a substantial regional impact even if their overall macroeconomic effect on the national economy is modest.
Due to the geographical concentration of import-competing manufacturing activities, as well as the concentrated consequences of changing tastes and technology, along with the dependence of some regions, particularly those outside large cities, on those particular activities, there can be serious manufacturing employment consequences at the regional level. Recent studies analysing the regional dimension of import penetration (Autor et al., 2013; 2016) suggest that about a quarter of the decline in US manufacturing employment between 2000 and 2007 is due to Chinese import penetration. These estimates imply Chinese import competition resulted in a net reduction in US manufacturing employment of around 950 000. While this had significant and serious consequences at the personal and regional levels, the effect is relatively modest in a national macroeconomic context when, according to the US Bureau of Labour Statistics, there were on average around 1.9 million involuntary separationsper monthover this period. Similar qualitative results have been found in other OECD countries, notably in Spain (Donoso et al., 2015) and Germany (Dauth et al., 2014; 2017).
The creation of jobs in expanding activities to compensate for losses in other activities, whether from trade, technology, or tastes, is key to adjust to structural change. However, regions that experience a greater decline in the manufacturing employment rate than the national average also tend to suffer a greater fall in total employment than the national average (Figure 2.16, Panel A; Annex 2.3). In more than half the countries analysed by Rusticelli et al. (2017), changes in manufacturing employment are more strongly correlated with total regional employment than are changes in employment in other sectors of a similar size. In other words, when a shock hits manufacturing firms in regions, other jobs do not seem to fill the gap. That said, the size and strength of this positive correlation does vary markedly across countries.
The relationship between total employment and the fall in manufacturing employment in regions could suggest either that the re-employment prospects of displaced manufacturing workers are lower than for those displaced from other sectors, or that the adverse knock-on multiplier effects are greater. Recent OECD analysis finds that regional adjustment to shocks depends on the concentration of activities at the local level: greater diversity of activities tends to shelter urban areas from adverse employment consequences from international competition and the pressure of technological change. In contrast, rural areas appear less diversified and tend to specialise in primary goods and low-quality manufacturing, which have been hardest hit by trade shocks (OECD, 2016b).
2014; Kletzer, 2001). Also, recent research finds that import competition in France had a significant effect on local labour markets through lower wages (Malgouyres, 2016).
Fewer manufacturing jobs, and lower regional employment and wages, due to stronger import competition, limited sectoral diversity and changes to tastes and technology, are associated with greater inequality between average incomes in different regions (Figure 2.17). The relatively lower increase in income inequality in some countries, such as Sweden and Finland, despite the substantial decline in manufacturing jobs, points to the importance of country-specific institutions and policies to deal with the displacement of workers in manufacturing.
Figure 2.16. The decline in manufacturing is associated with lower employment and lower wages
1. Sample restricted to countries with 15 or more regions, covering the period from 2000 to the latest available date. For the statistical significance of the correlation coefficients, see Annex 2.3.
2. This chart shows the correlation between the change in regional manufacturing employment rates and average market and disposable income per worker where disposable income= Market income – taxes + transfers and market income includes both labour and capital income.
Source:OECD Regional database; and OECD calculations.
1 2 http://dx.doi.org/10.1787/888933502617
HUN POL SWE KOR PRT FIN AUT TUR DEU ITA USA GBR NOR ESP MEX A. Correlation of the change in regional manufacturing and total employment rates since 2000¹
DEU USA POL ITA ESP
Market Disposable
Policies to boost regional resilience
The need for an integrated approach
Economic disruptions related to trade, technology and tastes call for an integrated approach combining actions at the international, national and sub-national levels (OECD, 2017f). Regions and workers more exposed to changes in trade, technology and tastes can face large adjustment challenges and long-lasting costs. An appropriate policy response should therefore combine national levers with more granular approaches. Coordination and coherence between different policy areas are crucial. While further investigations are needed to identify in more detail where the costs are concentrated and the efficient policies to deal with them, the analysis above and international experience already suggest directions for action.
First, efforts should be made to enhance the productivity and employment capacities of regions that are lagging behind the most productive regions in the country. In particular, policies should be put in place to reinforce their comparative advantage as well as the link between rural and urban areas. The regional dimension of policy packages should be more systematically assessed.
Second, national policies are key to protect workers in case of shocks and to equip them with the means to succeed in an open and changing world. This requires helping workers move from jobs in declining sectors to jobs in expanding sectors. This can be best achieved through activation measures, education and training, and by facilitating labour mobility. Redistributive policies play a role in compensating those who are still left behind (Causa and Hermansen, 2017).
Finally, domestic policy should be complemented by international agreements that help level the playing field and improve inclusiveness. This requires, in particular,
Figure 2.17. A decline in manufacturing employment rates is associated
with an increase in income inequality across regions
P90/P50 ratio, 2000 until latest available date
1. The chart shows the change in the national manufacturing employment rate versus the change in the dispersion of average regional income as measured by the P90/P50 ratio, i.e. the change in the ratio of the region with average income at the 90th percentile to the region with average income at the 50th percentile.
Source:OECD Regional database; and OECD calculations.
1 2 http://dx.doi.org/10.1787/888933502636
Percentage point changes in inequality ratio¹ P90/P50 on primary income
-10
improving standards in the labour market or environmental areas. This also calls for more international collaboration on competition, SOEs, business accountability, corruption, illicit trade, and investment policy. Those issues are not discussed here but are examined in detail in other recent OECD publications (OECD, 2017b; 2017f).
Increasing regional mobility
Greater mobility of workers could help regions adjusting to shocks, with people moving to where jobs are available. There is evidence of some adjustment of this kind in Korea, the United States and Germany. However, this adjustment is only partial, with a significant proportion of the unemployed only seeking employment in the region in which they currently reside (Autor et al., 2016). In other countries, insufficient migration from weaker to better performing regions implies that migration does not appear to be helping to disperse localised shocks to labour markets (Figure 2.18). In addition, the least educated workers tend to be the least mobile, which hinders adjustment in regions with a high share of low-skilled labour (OECD, 2005). Strengthening geographic mobility would potentially improve job opportunities for job seekers and would also increase productivity by reducing skills mismatch (Andrews et al., 2015).
Housing policy reforms can help to stimulate labour mobility. Providing housing allowances to displaced low-wage workers, who would otherwise be unable to move to areas where property prices are high, may encourage mobility from regions hit by shocks. Similarly, making the allocation of public housing more responsive to the needs of people moving from areas in decline would help the adjustment process. Reducing constraints on the development of private rental markets, including by reducing the tax bias towards owner-occupied housing, would also encourage labour mobility. Reducing transaction costs would also help to support the mobility of home owners, especially in countries where the share of homeownership is high (Caldera-Sánchez and Andrews, 2011). This could be achieved by promoting competition among intermediaries involved in housing
Figure 2.18. Correlation between the change in the regional total employment rate
and the change in the net inter-regional immigration rate since 2000¹
1. Sample restricted to countries with 15 regions or more, covering periods from 2000 to the latest available date. For the statistical significance of the correlation coefficients, see Annex 2.3.
Source:OECD Regional database; and OECD calculations.
1 2 http://dx.doi.org/10.1787/888933502655
KOR USA DEU POL TUR ESP ITA
-0.8 -0.6 -0.4 -0.2 0.0 0.2 0.4 0.6 0.8
-0.8 -0.6 -0.4 -0.2 0.0 0.2 0.4 0.6 0.8
transactions. Finally, providing workers with subsidies to cover the costs of relocating can be a cost-effective way to enhance labour mobility. For instance, in Germany workers participating in the relocation subsidy programme are matched with higher paying and more stable jobs than non-participants (Caliendo et al., 2017). However, policies supporting mobility need to be weighed against the loss of positive externalities that are present in the region, as it might be less costly to support local restructuring, building on existing social and economic networks.
Policies to stimulate geographic mobility are multidimensional. Housing policy should be complemented by good transport infrastructure to connect workers with high-density areas where more jobs are created and connect firms with larger markets. Specific attention should be given to connecting disadvantaged groups and regions. Other potential options to boost mobility include the provision of public services. The quality and the cost of education, for instance, may be an important determinant of the decision to move from one region to another. Access to childcare is another important determinant of geographical mobility, as in many countries workers have to rely on the help from their family when childcare provision is insufficiently developed.
Seizing the benefits from GVCs at the regional level
Trade exposure brings vulnerabilities as discussed above, but also opportunities. Across countries the most productive firms tend to be internationally oriented, operating in different countries and engaging in international trade, often through participation in global value chains (Onodera, 2008). Linkages with the global economy appear important for regions to catch up. A significant share of the economy of many catching-up regions is in manufactured goods, mining or services that can be traded internationally (OECD, 2016b). Indeed, greater integration of regional economies into global value chains (GVCs) appears to contribute positively to the development of regional employment. In particular, regression analysis using data for 170 European regions over 2000 to 2010 reveals that stronger involvement in GVCs, as measured by the region's share of global value added, is significantly associated with an expansion of the regional manufacturing employment rate (Rusticelli et al., 2017; Figure 2.19).
Building on local competitive advantages to benefit from national and global knowledge diffusion is key if regions are to seize the benefits from trade. In cities, sustained productivity growth critically depends on exploiting agglomeration economies in high-end tradable services, in particular though adequate coordination of transportation, housing and spatial planning. In less dense areas, rural development policies should go beyond agriculture and be better targeted to build on local assets. “Smart specialisation” requires actively engaging different levels of government, as well as private-sector actors, to identify local strengths and target efforts to incentivise innovation, investments and skill acquisition.