M – 32
According to Indonesia Demographic and Health Survey (IDHS) data, the highest child mortality occurred during the first year of age of infant. Infant mortality is an important indicator that must to be monitored seriously. The mortality is associated with several determinants, such as the infant’s characteristics, maternal and fertility factors, housing condition, and also geographical area. The aim of this research is to develop models that can be used to explain the effects of explanatory variables on infant mortality in Indonesia. It is also the aim of this research to develop a thematic map describing the distribution pattern of infant mortality probabilities at district level across the country. The response variable is a binary categorical variable with two outcomes, success and failure. The outcome is success if the infant died before achieving one year of age, and failed if the infant is still alive after one year of age. Modeling is using Logistic Regression model and Autologistics Regression model. The results showed that the Autologistics Regression model fitted the data reasonably well, all of the explanatory variable affect infant mortality, except infant’s sex. The results also showed that the probabiity of infant mortality was higher in Kalimantan island and Papua island.
Keyword : Infant, mortality, autologistic, binary, IDHS
Introduction
The death of a child is a great loss to both family and country. According to Indonesian Bureau of Statistics (BPS), Indonesia's infant mortality rate in 2012 was 40 deaths per 1,000 births. One in every 31 children died before their first birthday, and one in every 28 children died between one and five years. Eighty percent of infant mortality occured for children under one year (BPS et al. 2013). High infant mortality rate caused the government setting the infant mortality as a should be monitored indicator. Infant mortality is multidimensionally case because it relates to many things such as characteristics of the infant, mother, home, and also geographical area. To reduce the infant mortality an effective program based on accurate statistical data with accurate and authentical methods is required. The development of models can be carried out by making the infant mortality as a binary variable which have two outcomes, success or a failure. The outcome is success if the infant died before achieving one year of age, and failed if the infant is still alive after one year of age. The explanatory variables are socio demographic variables and the appropriate model is the logistic regression model.
The research questions are the following: (a) how is the distribution pattern of infant mortality?; (b) what variables affect infant mortality in Indonesia?; (c) are neighborhoods areas affect it?; (d) and how is the infant mortality modeling based on variables that affect it?
In this research, our aim is to develop models for infant mortality and mapping its distribution pattern across Indonesia. There are two expected outcomes i.e the mortality rate models and thematic maps related to mortality rates.
Research Methods Data
The data were from the 2012 Indonesia Demographic and Health Survey (IDHS) conducted by Indonesian Bureau of Statistics (BPS). The 2012 IDHS interviewed a representative sample of 45.607 women aged 15-49 years. A three-stage-sampling design was implemented to collect the data.The data were realized through a questionnaire that included questions on marriage and reproductive histories, of which detailed dates of birth of all women and their children were collected. Women were asked histories of all births they ever had. Survival time of each child was then computed in months. All children whose survival time was less than 1 year were classified as infant deaths. The number of infant deaths counted by district. Covariates considered were biodemographic variables including the sex of the child and birth order. Socio-economic variables included in the analysis were mother’s education, mother’s age at delivery, and wealth index. All of covariates were counted by district then became the percentage of female infants, the percentage of infants order more than four, the percentage of mother who have not finished education in senior high school, the average of mother’s age at delivery, and the percentage of poor family. All the above were modelled as categorical variables. Further, continuous covariates considered were the average of mother’s age at delivery. For spatial covariates, we used districts as geographical units of analysis.
There were 466 district with number of women whom interviewed was 45.607 women. Complete data was available for 83.650 birth history. A total of 4739 children died before first birthday.
Statistical Modelling
We describe the spatial variables by two nearest neighbor based on the distance betwen two district. The response, y, was direct estimation of probabity of infant mortality in each district in Indonesia. Then, y is a binomial variable with expected probability of dying equal to p. This can be modelled through the logistic regression model. In the standard logistic model for binary data, the log odds of infant mortality are modeled as a linear function of some regressor variables, .... :
log = + ∑ (1)
where p is the probability of infant mortality being present, is intercept, is slope for each explanatory X.
The autologistic model is an extended of ordinary logistic regression model. The autologistic model incorporates the spatial autocorrelation by conditioning the probability of occurrence of infant mortality in one area on probability of occurence infant mortality in neighbor area. The definition of neighbor in this paper is two nearest area depend on distance.
log = + ∑ + log + log (2)
The influence of neighborhood described by the autoregressive coefficient and . If and are not significant, then infant mortality in an area does not affected by infant mortality in nearest area and better to use ordinary logistic regression. Testing hypotheses about the slope can performed by Wald test such as testing hypothesis on ordinary logistic regression. Modelling and testing hypothesis are done using Minitab.
Explanatory Variables
There are 7 explanatory included in model.
Table 1.Variables included in Model
Variables Type
Y The infant died before the first birday Categoric (1=Yes, 0=No) X1 Persentage of infant whose birth order >4 Numerik
X2 Persentage of female infant Numerik
X3 Persentage of mothers haven't finished senior
high school Numerik
X4 Average of mother's age at delivery Numerik
X5 Persentage of household with wealth index
middle or lower Numerik
X6 Log odds of probability of infant mortality in first
nearest neighbor Numerik
X7 Log odds of probability of infant mortality in
second nearest neighbor Numerik
Based on Table 1, the model will be developed is
log = + + + + + + + (3)
Result
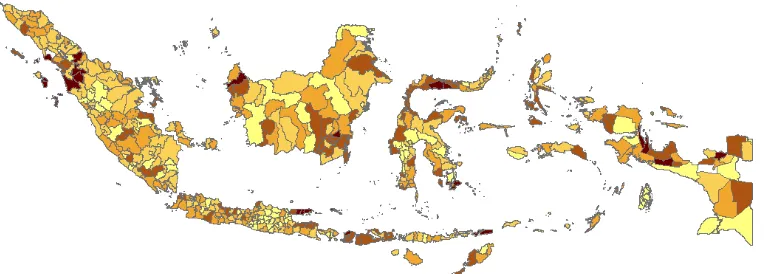
The probability of infant mortality that compute by direct estimation is shown in figure 1. The darkest colour describe the higher probability. Area with same color are exist in same probability range. Overall, the pattern look uniform. There are dark area and light area in each big island.
Based on the p-value of each variable, we conclude that all of the covariates are affect significantly the infant mortality except the infant’s sex. The percentage of infant’s birth order more than four, the percentage of mother who have not finished education in senior high school, the average of mother’s age at delivery, and the percentage of poor family in an area are associated with probability of infant mortality.
The significance of geographical effects are shown in p-value of X6 and X7. It means that infant mortality in one area affected by the infant mortality in its neighboor.
Table 2.P-value of each Variables
Based on the Deviance R square adjusted in Table 3., logistics model has deviance R-sq (adj) = 43,57% while autologistics model has deviance R-sq (adj) = 45,85, suggesting that autologistics model is better than ordinary logistics model. Based on the AIC, logistics model has AIC = 35459,92 while autologistics model has AIC=35629,09, suggestinng that the ordinary logistics model is better than the autologistics model.
Tabel 3.
Comparison Betwen Ordinary Logistics Regression And Autologistics Regression
Logistics Regression Autologistics Regression
Deviance R-Sq 43,82 % 46,26 %
Deviance R-Sq (adj) 43,57 % 45,85 %
AIC 35459,92 35629,09
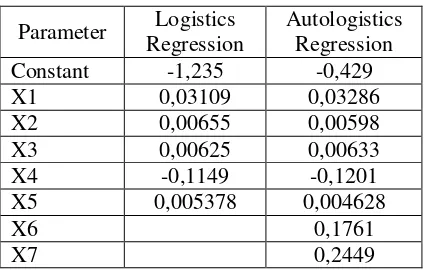
The sign of slope indicates that all of the covariates have a positif relationship to infant mortality except mother’s age. If the average of mother’s age are increase, then the probability of infant mortality will decrase. The two-highest slope is for X6 and X7.
Based on Table 5, the developed autologistics model is :
log = −0,429 + 0,03286 + 0,00598 + 0,00633 −0,12010 +
0,00463 + 0,1761 + 0,2449 (4)
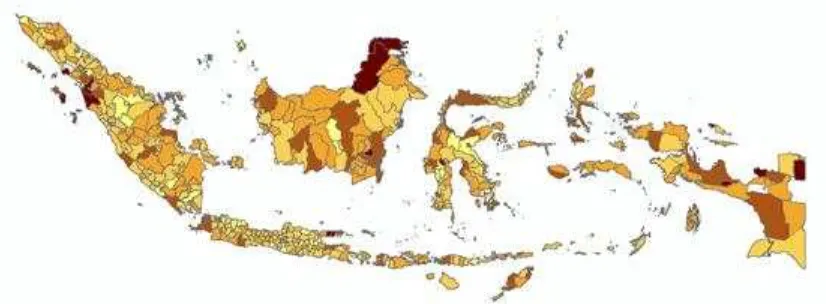
The figure 2. shows the distribution of infant mortality’s probability estimation entire Indonesia. The darkest colour describe the higher probability. Area with same color are exist in same probability range. Overall, the lowest probability predicted occured in many district located in Java island, and the higest probability predicted occured in Kalimantan and Papua Island.
Figure 2. Thematic map of infant mortality’s probability estimation by modelling
Discussion
The autologistics model offer a flexible approach to quantifying small-scale geographical variability in infant mortality problems, although the AIC is lower than logistics model. These model can be extended to more complicated data structures, for example models with zero inflated logistics regression. For future research, we may carry out a more explicit comparison between autologistics model and zero inflated autologistics model, or modelling it with Generalized Linear Mixed Model (GLMM) approach .
The research used ata from 2012 IDHS. This could be a major limitation considering birth history of interviewed women are noted from 1972 to 2012. The memory of long time age event is very limited. And the wealth index of a household could change over time.
References
Afri, Lusi Eka. 2012. Geographically weighted Negative Binomial Regression for Data of Infant Mortality (Case Study 38 District/City in East Java) [tesis]. Bogor: Institut Pertanian Bogor.
Baecke P, Poel DV. 2013. The Value of Neighborhood Information in Prospect Selection Models Investigating the Optimal Level of Granularity. SAS Global Forum. Paper 492 Chirwa TF, Mantempa JN, Kinziunga FL, Kandala JD, Kandala NB. 2013. An exploratory
spatial analysis of geographical inequalities of birth intervals among young women in the Democratic Republic of Congo (DRC): a cross-sectional study. BioMedCentral Pregnancy Childbirth. 2014; 14(1): 271.
Gumpertz ML, Graham JM, Ristaino JB. 1997 Autologistic Model of Spatial Pattern of Phytophthora Epidemic in Bell Pepper: Effects of Soil Variables on Disease Presence.
Hox, J. (2002). Multilevel Analysis: Techniques and Applications. New York: Taylor & Francis Group.
Kazembe LN, Mpeketula PMG. 2010. Quantifying Spatial Disparities in Neonatal Mortality Using a Structured Additive Regression Model. PLoS ONE 5(6):e11180.
Parwoto. 2012. Regresi Multilevel Zero Inflated Poisson Untuk Pemodelan Data Respon Count (Studi Kasus: Kejadian Kematian Bayi di Propinsi Jawa Barat) [tesis]. Bandung: Universitas Padjajaran.
Pramono MS, Aditie NB, Sutikno. 2012. Regresi Spasial Durbin Model Untuk Mengidentifikasi Faktor yang Berpengaruh Pada Angka Kematian Bayi di Jawa Timur. Buletin Penelitian Kesehatan, Vol. 40, No. 4, 2012: 190 – 200.