Continuous Parenteral Nutrition to Reduce Pneumonia:
Its Effects on Severe Head Injury Patients
in Hasan Sadikin Hospital Bandung, Indonesia
Farid Yudoyono, Muhammad Z. Arifin
Department of Neurosurgery, Faculty of Medicine,
Universitas Padjadjaran – Dr. Hasan Sadikin Hospital,
Jl. Pasteur No. 38 Bandung 40161 Indonesia
Abstract
JKM. Vol.11 No.1 Juli 2011:1-16
Efek Pemberian Nutrisi Parentral pada Pasien Cedera Kepala Berat
dalam Menurunkan Terjadinya Pneumonia di
Rumah Sakit Hasan Sadikin, Bandung, Indonesia
Abstrak
Tujuan dari studi ini adalah untuk membandingkan efek dari pemberian terapi enteral-, standard- dan continous-parenteral nutrition untuk mengurangi insidensi pneumonia pada cedera kepala berat (CKB). Kami menggunakan terapi nutrisi ini sebagai salah satu pengobatan pada CKB untuk mencegah pneumonia. Dua puluh satu pasien cedera kepala dengan skor GCS 4-8 yang datang dalam 24 jam setelah kecelakaan secara acak diberikan total parenteral nutrition continous (TPNC) selama 24 jam/nonstop, total parenteral nutrition standard (TPNS) dan nutrisi entral (EN), Maret-Mei 2011. Pasien diikuti hingga 2 minggu setelah cedera. Pneumonia dinilai secara klinis, laboratoris dan radiologis; dengan insidensinya yang sangat berbeda secara signifikan antar perlakuan (p<0,05). Perubahan GCS antar grup berbeda signifikan; parameter pengukuran nutrisi seperti antropometri tidak terdapat perbedaan; total lymphocyte count meningkat secara signifikan pada TPNC grup; albumin meningkat signifikan dalam hari ke 7 dan 14 setelah cedera pada TPNC grup (p<0,05). Absolute lymphocyte count meningkat signifikan pada hari ke 7 dan 14 setelah cedera pada TPNC grup (p<0,05). Insiden pneumonia menurun signifikan pada TPNC grup (p<0,05). Kalori dan protein yang diberikan melalui TPNC dalam 24 jam/nonstop dapat diberikan pada CKB lebih baik dari pemberian dengan EN melalui rute nasogastrik. Penyembuhan neurologis CKB lebih cepat pada pasien dengan dukungan nutrisi yang lebih awal dan lebih baik terutama pada TPNC grup.
Kata kunci: cedera kepala, nutrisi, pneumonia, penilaian pemberian nutrisi
Introduction
Traumatic brain injury remains a highly lethal injury with mortality ranging from 20 to 50%; approximately 52.000 patients die each year from Traumatic Brain Injury (TBI) with 85% of the death happening within the first two weeks. TBI Pharmaceutical trials have failed to demonstrate any efficacy in reducing death.1-4
Currently the metabolic status and nutritional needs of TBI patients are less of a priority than maintaining cerebral perfusion. However, TBI research shows hypermetabolic and hypercatabolic state
been published yet. Consequently, we are reporting the results of a prospective randomized study to determine the
effect of nutritional support as continuous parenteral nutrition on incidence of pneumonia on SHI patients. effect of nutritional support as
continuous parenteral nutrition on incidence of pneumonia on SHI patients.
Materials and Methods
Patients, population and cinical therapy
A total of 21 consecutive SHI patients with a Glasgow Coma Scale (GCS) score of 4 to 8 during the first 24 hours after admission were divided into three groups. The first was the total parenteral nutrition continuous group for 24 hours non stop (TPNC), the second was the total parenteral nutrition standard (TPNS) group, which was infused three times a day, and the third was enteral group, which was fed with enteral nutrition six to eight times a day via nasogastric tube. The nutritional data were collected until the patients’ death or for 14 days after injury. The major criterion for inclusion was that the primary site of the injury was the brain. Nine patients were excluded for the above reasons, because of extracranial
patients was treated with corticosteroid therapy. Phenytoin was given only if seizures occurred.
For nutritional support, each patient was randomly assigned to an EN or TNPS route and TNPC route for 24 hours nonstop. Nutritional support was initiated as soon as possible on early admission in the TPN group after patients were hemodinamically stable and enteral feeding was started after the presence of bowel sounds. The parenteral nutrition consisted of sterile amino acid, dextrose solutions, multivitamins, trace elements, and intravenous lipid emulsions. Enteral feedings were started in the TPN group as soon as bowel sounds were present, and gastric residual volumes were less than 100 cc every 2 hours. Patients were given metoclopramide, 10 mg/6 hrs to stimulate gastrointestinal motility; feedings were started as soon as the bowel sounds were present and feeding tube was inserted with ascertained placement in the stomach.
JKM. Vol.11 No.1 Juli 2011:1-16
Benedict equation was used to predict basal energy expenditure. Parenteral fed patients were given Aminovel via intravenous abocath continuously for 24 hours nonstop every day during the experiment, Aminovel contains 0.5 Kcal/cc. Every effort was made to achieve a caloric intake of 1.75 (activity factor) x the basal energy expenditure and 1.5–2.5 gram protein/kg body weight/day.
Calorie intake and nitrogen balance
Daily total calorie and protein intake were recorded. Calorie intake was 1.75 x the basal energy expenditure. Daily nitrogen (N) balances were calculated as follows: protein (g) / 6.25 = N gram, N output (g/day) = urea N (g/day) + 4 g (insensible loss) balance = N (g/day) – No output.1 Serum protein levels and serum albumin levels were evaluated as an indirect measure of protein turnover. Calorie and protein intakes were compared to serum protein levels to determine the effect of nutrient intake on serum protein levels and also albumin anthropometry. The assessment of nutritional status includes measurement of the mid-arm circumference on days 1, 7, and 14 post injury; total acute lymphocyte count was calculated daily as (white blood cell (WBC) count x % lymphocytes)/100.
Anthropometry
The assessment of nutritional status used in this study is the measurement circumference of the mid-arm.
Complications
Incidences of pneumonia were recorded. Pneumonia was defined as an elevated WBC count, elevated temperature, positive sputum culture, and a demonstration of infiltrate on chest x-ray films.
Statistical analysis
Data measured repeatedly over time were evaluated by an analysis of variance.
Result and Discussion
Result
Nine patients were excluded for the above reasons because of extracranial problem and unstable haemodynamic, leaving 21 patients for statistical analysis. Of the remaining 21 patients, 7 were randomly assigned to receive continous parenteral nutrition (TPNC), 7 were randomly assigned to receive standard parenteral nutrition (TPNS) and 7 patients were randomly assigned to receive enteral nutrition (Table 1).
14th day, nitrogen balance of 1st, 7th, and 14th day, and finally the body mass index (BMI).
We found out that there were no significant differences between nutritional groups based upon their demographic features as shown in Table 2. The p values for GCS 1stday 14 height, body weight, and sex, are p=0.709, p=0.561, p=0.413, p=0.601 respectively. Table 3 demonstrates that there was no significant difference between nutritional groups based on factors of death with p value 0.667. Table 4 shows the mean neurological outcome based on the 14th day’s GCS. In it, there was a significant GCS difference among nutritional groups on the 14th day with a p value of 0.010. TPN nutritional group
had the highest 14th day’s GCS, which is 10.86+0.508.
Counting albumin levels could be a marker for neurologic outcome after severe head injury. Table 5 confirms that albumin levels of the 14th day had a significant difference among nutritional groups based upon p value of 0.02. The highest mean albumin levels of 3.867+0.3777 can be found from the TPN nutritional group. Total protein levels can also be a marker for neurologic outcome after severe head injury. Table 6 contains data of protein levels of the 14th day compared among nutritional groups. The p value was 0.066, so there was no significant difference between nutritional groups based upon protein levels.
JKM. Vol.11 No.1 Juli 2011:1-16
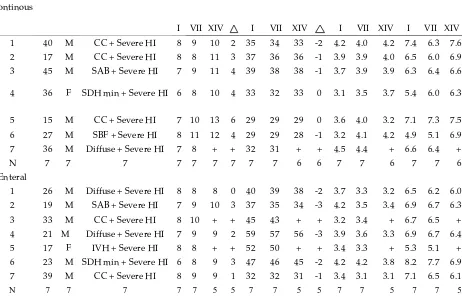
Table 1. Summary of 21 Patients with Severe Head Injurya
Group Age Sex
Diagnosis/Head CT
Scan GCS (day) MAC(day) Albumin (day) Total Protein TPN
Continous
I VII XIV I VII XIV I VII XIV I VII XIV 1 40 M CC + Severe HI 8 9 10 2 35 34 33 -2 4.2 4.0 4.2 7.4 6.3 7.6 2 17 M CC + Severe HI 8 8 11 3 37 36 36 -1 3.9 3.9 4.0 6.5 6.0 6.9 3 45 M SAB + Severe HI 7 9 11 4 39 38 38 -1 3.7 3.9 3.9 6.3 6.4 6.6
4 36 F SDH min + Severe HI 6 8 10 4 33 32 33 0 3.1 3.5 3.7 5.4 6.0 6.3
5 15 M CC + Severe HI 7 10 13 6 29 29 29 0 3.6 4.0 3.2 7.1 7.3 7.5 6 27 M SBF + Severe HI 8 11 12 4 29 29 28 -1 3.2 4.1 4.2 4.9 5.1 6.9 7 36 M Diffuse + Severe HI 7 8 + + 32 31 + + 4.5 4.4 + 6.6 6.4 +
N 7 7 7 7 7 7 7 7 7 6 6 7 7 6 7 7 6
Enteral
1 26 M Diffuse + Severe HI 8 8 8 0 40 39 38 -2 3.7 3.3 3.2 6.5 6.2 6.0 2 19 M SAB + Severe HI 7 9 10 3 37 35 34 -3 4.2 3.5 3.4 6.9 6.7 6.3 3 33 M CC + Severe HI 8 10 + + 45 43 + + 3.2 3.4 + 6.7 6.5 + 4 21 M Diffuse + Severe HI 7 9 9 2 59 57 56 -3 3.9 3.6 3.3 6.9 6.7 6.4 5 17 F IVH + Severe HI 8 8 + + 52 50 + + 3.4 3.3 + 5.3 5.1 + 6 23 M SDH min + Severe HI 6 8 9 3 47 46 45 -2 4.2 4.2 3.8 8.2 7.7 6.9 7 39 M CC + Severe HI 8 9 9 1 32 32 31 -1 3.4 3.1 3.1 7.1 6.5 6.1
TPN standard
1 32 M SAB + Severe HI 8 8 10 2 32 32 31 -1 4.0 3.6 3.5 7.1 6.8 7.0
2 23 F SDH min + Severe HI 8 8 9 1 37 37 35 -2 3.7 3.6 3.6 6.9 6.2 6.3
3 42 M CC + Severe HI 6 7 7 1 39 38 37 -2 3.3 3.3 3.2 6.7 6.4 6.4
4 30 F SDH min + Severe HI 6 7 8 2 33 31 30 -3 2.5 2.8 3.4 5.1 6.0 6.1 5 14 M IVH + Severe HI 8 9 10 2 29 28 27 -2 2.9 3.0 3.2 7.0 6.9 6.9
6 21 F Diffuse + Severe HI 8 8 10 2 29 27 26 -3 3.3 3.2 3.3 4.6 5.1 5.2 7 43 M Diffuse + Severe HI 5 7 8 3 32 31 31 -1 3.8 3.9 3.8 6.5 6.4 6.2
N 7 7 7 7 7 7 7 7 7 7 7 7 7 7 7 7 7
Total N 21 21 21 21 21 19 19 21 21 18 18 21 21 18 21 21 18
JKM. Vol.11 No.1 Juli 2011:1-16
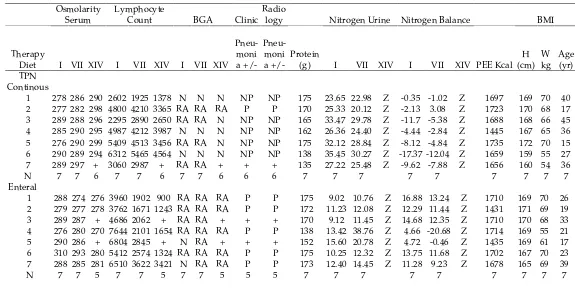
Table 1 (continued). Summary of 21 Cases of Nutritional State
Osmolarity Serum
Lymphocyte
Count BGA Clinic Radio
logy Nitrogen Urine Nitrogen Balance BMI
Therapy
Diet I VII XIV I VII XIV I VII XIV
Pneu-moni a +/-
Pneu-moni a +/-
Protein
(g) I VII XIV I VII XIV PEE Kcal H (cm)
W kg
Age (yr) TPN
Continous
1 278 286 290 2602 1925 1378 N N N NP NP 175 23.65 22.98 Z -0.35 -1.02 Z 1697 169 70 40 2 277 282 298 4800 4210 3365 RA RA RA P P 170 25.33 20.12 Z -2.13 3.08 Z 1723 170 68 17 3 289 288 296 2295 2890 2650 RA RA N NP NP 165 33.47 29.78 Z -11.7 -5.38 Z 1688 168 66 45 4 285 290 295 4987 4212 3987 N N N NP NP 162 26.36 24.40 Z -4.44 -2.84 Z 1445 167 65 36 5 276 290 299 5409 4513 3456 RA RA N NP NP 175 32.12 28.84 Z -8.12 -4.84 Z 1735 172 70 15 6 290 289 294 6312 5465 4564 N N N NP NP 138 35.45 30.27 Z -17.37 -12.04 Z 1659 159 55 27 7 289 297 + 3060 2987 + RA RA + + + 135 27.22 25.48 Z -9.62 -7.88 Z 1656 160 54 36
N 7 7 6 7 7 6 7 7 6 6 6 7 7 7 7 7 7 7 7 7
Enteral
1 288 274 276 3960 1902 900 RA RA RA P P 175 9.02 10.76 Z 16.88 13.24 Z 1710 169 70 26 2 279 277 278 3762 1671 1243 RA RA RA P P 172 11.23 12.08 Z 12.29 11.44 Z 1431 171 69 19 3 289 287 + 4686 2062 + RA RA + + + 170 9.12 11.45 Z 14.68 12.35 Z 1710 170 68 33 4 276 280 270 7644 2101 1654 RA RA RA P P 138 13.42 38.76 Z 4.66 -20.68 Z 1714 169 55 21 5 290 286 + 6804 2845 + N RA + + + 152 15.60 20.78 Z 4.72 -0.46 Z 1435 169 61 17 6 310 293 280 5412 2574 1324 RA RA RA P P 175 10.25 12.32 Z 13.75 11.68 Z 1702 167 70 23 7 288 285 281 6510 3622 3421 N RA RA P P 173 12.40 14.45 Z 11.28 9.23 Z 1678 165 69 39
TPN
1 274 281 289 2312 1821 1265 RA RA RA P P 165 28.10 25.77 Z -6,06 -6,32 Z 1724 173 66 32 2 290 278 279 5957 2392 1567 RA RA RA P P 170 22.36 20.52 Z 0.84 2.68 Z 1412 170 68 23 3 278 288 286 3874 2534 1892 RA RA RA P P 172 21.90 20.88 Z 1.62 2.64 Z 1140 169 69 42 4 285 285 281 3775 2262 1998 RA RA RA P P 182 28.81 21.23 Z -3.68 3.89 Z 1375 168 73 30 5 286 277 276 2997 1743 1313 RA RA N NP NP 145 17.80 16.06 Z 1.4 3.24 Z 1721 163 58 14 6 290 281 284 3213 630 1543 RA N RA P P 190 22.22 17.34 Z 4.18 9.06 Z 1409 163 76 21 7 293 279 277 2375 1982 1698 RA RA RA P P 172 18.23 16.06 Z 5.26 7.46 Z 1650 160 69 43
N 7 7 7 7 7 7 7 7 7 7 7 7 7 7 0 7 7 0 7 7 7 7
JKM. Vol.11 No.1 Juli 2011:1-16
Table 2. Summary of Demographic Features and Significance of Difference between Groups. The demographic features were not significantly different between groups based on GCS 1st day, height, body weight and sex (p>0.05)
Factor TPN Continous Enteral TPN standard Significance
Cases 7 7 7
GCS day 1 7.29+0.286 7.43+0.297 7.00+0.486 p = 0.709
Height (cm) 166.43+1.888 168.57+0.751 166.57+1.757 p = 0.561 Weight (kg) 64.0+2.554 66.00+2.182 68.43+2.148 p = 0.413 Age (y) 30.86+4.350 25.43+3.007 29.29+4.081 p = 0.601
Value are means + standard error of the means
C
alorie and protein intake for the parenteral (TPN)
Table 3.Number and Cause of Deaths and Significance of Difference between Groups
Time of death TPN Continous Enteral TPN std Significance (ANOVA) Early deaths
(<7 days)
0 0 0
Late deaths (>7 days)
1 brain death 1 brain death 1 IVH sepsis
0 p = 0.667
Total case 1 2 0
P>0.05: No significant difference between groups based on factor of deaths
Table 4. Mean Outcome Neurological Based on GCS 14th Day between Groups. There was a significant difference among groups on GCS 14th day with p<0.05
Factor TPN
Continous
Enteral TPN std Significance (ANOVA)
Cases 7 7 7
14th day GCS 10.86+0.508 9+0.316 8.86+0.459 0.010
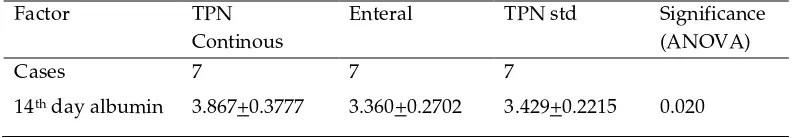
Table 5. Mean Standard Error Outcome Neurologic Based on Albumin on 14th Among Groups. There was a significant difference among groups based on albumin at 14th day, p=0.02
Factor TPN
Continous
Enteral TPN std Significance
(ANOVA)
Cases 7 7 7
Table 6. Mean with Standard Error Neurological Outcome Based on 14th Day Total Protein. There was no significant difference between groups based on protein total 14th day, p=0.066
Factor TPN
Continous
Enteral TPN std Significance (ANOVA)
Cases 7 7 7
14th day total protein 6.967+0.5046 6.340+0.3507 6.3+0.5944 0.066
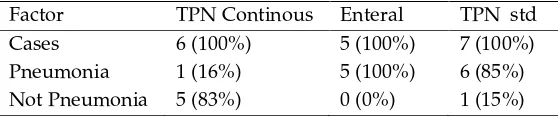
Table 7. Mode of Patients with Incidence of Pneumonia
Factor TPN Continous Enteral TPN std
Cases 6 (100%) 5 (100%) 7 (100%)
Pneumonia 1 (16%) 5 (100%) 6 (85%)
Not Pneumonia 5 (83%) 0 (0%) 1 (15%)
Table 8. Mean Standard Error of Neurological Outcome Based on 14th Day Lymphocyte Count. There were significant difference among groups based on lymphocyte count 14th day, p= 0.007
Factor TPN Continous Enteral TPN std Significance
(ANOVA)
Cases 7 7 7
14th day lymphocyte count
3233.33+454.17 1
1708.40+994.21 2
1610.86+103.66 8
0.007
Table 7 gives us the number of pneumonia and non-pneumonia cases of patients based upon nutritional groups.
JKM. Vol.11 No.1 Juli 2011:1-16
1st, 7th, and 14th day based upon nutritional groups. At the 14th day TPN continuous group has the highest significant increasing albumin levels by 3.867, while TPN standard increases by 3.429 and enteral 3.360.
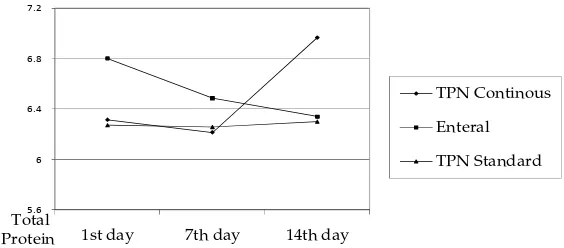
Within Figure 3 we compare total protein levels of day 1, 7, and 14 between nutritional groups and show that there has been a significant increase of protein total on the 14th day. TP continuous group has the highest increase by 6.967, whereas TP standard 6.3 and enteral 6.340. Figure 4 demonstrates comparisons of nutritional urine based
on nutritional groups. There is no significant difference between groups with p=0.067. TPN continuous has the lowest nitrogen urine of -4.41, whilst TP standard 3.23 and enteral 5.25.
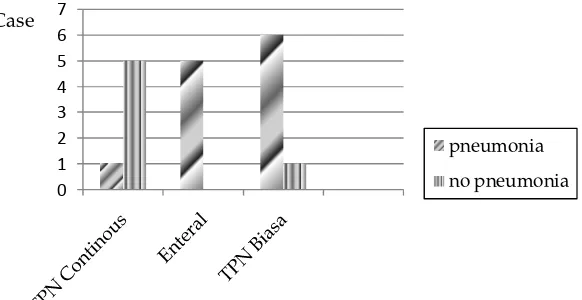
Figure 5 shows comparisons between nutritional groups with and without pneumonia. TPN continuous group has 1 pneumonia out of 6,
1st day 7th day 14th day
TPN Continous Enteral
TPN Standard
GCS
Figure 1. Comparison of GCS 1st, 7th and 14th Day among Groups
2.8 3.2 3.6 4 4.4
1st day 7th day 14th day
TPN Continous Enteral TPN Standard
Figure 2. Comparison of Albumin 1st, 7th and 14th Day among Groups. TPN continous had significant increase albumin 3.867; TPN std 3.429 and enteral 3.360
5.6 6 6.4 6.8 7.2
1st day 7th day 14th day
TPN Continous
Enteral
TPN Standard
Total Protein
Figure 3. Comparison Mean Total Protein 1st, 7th and 14th Day among Groups. TPNC group had significantly increased total protein on 14th day 6.967, enteral 6.,340 and TPNS 6.3
-10 -5 0 5 10 15
1st Day 7th Day
TPN Continous
Enteral
JKM. Vol.11 No.1 Juli 2011:1-16 significant difference between groups with incidence of pneumonia sig 0.006 (P<0.05)
Discussion
Demographic features such as height, body weight, and sex had no significant difference between nutritional groups. Since there was no textbook or article that suggested otherwise, this result was expected.
Most of the patients had late death and many factors can contribute to their deaths, so no significant difference between nutritional groups based on factors of death was predicted.
TPN nutritional group had the highest neurological outcome in the form of 14th day’s GCS and albumin levels. We believe it is because Aminovel contains L form amino acids, sugar, vitamin, and electrolytes needed by the body. We also believe that giving it 24 hours continuously helps the body during early trauma phase which needed a higher number of protein, so this result was expected. Also, there was less
pneumonia and higher lymphocyte count in the TPN continuous group. We consider that continuous nutrition might have given the body raised immunocompetence.
Based upon protein levels and nutritional urine, there is no significant difference between nutritional groups. We deem this result as unforeseen because all three groups were given protein from three different routes. There should be a difference in pharmacokinetic, so we need more research to clarify this.
controlled studies that prospectively randomize patients between fed and unfed group. This study provided two important conclusions: 1) TPNC patients who received significant calories and protein had significantly better outcome than, TPNS and EN patients; and 2) improved outcome was attributable to less susceptibility to infection. Some of the results of the current study are different from the first study; however, the enterally fed patients in this study received significantly more cumulative calories and protein than in the first trial. In contrast, the current investigation evaluates the efficacy of TPNC compared with TPN Standard and EN using improved current standards of enteral support. These variations in methodology may partially explain the differences in results between the three investigations. Our initial study showed that the TPN patients who were fed more calories and protein had better outcomes and fewer complications than the EN group. This trend continued in this study although the differences were less pronounced, most likely due to the switching of patients not tolerating enteral feeding to the parenteral route to
immunocompetence caused by
inadequate nutritional support. We observed that positive nitrogen balance is not always associated with increases in serum albumin, and suggested that changes in body water compartments cause serum albumin depression in critically ill patients.
Conclusion
In conclusion, more calories and protein can usually be administered continously via the TPN route to patients with acute brain injury. This is better than managing EN feedings by nasogastric routes. Nutritional assessment using traditional parameters is not useful in studying efficacy of nutritional support during the first 2 weeks after head injury. Neurological recovery from head injury occurs more rapidly in patients with better and earlier nutritional support.
References
JKM. Vol.11 No.1 Juli 2011:1-16
4. Bulger EM, Nathens AB, Rivara FP, Moore M, Mackenzie EJ, Jurkovich GJ. Management of severe head injury: institutional variations in care and effect on outcome.Crit Care Med 2002; 30:1870–6.
5. Clifton GL, Robertson CS, Choi SC. Assessment of nutritional requirements of head-injured patients. J Neurosurg. 1986;64:895–901.
6. Weekes E, Elia M. Observations on the patterns of 24-hour energy expenditure changes in body composition and gastric emptying in head-injured patients receiving nasogastric tube feeding. Jpn J Parenter Enteral Nutr. 1996;20:31–7.
7. Byron Y, Linda O, et al. The effect of nutritional support on outcome from
severe head injury. J Neurosurg. 1987; 67;668-765.
8. Selladurai B, Reilly P. Initial management of head injury. Australia: McGraw Hill Pty Ltd; 2007.
9. Wilson RF, Tyburski JG. Metabolic responses and nutritional therapy in patients with severe head injuries. J Head Trauma Rehabil 1998;13:11-27.
10. Klodell CT, Carroll M, Carrillo EH et al. Routine intragastric following traumatic brain injury is safe and well tolerated. Am J Surg 2000;179(3):168-71.