■ ✁✂ ✄✂✂➊✷ ✄☎✆
✁ ◆ ✝◆ ✞✟✄☎2/AU2/P2MI-LIPI/04/2012
❚✠ ✡ ✞✝☛ ☞ Neutron Flux Mapping On a Target Capsule ... ✭ ❙✌ ✍ ✎✏☛)
✑ ✒ THERMAL NEUTRON FLUX MAPPING ON A TARGET CAPSULE AT RABBIT FACILITY OF
RSG-GAS REACTOR FOR USE IN k0-INAA
Sutisna
Center of Technology for Nuclear Industrial Materials National Nuclear Energy Agency (BATAN) Kawasan Puspiptek, Gedung 40, Serpong, Tangerang
Email: [email protected]
Diterima editor 10 Desember 2012 Disetujui untuk publikasi 09 Januari 2013
ABSTRACT
THERMAL NEUTRON FLUX MAPPING ON A TARGET CAPSULE AT RABBIT FACILITY OF RSG-GAS REACTOR FOR USE IN k0-INAA. Instrumental neutron activation analysis based on the k0 method (k0-INAA) requires the availability of the accurate reactor parameter data, in particular a thermal
neutron flux that interact with a targets inside the target capsule. This research aims to determine and map the thermal neutron flux inside the capsule and irradiation channels used for the elemental quantification using the k0-AANI. Mapping of the thermal neutron flux (fth) on two type of irradiation capsule have been done for
RS01 and RS02 facilities of RSG-GAS reactor. Thermal neutron flux determined using Al-0,1%Au alloy through 197Au(n,g) 198Au nuclear reaction, while the flux mapping done using statistics R. Thermal neutron flux are calculated using k0-IAEA software provided by IAEA. The results showed the average thermal
neutron flux is (5.6±0.3)×10+13 n.cm-2.s-1; (5.6±0.4)×10+13 n.cm-2.s-1; (5.2±0.4)×10+13 n.cm-2.s-1 and (5.3±0.4)×10+13 n.cm-2.s-1 for Polyethylene capsule of 1st , 2nd, 3rd and 4th layer respectively. In the case of Aluminum capsule, the thermal neutron flux was lower compared to that on Polyethylene capsule. There were (3.0±0.2)×10+13 n.cm-2.s-1; (2.8±0.1)×10+13 n.cm-2.s-1; (3.2±0.3)×10+13 n.cm-2.s-1 for 1st, 2nd and 3rd layers respectively. For each layer in the capsule, the thermal neutron flux is not uniform and it was no degradation flux in the axial direction, both for polyethylene and aluminum capsules. Contour map of eight layer on polyethylene capsule and six layers on aluminum capsule for RS01 and RS02 irradiation channels had a similar pattern with a small diversity for all type of the irradiation capsule.
Keywords: thermal neutron, flux, capsule, NAA
ABSTRAK
PEMETAAN FLUK NEUTRON TERMAL PADA KAPSUL TERGET DI FASILITAS RABBIT
REAKTOR RSG-GAS UNTUK DIGUNAKAN DALAM k0-AANI. Analisis aktivasi neutron instrumental
berbasis metode k0 (k0-AANI) memerlukan ketersediaan data parameter reaktor yang akurat, khususnya data fluks neutron termal yang berinteraksi dengan inti sasaran di dalam kapsul target. Penelitian ini bertujuan menentukan dan memetakan fluks neutron termal di dalam kapsul dan kanal iradiasi yang berbeda untuk kuantifikasi unsur-unsur menggunakan k0-AANI. Pemetaan fluks neutron termal (fth) pada dua jenis kapsul iradiasi telah dilakukan untuk kanal RS01 dan RS02 di reaktor RSG-GAS. Fluks neutron termal ditentukan dengan menggunakan paduan Al - 0,1 % Au melalui reaksi nuklir 197Au (n,g)198
Au, sementara pemetaan fluks dilakukan menggunakan statistik R. Fluks neutron termal dihitung menggunakan perangkat lunak k0-IAEA yang disediakan oleh IAEA. Hasil penelitian menunjukkan bawa rata-rata fluk neutron termal adalah (5,6±0,3)×10+13 n.cm-2.s-1; (5,6±0,4)×10+13 n.cm-2.s-1, (5,2± 0,4)×10+13n.cm-2.s-1 dan (5,3 ± 0,4)×10+13 n.cm -2
.s-1 masing-masing untuk lapisan 1, 2, 3 dan 4 pada kapsul polietilena. Dalam kasus kapsul aluminium, fluk neutron termal adalah lebih rendah dibandingkan dengan fluk neutron termal pada kapsul polietilena, yaitu (3,0 ± 0,2) ×10+13 n.cm-2.s-1; (2,8 ± 0,1)×10+13 n.cm-2.s-1; (3,2 ± 0,3)×10+13 n.cm-2.s-1 masing-masing untuk lapisan 1, 2 dan 3. Untuk setiap lapisan dalam kapsul, distribusi fluks neutron termal adalah tidak seragam dan tidak ada degradasi fluk dalam arah aksial, baik untuk kapsul polietilena maupun untuk kapsul aluminium. Peta kontur fluk neutron termal untuk delapan lapisan pada kapsul polietilena dan enam lapisan pada kapsul aluminium untuk kanal iradiasi RS01 dan RS02, memiliki pola yang sama dengan keragaman yang relatif kecil untuk semua jenis kapsul iradiasi.
❏ ✓✔✕✖ ✓✗✕ ✘✖ ✙ ✚ ✛✓✜✢✖ ✣ ✓
❱✤ ✥✦✧ ✺ No.1 Februari 2013, Hal. 27-35
★✩✩ ✪✧✫✧✧–240X ✪✤ ✬✤✮✯402/AU2/P2MI-LIPI/04/201✰
✱ ✲
INTRODUCTION
Automation in Neutron Activation Analysis (NAA) will support the commercialization of research reactors regularly; thereby this automation will increase the efficiency of the time and other resource used. The NAA automation has been initiated by the IAEA since 2009 [1,2] and the Coordinated Research Program 2012-2015 (CRP1888)[3] regarding the integration between hardware and software in an effort to automate the NAA laboratory.
Among various methods used in neutron activation analysis, the method of k0-Instrumental
Neutron Activation Analysis (k0-INAA) has a big opportunity to be applied on the automation system.
Recently the utilization of k0 method for quantification of elements in various samples trend to
increase. This method is independent to the availability of standard comparator, based on numerical method and traceable to standard and a nuclear parameter data used. The use of single radioisotope as a neutron flux monitor is also very beneficial. However, this method requires an accurate data of reactor parameter and counting system.
Various laboratories have improved the counting automation as well as in the calculation process to increase the ability and effectiveness in the quantitative analysis of elements in the sample. For quantitative analysis, a commercial k0-software packages were available, but the price is too high
for most laboratory AAN.
In 2007, the IAEA has released a non-commercial software for IAEA member country that was free in-charge, which is known as the k0-IAEA [4]. The k0-INAA method used in the elemental
determination is based on the concept of Hoghdahl. In this software, Blaauw removed all references to the cadmium cut-off energy from original k0-formula [5]. In the k0 - IAEA, the target is configured as
group or layer and the thermal neutron received by target have to determine quantitatively using an appropriate thermal neutron flux monitor. Thus the monitoring parameters of thermal neutrons flux at the position of a target become very crucial, and must be known accurately.
So far, the thermal neutron flux distribution inside the target capsule has not yet available for all irradiation channels used for NAA at RSG-GAS reactor. Thermal neutron flux of RSG-GAS reactor have been determined and published by Amir Hamzah [6], Syaiful Bahri [7] and Jaka Iman [8]. However, this study did not specify for the type of irradiation capsule and the target distribution inside the capsule. In the k0 method, matrices and materials of the capsule, were influential significantly in the
quantitative calculations due to the interaction between a thermal neutrons with various materials have a different effects [4,8]. Therefore there is a need to determine of flux distribution accurately in the irradiation channels and at the target capsule in order to optimize the k0-INAA method.
For the purposes of INAA based on k0 method, the samples were irradiated at the irradiation
channel of RS01 to RS04 at RSG-GAS reactor. Polyethylene capsule and Aluminum capsule normally used as container for short and long irradiation respectively [9,10]. Therefore, the mapping of the thermal neutron flux at the irradiation capsule is very important to be accurately determined
The aim of this paper is to investigate the distribution of thermal neutron flux inside the irradiation capsule for difference channel (RS01 and RS02) and map it for each layer and type of the irradiation capsule. For the long term, the use of the thermal neutron flux map on capsule irradiation and the corresponding channel will reduce a dependency on the use of alloy Al-0.1%Au as flux monitor.
MATERIALS AND METHODS
Utilization of 197Au(n,g)198Au nuclear reaction to determine a thermal neutron flux has established and has been widely published [11,12]. This nuclear reaction is also recommended for k0
✳✴ ✴✵✶ ✸✶✶✹✻ ✸✼✽
✵ ✾ ✿✾ ❀❁✸✼2/AU2/P2MI-LIPI/04/2012
❂❃ ❄ ❀✿❅ ❆ Neutron Flux Mapping On a Target Capsule ... ❇✴❈❉ ❊ ❋●❅)
❍ ❑
in the development of k0 INAA. However, the nuclear reactions of 68
Zn (n,g)69mZn and 115In (n,g)116mIn have been also used as monitors for the thermal neutron flux [12, 13].
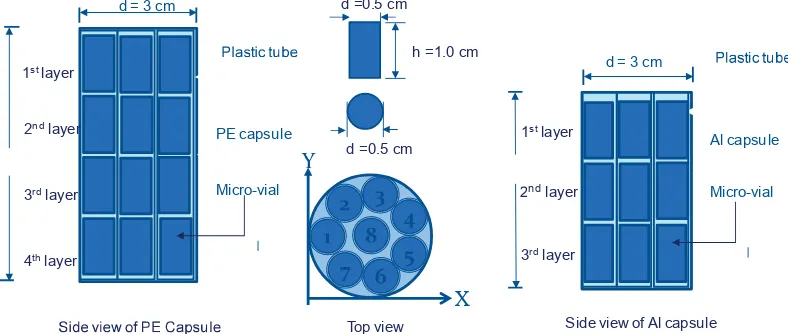
A number of 3 mg Al-0, 1% Au (IRMM 532RC, wire, purity 99.99%) were weighted and put into the 0.2 ml cleaned polyethylene micro-vial (Cole Parmer). Targets were than arranged to form a stack and layer inside irradiation capsule using a polyethylene tube, to fix a position at axial direction as shown in the Figure 1. For polyethylene capsule, 32 micro-vials (32 positions) formed four layers, while there were 24 micro-vials (24 positions) on aluminum capsule formed three layers.
Target then was irradiated in the rabbit facility of RS01 and RS02 at a reactor power of 15 MW. The results of the thermal neutron induced radiation, then were counted using a calibrated high-resolution HPGe detector (FWHM = 1.9 keV at Eg = 1332.5 keV of
60
Co, P/T = 40) for 15 minutes after the cooling time of 1-2 days. Region of Interest (ROI) for energy peak of Eg= 411.80 keV produced from a nuclear reaction of 197Au(n,g) 198Au [11] were determined. Maximum accepted uncertainty was less than 1%. Calculation of thermal neutron flux was carried out using k0 software
provided by The International Atomic Energy Agency (k0-IAEA) [4].
The open-source software of R statistics from CRAN have been used for statistical analysis and contour mapping. The positions of capsules 1 to 7 on the same layer were determined based on the flux calculation result. The high flux result was placed a position close to the reactor core, meanwhile the lowest flux course being away from the reactor core. Because the distance is quite short, it was estimated that the different on flux was very small.
The use of polyethylene tubes will helped to determine the location for both vertical direction (axial) and radial position. The axial position number 1 on layer one will correspond to the position number one on layer two, layer three and layer four respectively. Figure 1 below is configuration and position of vial target at irradiated capsule, both for polyethylene capsule and aluminum capsule respectively.
Figure 1. Configuration of the target for the thermal neutron flux mapping study.
RESULTS AND DISCUSSION
In the Neutron Activation Analysis (NAA) based on k0 method, all used parameter should be
determined accurately to give a result with uncertainty as small as possible. Because the variation of neutron thermal produced at reactor, the thermal neutron flux incident on the target should be
▲ ▼ ❖
P ◗
❘ ❯ ❲
❳ ❨ ❩ ❬❭❪ ❫❭❴❵❛
PE capsule
Micro-vial d = 3 cm
❤❜❝ ❞❡❢
❣✐ ❥ ❦❧ ✐ ❦♠♥ ♦♣ qr s t ✉✈✇❦ Top view
h =1.0 cm d =0.5 cm
d =0.5 cm
4thlayer
2ndlayer
3rdlayer
1stlayer
①
X
♣✇ s✉②✐❡②✈③❦
Al capsule
Micro-vial d = 3 cm
④⑤⑥❫⑦
⑧
ndlayer
3rdlayer
1stlayer
⑨ ⑩❶❷❸ ⑩❹❷ ❺❸ ❻ ❼ ❽⑩❾❿❸ ➀ ⑩
➁ ❼➀⑩➂ ➃ No.1 Februari 2013, Hal. 27-35
➄➅➅ ❾➂➆➂➂–240X ❾ ❼➇❼ ❽➈402/AU2/P2MI-LIPI/04/201➉
➋ ➌
monitored accurately at each capsule used, as well as, each layer of target position. Thus, the characteristic of thermal neutron flux at different capsule and difference irradiation channel is very important to determine for k0 -NAA calculation. The statistical analyses of Box-Whisker have been
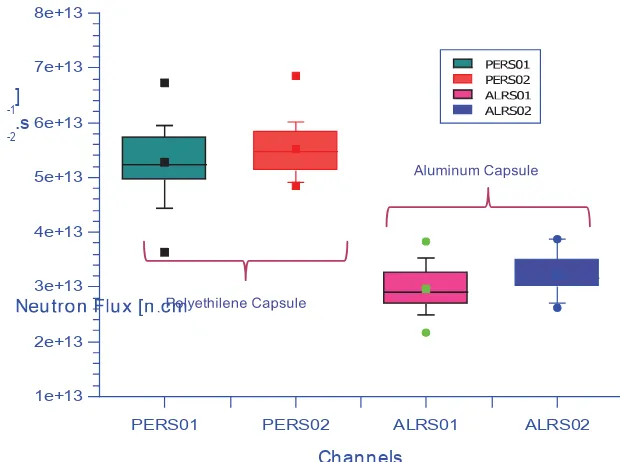
used to compare the flux distribution, either at container capsule or irradiation channels. Figure 2 showed the Box-Whisker graphic for the distribution of average thermal neutron flux in aluminum and polyethylene capsule at the RS01 and RS02 channels respectively.
Average thermal neutron flux at the polyethylene capsule was relatively higher than that in the aluminum capsule, or about 1.5 times higher, at either RS01 channel or RS02 channel. Polyethylene capsule contained more H atom, on either capsule or micro vial, compared to the aluminum capsule. The existence of H atoms will moderate the fast neutrons to the thermal neutron through an inelastic collision of atoms. This thermal neutron will than contribute on the neutron flux coming from the reactor core. As a result, the number of thermal neutrons inside the irradiation capsule will increase. This could also mean that the impact of H is increase with increment of H atom on capsule [14]. In contrast, for aluminum capsule the contribution of H seemed very small. Because the polyethylene material contained in the aluminum capsule is relatively small compared to that in the polyethylene capsule. As a result, the contribution of H atoms in the neutron moderation inside aluminum capsule also small. Meanwhile, the aluminum atoms can capture the thermal neutrons, and it will contribute in the reduction of the thermal neutron flux inside the aluminum capsule.
Figure 2. Box-Whisker for neutron flux distribution at polyethylene and aluminum capsule for RS-01 and RS-02 irradiation channels of RSG-GAS reactor.
The utilization of plastic tube helped us to locate a position at axial direction. Meanwhile it was difficult to locate at a radial direction. The degradation on axial direction was determined by average of all flux value obtained at same layer. Each target capsule has a different layer. The polyethylene capsule consist four layers, while aluminum capsule have three layers as shown in Figure 1, and each layer consisted of eight target. The flux measurement results at axial direction did not indicate any significant flux degradation, either polyethylene capsule or aluminum capsules, as shown at Figure 3. Irradiation position of rabbit capsule located at 30 cm above the ground, or in the middle position of fuel elements (60 cm), on the outside of the reactor core. High of irradiation capsule is 10 cm for aluminum and 12 cm for polyethylene. This is relatively small compare to the size of the fuel element.
➍➎ ➏➐➑➒➓➔ →➏➣↔➓↕➙➛
-2.s -1]
1e+13 2e+13 3e+13 4e+13 5e+13 6e+13 7e+13 8e+13
Channels
PERS01 PERS02 ALRS01 ALRS02
➜➝➞➟➠➡
➦➧ ➧➨➩ ➫➩➩➭➯ ➫➲➳
➨ ➵ ➸➵ ➺➻➫➲2/AU2/P2MI-LIPI/04/2012
➼➽ ➾ ➺➸➚ ➪ Neutron Flux Mapping On a Target Capsule ... ➶➧➹➘ ➴ ➷➬➚)
➮ ➱
Figure 3. The average thermal neutron flux for each layer on the Polyethylene and Aluminum capsule [units given in n.cm-2.s-1].
An accurate result of neutron flux mapping is highly demanded in the k0 method. The use of
flux monitors can be reduced if the map of thermal neutron flux could be realized for each capsule type and irradiation channels. Mapping of thermal neutrons flux are presented in the form of contour map, as shown in Figure 4 to Figure 6.
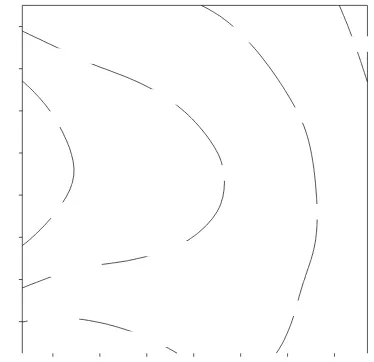
Figure 4 and Figure 5 shows the contour map of thermal neutron flux on the polyethylene capsule at RS-01 and RS-02 channels, for layer one (Figure 4(a) to layer four (Figure 4 (d)) respectively. Contour map for the RS01 and RS02 on polyethylene capsule showed systematic pattern on each layer. The flux density of the left side is higher than that to the right side, from about 6.5×10¹³ n.cm-2s-1 to 4.0×10¹³ n.cm-2.s-1. This mean the left side indicated that the target position was close to the core. The capsule has a fix position at channels irradiation. Actually, it was not possible to determine an exact position at radial direction for each layer. The difference of flux on each layer was very small, of about 1.0-1.5 n.cm-2.s-1. In this condition, the capsule received a fluent neutron came from one direction. Thus the target inside the capsule was not possible to receive a homogenous neutron flux.
❏ ✝✞✟✠ ✝✡✟ ☛✠ ☞ ✌ ✍✝✎✏✠ ✑ ✝
❱ ✌✑✝✒ ✓ No.1 Februari 2013, Hal. 27-35
■✔✔ ✎✒✕✒✒–240X ✎ ✌◆✌ ✍✖402/AU2/P2MI-LIPI/04/201✷
✸ ✗
✭ ✘ ✙ ✚ ✛✜✢ ✣✤ ✥ ✦✣✢✤✧✤✘★ ✩✪ ✫✢✤✬✘ ✦★ ✧✧✤✢✮✯✰✱✬✲✳✴
layer.
✭ ✴✙ ✚ ✛✜✢ ✣✤ ✥ ✦✣✢✤ ✧✤✘ ★✩✪ ✫✢✤✬✘ ✦★ ✧✧✤✢✮✯✰✱✬
4th layer.
Figure 4. Contour map of the thermal neutron flux at the polyethylene capsule for RS01 channel, for 1st layer to 4th layer.
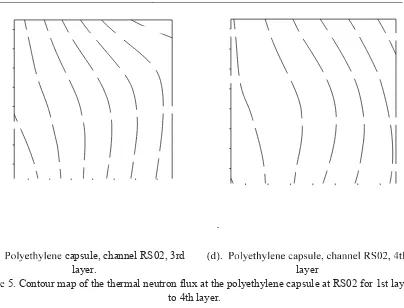
✭ ★✙✚Polyethylene capsule, channel RS02 1st
♣q qrs tss➊✉ t✈✇
➔→ ➣➍↔➄5. Contour map of the thermal neutron flux at the polyethylene capsule at RS02 for 1st layer
to 4th layer.
Figure 6 shown the contour map of thermal neutron flux inside aluminum capsule at RS01 and RS02 channel. The aluminum capsule provided three layers for vial target where each layer contains eight monitor of Au. The total was 24 points for mapping flux determination. The results of mapping flux showed a similar pattern with the pattern obtained in polyethylene capsule, except, of course, the amount of thermal of neutron flux was smaller. This suggested also that the capsules were in a fix position during irradiation taken place. For the RS-01, the thermal neutron flux moved significantly from 3.8×10¹³ n.cm-2.s-1 at left side to 3.0×10¹³ n.cm-2.s-1 at right side. In the case of RS-02 channel, the flux moved from 4.0×10¹³ n.cm-2.s-1 at left side to 3.0×10¹³ n.cm-2.s-1 at right side. Same with polyethylene capsule, the diversity was very small, of about 1.0×10¹³ n.cm-2.s-1.
Ý Þßàá Þâà ãá ä å æÞçèá é Þ
ê åéÞë ì No.1 Februari 2013, Hal. 27-35
íîî çëïëë–240X ç åðå æñ402/AU2/P2MI-LIPI/04/201ò
ó ô
❋ ý✍û✟✁6. Contour map of the thermal neutron flux at the aluminum capsule for RS01 channel and
RS02 channel for 1st to 3rd layer respectively.
CONCLUSION
From the results of this research it could be concluded that the thermal neutron flux received by the target inside the capsule are dependence to the capsule type used. The average thermal neutron flux received by the target inside the polyethylene capsules are relatively higher than that inside the aluminum capsule at a reactor power of 15 MW. Thermal neutron flux distribution in the axial direction, for both polyethylene and aluminum capsules, show no degradation on flux. Meanwhile, the contour map of the thermal neutron flux for each layer had a similar pattern with a small diversity for all type of the irradiation capsule and irradiation position.
■❅ ❅❆❇ ❈❇❇➊❉ ❈❊●
❆ ◆ ❍◆ ❏❑❈❊2/AU2/P2MI-LIPI/04/2012
❚▲ ▼ ❏❍❖ P Neutron Flux Mapping On a Target Capsule ... ◗❅❙❘ ❯ ❱❲❖)
❨ ❩
ACKNOWLEDGMENT
The research was carried out and financed by the budget of DIPA PTBIN 2011 project. We thank you very much to the head of PTBIN who have full supported in this research. Thanks also for my colleagues at the centre for RSG-GAS reactor who have already helped in the implementation of irradiation in the rabbit facility. To my colleagues in the NAA laboratory, we would like to say thank you for your support.
REFERENCES
1. IAEA. Report of the IAEA CMs on preparation of guidelines on implementation of routine automation in neutron activation analysis laboratories, Vienna, Austria; December 2009. 2. IAEA. Draft report based on result of the IAEA questionnaire on status of implementation of
routine automation in advanced neutron activation analysis laboratories, Vienna, Austria; June 2011.
3. IAEA. Draft meeting report of the 1st research coordination meeting related to the IAEA coordinated research project 1888/F1.20.25 on development of an integrated approach to routine automation of NAA, Technical University of Delft, Delft, The Netherlands; 2012 August 27-31.
4. Rossbach M, Menno B, Bacchi MA, Xilie Lin. The k0-IAEA program, J Radioanal Nucl
Chem.2007; 274(3): 657-62.
5. Frans de Corte.The k0-Standardization Method, Rijksuniversiteit Gent;1987.
6. Amir Hamzah. Analisis parameter f dan a serta faktor k0 di fasilitas iradiasi reaktor RSG.
GA. Siwabessy, Jurnal Teknologi Reaktor Nuklir.2003;(5)2: 49-58 .
7. Syaiful Bakhri, Amir Hamzah. Pengembangan metode koinsiden untuk penentuan fluks neutron termal RSG-GAS, Jurnal Teknologi Reaktor Nuklir.2004:6(1);12-21.
8. Jaka Iman, Saleh Hartaman, Arsunadi, Royadi. Evaluasi fluks neutron termal di fasilitas iradiasi sistem rabbit RSG. GA. Siwabessy. Prosiding Seminar Penelitian dan Pengelolaan Perangkat Nuklir;2009 Oktober, PTAPB, Yogyakarta;1992.p.275-81.
9. Sutisna, Saeful Yusuf, Sumardjo. Aplikasi metode k0-AANI di reaktor GA. Siwabessy,
Prosiding Seminar Nasional AAN 2008; 2008 Oktober 22. Sabuga ITB. Bandung;2008.p.292-305.
10. Sutisna, Saeful Yusuf, Rukihati, Th Rina Mulyaningsih. Analisis polutan di pesisir utara Banten menggunakan metode k0-AANI di reaktor GA. Siwabessy. Prosiding Seminar
Nasional AAN 2008;2008 Oktober 22. Sabuga ITB, Bandung; 2008.p.229-36.
11. Sogbadji RDM, Nyarko BJB, Akaho EHK, Abrefah RG. Determination of neutron fluxes and spectrum shaping factors in irradiation sites of Ghana's miniatur neutron source reactor (MNSR) by activation method after compensation of loss of excess reactivity, Word Journal of Nuclear Science and Technology. 2011;1:50-6.
12. Sadiq U, Jonah SA, Nasiru R, Zakari YI. Neutron spectrum parameters in two irradiation channels of the Nigeria research reactor-1 (NIRR-1) for use in k0-NAA. Bayero Journal of
Pure and Applied Science. 2010; 3(1):220-23.
13. Ilca MMAM, Jose AGM, Cibele BZ. Software for determination of the thermal neutron flux on nuclear reactor. 2009 International Nuclear Atlantic Conference; 2009 September 27-October 2. Rio de Janeiro, RJ, Brazil;2009.
14. Forina AF, Strijckmans K, Vermaerck P, Verheyen L, Sneyers L. The impact of polyethylene vials on reactor channels characterization in k0-NAA. J Radioanal Nucl Chem.
![Figure 3. The average thermal neutron flux for each layer on the Polyethylene and Aluminum capsule [units given in n.cm-2.s-1]](https://thumb-ap.123doks.com/thumbv2/123dok/4037236.1980656/5.595.87.505.508.773/figure-average-thermal-neutron-layer-polyethylene-aluminum-capsule.webp)