Procedia - Social and Behavioral Sciences 16 (2011) 374–381
*Corresponding author.Tel.:+62-21-5638353: fax: +62-21-5638353 E-mail address: [email protected]
6
thInternational Symposium on Highway Capacity and Quality of Services
Stockholm, Sweden June 28-July 1, 2011
Vehicle composition and lane distribution in multilane highways
in Indonesian cities
Leksmono Suryo Putranto
a*, Ni Luh Putu Shinta Eka Setyarini
aaCivil Engineering Department, Tarumanagara University, Jl. Let.Jen. S. Parman No.1, Jakarta 11440, Indonesia
Abstract
Recently, vehicle composition in Indonesia was changing drastically. Worsening congestion, forced some travellers from all income levels to choose motorcycle and therefore motorcycle prercentage in vehicle composition became higher than default values in Indonesian Highway Capacity Manual (IHCM) 1997 as found in Jakarta, Bandung, Surabaya and Mataram. In IHCM (1997) default values, the larger the city, the lower the motorcycle percentage in traffic. Recently, such pattern was no longer exist. At present paper, additional observation results in Medan and Makassar will be compared with the previous research. Change in vehicle composition will change the distribution of different types of vehicles accross lanes in multilane highways. Observations were made in four lanes-two ways and six lanes-two ways divided highways. It was in general found that in 24 hours observation, most light vehicles and heavy vehicles were using the median lane or middle lane, whilst most motorcycles were using the curb lane or middle lane.
© 2011 Published by Elsevier Ltd.
Keywords:vehicle composition, lane distribution, Indonesian cities, Indonesian Highway Capacity Manual
1.Introduction
the larger the city (in terms of population) the lower the percentage of motorcycle in the general motorized vehicle traffic, in the observation in those 4 cities, such pattern was no longer exist. At the present paper, the result of additional observation and analysis ini Medan (North Sumatra) and Makassar (South Sulawesi) will be compared with the previous research. Change in vehicle composition will consequently change the distribution of different types of vehicles accross lanes in multilane highways. Therefore both in the previous research and the additional observation in Medan and Makassar four lanes-two ways and six lanes-two ways divided highways were selected. In the previous research in Jakarta, Bandung, Surabaya and Mataram, it was in general found that in 24 hours observation aggregated data, most light vehicles and heavy vehicles were using the most right lane (median lane) or middle lane, whilst most motorcycles were using the most left lane (curb lane) or middle lane. Additional observation in Medan and Makassar shows simillar results.
2.Previous studies in vehicle composition
IHCM (1997) provide reference values for traffic composition based on city size in terms of number of population (Table 1). To produce this manual, data from 17 cities were collected. It was found that in smaller cities, percentage of motorcycle in the general traffic was tend to be higher whislt in larger cities the opposite was true. In that era this relationship could be explained by level of whealth approach. Cities with less number of population tend to be less whealty and therefore the motorcycle ownership was higher as motorcycle is more affordable compared to car. The recent dramatic increase motorcycle ownership all over Indonesia can not be explained any longer with level of whealth approach. Recently the reason to own motorcycle is more because of its ability to cut travel time. Motorcycle is perceived to be more flexible compared to car in terms of finding available gap within high density traffic.
Table 1. Reference value of vehicle composition in IHCM (1997)
Number of Population (in Million)
Vehicle Composition (%) by Vehicle Type Light Vehicle Heavy Vehicle Motorcycle
<0,1 45 10 45
0,1-0,5 45 10 45
0,5-1,0 53 9 38
1,0-3,0 60 8 32
>3,0 69 7 24
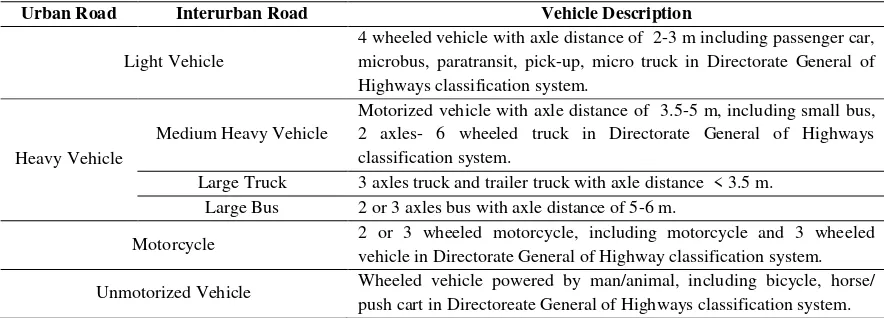
Table 2 explains vehicle classification based on IHCM (1997). As this paper discuss only urban road, there was no need to classified heavy vehicle into 3 sub-classification. This is because the performance of three types of heavy vehicle in flat urban road is about the same.
Table 2 Vehicle classification based on IHCM (1997)
Urban Road Interurban Road Vehicle Description
Light Vehicle
4 wheeled vehicle with axle distance of 2-3 m including passenger car, microbus, paratransit, pick-up, micro truck in Directorate General of Highways classification system.
Heavy Vehicle
Medium Heavy Vehicle
Motorized vehicle with axle distance of 3.5-5 m, including small bus, 2 axles- 6 wheeled truck in Directorate General of Highways classification system.
Large Truck 3 axles truck and trailer truck with axle distance < 3.5 m. Large Bus 2 or 3 axles bus with axle distance of 5-6 m.
Motorcycle 2 or 3 wheeled motorcycle, including motorcycle and 3 wheeled vehicle in Directorate General of Highway classification system.
Putranto and Tantama (2009) conducted 24 hours traffic count in Bandung, Surabaya and Mataram. In each city, 2 four lanes-two ways divided roads (4/2 D) and 2 six lanes-two ways divided (6/2 D) road were observed in a normal working day. However, in Mataram no six lanes-two ways road found to be eligible for observation. The results are sumarized in Table 3 to Table 5. Statistical tests showed that percentage of motorcycle in each city was significantly higher than IHCM (1997) reference value, whilst percentage of light vehicle and percentage of heavy vehicle in each city were significantly lower than IHCM (1997) reference values. In IHCM (1997) Bandung and Surabaya are in the same group of city size (number of population between 1 to 3 million). However, statistical tests showed that percentages of motorcycle in Bandung and Surabaya were significantly different and percentages of light vehicle in Bandung and Surabaya were significanly different. This finding indicates that city size was not valid any longer as a basis for grouping cities with similar vehicle composition.
Table 3 Comparison between vehicle composition in Bandung and values based on IHCM 1997
Road Name Lane Configuration
% Vehicle Population Reference Values
based on IHCM (1997) (%)
Table 4 Comparison between vehicle composition in Surabaya and values based on IHCM 1997
Road Name Lane Configuration
% Vehicle Population Reference Values
based on IHCM (1997) (%)
Table 5 Comparison between vehicle composition in Mataram and values based on IHCM (1997)
Road Name Lane Configuration
% Vehicle Population Reference Values
based on IHCM (1997) (%)
3. Previous studies in lane distribution
Table 6. Vehicle distribution coefficients (C)
Number of Lanes
Light Vehicle Heavy Vehicle 1 Way 2 Ways 1 Way 2 Ways
1 1.000 - 1.000 -
2 0.600 0.500 0.700 0.500
3 0.400 0.400 0.500 0.475
4 - 0.300 - 0.450
5 - 0.250 - 0.425
6 - 0.200 - 0.400
Table 7. Number of lanes based on effective width of the highway
Effective Width of the Highway (L) in Meter Number of Lanes
L < 5.50 1
5.50 ≤ L < 8.25 2
8.25≤ L <11.25 3
11.25 ≤ L < 15.00 4
15.00 ≤ L < 18.75 5
18.75 ≤ L < 22.00 6
Light vehicles are motorized vehicles weigh less than 5 tons including passenger car, pick-up, etc. Heavy vehicles are motorized vehicles weigh at least 5 tons including bus, truck, tractor, semi-trailer and trailer. The C coefficients in Table 6show the percentage of vehicle using the design lane.
According to the manual the design lane is the lane carrying the heaviest traffic load. However, the manual does not specify which lane should be considered as the design lane. In general, for practical reason Indonesia engineers were used to assume the curb lane as the design lane. Since the value of C will affect average equivalent axle load, the thickness and the quality of the pavement material to be used will be sensitive to the accuracy of the value Moreover, in road construction practice, the pavement thickness for the other lanes will refer to the thickness of the design lane. Considering that typical pavement thickness and material quality will be applied for several kilometers, accuracy of every single design component will be important to optimize the use of resources.
Putranto, Aribowo and Intan (2008) carried out 24 hours traffic count from Tuesday, 24 April 2007 (10:30 a.m.) to Wednesday, 25 April 2007 (10:30 a.m.) at a 6 lanes-2 ways arterial road (S. Parman Road in West Jakarta). The observation was recorded by 2 VHS video cameras from a pedestrian crossing bridge so that the counting can be conducted later. This was required in order to accommodate the need to classify the counting in 15 minutes observation for each lane and for each direction. Furthermore the vehicles were classified into four categories, i.e. light vehicle (LV), heavy vehicle (HV), motorcycle (MC) and non-motorized vehicle (NMV)
.
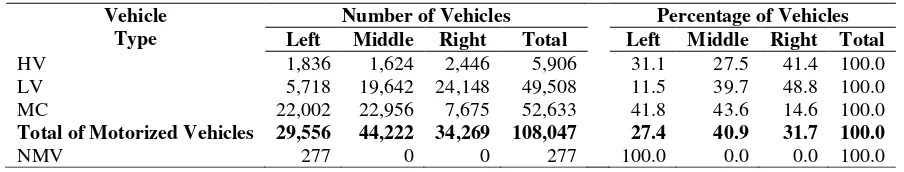
Table 8 shows the number and the percentage of each type of vehicles for each lane during 24 hours for Grogol to Slipi direction. Table 9 shows the same for the opposite direction.Table 10 shows the proposed C values compared to the C according to the manual.Table 8.The number and the percentage of each vehicle type and each lane (Grogol-Slipi)
Vehicle Type
Number of Vehicles Percentage of Vehicles Left Middle Right Total Left Middle Right Total
HV 1,836 1,624 2,446 5,906 31.1 27.5 41.4 100.0
LV 5,718 19,642 24,148 49,508 11.5 39.7 48.8 100.0
MC 22,002 22,956 7,675 52,633 41.8 43.6 14.6 100.0
Total of Motorized Vehicles 29,556 44,222 34,269 108,047 27.4 40.9 31.7 100.0
Table 9.The number and the percentage of each vehicle type and each lane (Slipi-Grogol)
Vehicle Type
Number of Vehicles Percentage of Vehicles Left Middle Right Total Left Middle Right Total
HV 1,232 1,924 2,086 5,242 23.5 36.7 39.8 100.0
LV 5,248 17,642 24,088 46,978 11.2 37.6 51.3 100.0
MC 29,287 19,743 6,119 55,149 53.1 35.8 11.1 100.0
Total of Motorized Vehicles 35,767 39,309 32,293 107,369 33.3 35.5 30.1 100.0
NMV 329 0 0 329 100.0 0.0 0.0 100.0
It can be seen that the numbers of motorized vehicles in both directions were about the same both in total and for each type of vehicle. However the traffic distribution in each lane was clearly more uniform in Slipi-Grogol direction. In the Grogol-Slipi direction the total percentage of vehicles in the left lane was relatively low. This could be the effect of the use of the left lane for parking during certain periods of working hours.
Other interesting finding was that most of LV and HV were not in the left lane, but were in the right lane. Considering this finding, the right lane might be more appropriate to be the design lane. Therefore, based on the result, the percentage of HV in the design lane was about 40%, whilst the percentage of LV in the design lane was about 50%. Other research in toll road adjacent to this road by the same authors shows similar result although in toll road motorcycle is not allowed to pass.
Table 10. Comparison between the analysis result in Jakarta and the value of C in the manual
Number of Lanes
C in the Manual C from Analysis Result
LV HV LV HV
1 Way 2 Ways 1 Way 2 Ways 1 Way 2 Ways 1 Way 2 Ways
3 0.400 0.400 0.500 0.475 0.500 - 0.400 -
6 - 0.200 - 0.400 - 0.250 - 0.200
Putranto and Setyarini (2010) conducted 24 hours traffic count in Bandung, Surabaya and Mataram. In each city, 2 four lanes-two ways divided roads (4/2 D) and 2 six lanes-two ways divided (6/2 D) road were observed in a normal working day. However, in Mataram no six lanes-two ways road found to be eligible for observation. Traffic count was carried out by lane. Table 11 and Table 12 show the proposed C values compared to the C according to the manual for 4/2 D (2/1 if considered as one way) and 6/2 D (3/1 is considered as one way) respectively.
It can be seen that in general for light vehicle observed values in Bandung, Surabaya anda Mataram were higher than C values in the Manual. For heavy vehicle, in general the opposite was true.
Table 11. Comparison between the analysis result in 4/2 D in Bandung , Surabaya and Mataram and the value of C in the manual
Table 12. Comparison between the analysis result in 6/2 D in Bandung and Surabaya and the value of C in the manual
Vehicle Type
C
2/1 4/2 D
Manual Mataram Bandung Surabaya Manual Mataram Bandung Surabaya
LV 0.600 0.852 0.692 0.775 0.300 0.426 0.346 0.386 HV 0.700 0.955 0.800 0.925 0.450 0.478 0.400 0.463
Vehicle Type
C
3/1 6/2 D
Manual Bandung Surabaya Manual Bandung Surabaya
LV 0.400 0.527 0.545 0.200 0.264 0.273
4.Methodology
The research in Medan and Makassar was the second year of three years research on C values. The choice of cities was based on representation of different characteristics of cities. However based on the experience of choosing Mataram in the first year to represent small province capital city, it is not wise to choose to small city in which the alternatives of multilane highways are limited and therefore within the limited choices there might be none of them eligible to be observed. The selected cities were Bandung, Surabaya and Mataram in the first year (as reported in the previous chapter) and Medan and Makassar in the second year. In each city the targeted number of samples are 2 four lanes-two ways divided roads and 2 six lanes-two ways divided roads. The road link to observed is as far as possible fulfil the following requirements:
a. It should have low side friction but not a freeway. b. It has a lane width of about 3.5 m.
c. It has shoulders or curbs with effective width at least 1 m. d. It allows heavy vehicles to pass all day.
In each of the selected road links, the traffic count survey was carried out using the working procedures as follows:
a. The survey should be carried out for 24 hours in one of normal working days (Tuesday, Wednesday or Thursday).
b. The count should be grouped into 15 minutes observation period.
c. The counst should be classified into light vehicle, heavy vehicle, motorcycle and unmotorized vehicle. The purpose of counting unmotorized vehicle is for predicting side friction class only.
d. The count should be grouped by lane and therefore number of each type of vehicle per 15 minutes per lane can be obtained.
The analysis was carried out for all observed road links of all observed cities using the working procedures as follows:
a. The data of each road link should be aggregated into number of vehicle per vehicle type/lane/direction/ 24 hours. Later it should be changed into % of each type of vehicle/lane/direction/24 hours. The lane with the largest % of a type of vehicle become the design lane for that type of vehicle.
b. Using t-test of difference of mean of % of a type of a vehicle in the design lane between a direction and the opposite direction an appropriate C value for a road link can be determined. If the difference is significant in α=0.05 then the highest % is chosen, otherwise the average between %s from both direction should be calculated.
c. Using t-test of difference of mean of % of a type of a vehicle in the design lane between two road links having same lane configuration an appropriate C value for a particular lane configuration in a city can be determined. If the difference is significant in α=0.05 then the highest % is chosen, otherwise the average between percentages from both road links should be calculated.
d. Using t-test of difference of mean of % of a type of a vehicle in the design lane between two road links having same lane configuration in a pair of cities an appropriate C value for a particular lane configuration in a same grouped of cites can be determined. If the difference is significant in α=0.05 then a pair of cities does not belong in the same group, otherwise they belong in the same group.
5.Results
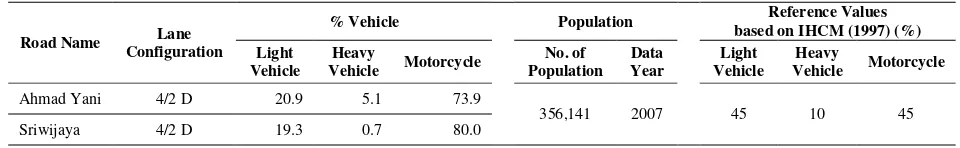
Using the methodology as stated in the previous chapter Table 13 and Table 14 show the vehicle composition in Medan and Makassar respectively. Based on the statistical test, the vehicle compositions in Medan and Makassar were significantly different.
Table 13 Comparison between vehicle composition in Medan and values based on IHCM 1997
Road Name Lane Configuration
% Vehicle Population Reference Values
based on IHCM (1997) (%)
Table 14 Comparison between vehicle composition in Makassar and values based on IHCM 1997
Road Name Lane Configuration
% Vehicle Population Reference Values
based on IHCM (1997) (%)
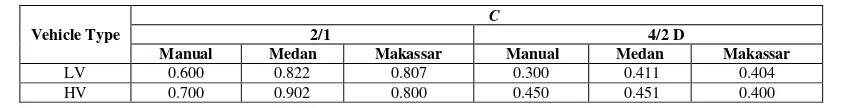
Using the methodology as stated in the previous chapter Table 15 and Table 16 show the C values in Medan and Makassar respectively. Based on the statistical test, the C values in Medan and Makassar were significantly different.
Table 15. Comparison between the analysis result in 4/2 D in Medan and Makassar and the value of C in the manual
Table 16. Comparison between the analysis result in 6/2 D in Medan and Makassar and the value of C in the manual Vehicle Type
C
2/1 4/2 D
Manual Medan Makassar Manual Medan Makassar
LV 0.600 0.822 0.807 0.300 0.411 0.404
HV 0.700 0.902 0.800 0.450 0.451 0.400
Vehicle Type
C
3/1 6/2 D
Manual Medan Makassar Manual Medan Makassar
LV 0.400 0.537 0.488 0.200 0.269 0.244
It can be seen that in general for light vehicle observed values in Medan anda Makassar were higher than C values in the Manual. For heavy vehicle, in general the opposite was true.
Based on further statistical test comparing data from Bandung, Surabaya Mataram, Medan and Makassar, in general both for vehicle compositioni and C values, none of the city can be grouped together as no consistent pattern can be found.
6.Conclusion and Recommendations
From the results both from Medan and Makassar and from the previous research in Bandung, Surabaya and Mataram, it can be concuded that:
a. Vehicle composition in Indonesian cities has been changed as the result of huge increase of motorcycle ownershiop and use in the last five years. Percentage of motorcycle was significantly higher than reference value in IHCM (1997)
b. In general for light vehicle, C values in observed cities were significantly higher than C values in the Indonesian flexible pavement design manual. In general for heavy vehicle, the opposite was true. From the results both from Medan and Makassar and from the previous research in Bandung, Surabaya and Mataram, it is recommended that:
a. Reference values of vehicle composition in IHCM (1997) should be adjusted based on more comprehensive research.
b. C values in Indonesian flexible design manual should be adjusted based on more comprehensive research.
The author realized that the domination of motorcycle in the traffic flow makes the use of passenger car unit (PCU) inappropriate and alternatively motorcycle unit (MCU) should be used. For example Chu et al (2009) suggested that MCU of a type of vehicle in a specified speed is the ratio between effective space of that type of vehicle and effective space of motorcycle in that particular speed. High percentage of motorcycle in the traffic flow has also increased the overall mean speed, as in Putranto (2010). However such discussion is beyond the scope of this paper.
Acknowledgment
I herewith acknowledge the Directorate Genaral of Higher Education, Ministry of National Education for providing funding for this research.
References
_____ (1987). Indonesian Flexible Pavement Design Manual-SKBI-2.3.26.1987 (in Indonesian). Ministry of Public Work.
_____ (1997). Indonesian Highway Capacity Manual. Directorate Genaral of Highway, Ministry of Public Work, Republic of Indonesia.
Chu, C.M., Sano, K. Tran, T.M., Matsumoto, S. (2010). Development of Motorcycle Unit (MCU) for Motorcycle Dominated Traffic. The Journal of Eastern Asia Society for Transport Studies Vol. 8.
Putranto, L.S. (2010). The Evaluation of Space Mean Speeds of Road Links Surrounding New Development in Jakarta. Proceeding of the 7th Asia Pacific Conference on Transportation and the Environment. Semarang Putranto, L.S., Aribowo, R., Intan, D.S. (2008). Traffic Distribution on Multilane Highways in Jakarta and Its Effect
on Vehicle Distribution Coefficient on the Indonesian Flexible Pavement Design manual. Proceeding of the 6th International Conference of Pavement and Airfield Techonology. Sapporo.
Putranto, L.S., Setyarini, N.L.P.S.E. (2010). Koefisien Distribusi Kendaraan untuk Perancangan Tebal Perkerasan Lentur di Mataram, Bandung dan Surabaya. Jurnal Transportasi Vol. 10 No.2 . Bandung: Forum Studi Transportasi antar Perguruan Tinggi.