FINAL PROJECT RC14-1501
RISK BASED TIME AND COST SCHEDULING FOR ITS FMIPA TOWER
DOMINGOS ROMEU CHICOCA NRP : 3113100703
SUPERVISOR
Tri Joko Wahyu Adi, ST., MT., Ph.D
HALAMAN JUDUL
FINAL PROJECT RC14-1501
RISK BASED TIME AND COST SCHEDULING FOR ITS FMIPA TOWER
DOMINGOS ROMEU CHICOCA NRP: 3113100703
Supervisor
Tri Joko Wahyu Adi, ST., MT., Ph.D
TITLE PAGE
TUGAS AKHIR RC14-1501
PERJADWALAN BIAYA DAN WAKTU BERBASIS RISIKO UNTUK PEMBANGUNAN GEDUNG FMIPA-ITS
DOMINGOS ROMEU CHICOCA NRP: 3113100703
Dosen Pembimbing
Tri Joko Wahyu Adi, ST., MT., Ph.D
JURUSAN TEKNIK SIPIL
ii
iii
Time and cost parameters of a construction project, have been identified as major facets of the decision-making process due to uncertainties and the complexity of construction works, that affects duration and budget of the project. In a series of interesting empirical studies covering 20 countries across the five continents including Indonesia, concluded that delays and cost overruns are fairly vast over and common problem in large project. Thus, in order to minimize uncertainty and create most value for money a project scheduling is required and a good schedule should include risks analysis.
This research aims to identify risks and schedule a project using risk analysis to improve both the process of time-cost estimating and the quality of the cost estimates. ITS FMIPA Tower has been used as case study, where all possible risk based time and cost scheduling were considered in order to obtain valuable results. Risk variables were collected from literatures and interview with expert of construction management and finally the schedule was done through RiskyProject Professional from Intaver Institute.
iv
Time estimation, were discover that the normal duration is 329 days but with risks analysis it changes to 353 days.
v
Nama Mahasiswa : Domingos Romeu Chicoca
NRP : 3113100103
Jurusan : Teknik Sipil FTSP ITS
Dosen Pembimbing : Tri Joko Wahyu Adi, ST.,
MT., Ph.D
ABSTRACT
ABSTRAK
Parameter waktu dan biaya dalam proyek konstruksi merupakan aspek utama dalam proses pengambilan keputusan. Tingkat kerumitan pekerjaan konstruksi mempengaruhi kebutuhan dana dan durasi pekerjaan. Pada serangkaian studi terdahulu yang dilakukan di 20 negara dalam lima benua termasuk Indonesia menyimpulkan bahwa penundaan dan kelebihan biaya merupakan masalah umum dalam proyek besar. Sehingga untuk meminimalkan ketidakpastian dan mengoptimalkan dana, penjadwalan proyek yang baik adalah yang mencakup analisis risiko.
Tujuan dari penelitian ini adalah mengidentifikasi risiko dan kemudian menjadwalkan satu proyek menggunakan analisis risiko untuk meningkatkan kualitas estimasi biaya dan waktu. Penelitian ini menggunakan pembangunan Gedung FMIPA-ITS sebagai studi kasus. Kemungkinan risiko yang terjadi pada proyek dianalisa untuk mendapatkan waktu dan biaya yang paling optimal. Variabel risiko dikumpulkan dari literatur dan wawancara dengan ahli manajemen konstruksi. Pengerjaan tugas ini menggunakan aplikasi RiskyProject Professional dari Intaver Institute.
vi
dikerjakan oleh Kaming at el pada tahun 1997.
Dari hasil perhitungan diperoleh hasil yaitu didepatkanya biaya normal proyek Rp.27,007,477,878.31 (Termasuk PPN 10%), tetapi dengan risiko menjadi Rp. 31,913,283,306. Dalam sisi waktu ditemukan durasi normal 329 hari, tetapi Setelah analisa risiko durasi proyek telah menjadi 353 hari.
vii
Scheduling For ITS FMIPA Tower” would be just impossible without the blessings from God the Mighty and valid support and guidance from many personalities who believed in me and my undertakings. Moreover I would like to record my warmest gratitude to:
1. My Parents and Families for the moral and financial support. 2. Angolan Catholic Church in the person of Father Dominikus
SVD, Francisco SVD for taking the risk in being my sponsor during my studies in Indonesia.
3. My learned supervisor, Prof. Tri Joko Wahyu Adi, ST., MT., Ph.D whose sharp sense of research direction have provided invaluable feedback to improve the quality of this final project.
4. All lecturers and Staff of Civil Engineering whose superbly willing to share their knowledge during my studies in ITS. 5. All my colleagues who have been supporting me, giving their
humble and usuful comments while this final project had been writing.
This final project, may still have some shortcomings. Therefore, critics and constructive suggestions are welcome in order to improve its quality. Hopefully, this final project may provide benefits for readers, writers and all those who are enrolled in the world of construction management.
Surabaya, June 2017
viii
ix
ABSTRACT ...iii
ABSTRAK ... v
PREFACE ... vii
TABLE OF CONTENTS ... ix
LIST OF FIGURES ... xi
LIST OF TABLES ...xiii
CHAPTER I INTRODUCTION ... 1
1.1 Background ... 1
1.2 Problem formulation ... 3
1.3 Research Objectives... 3
1.4 Problem Limitations ... 3
1.5 Research benefits ... 4
CHAPTER II LITERATURE REVIEW ... 5
2.1. Construction Industry ... 5
2.1.1 Planning and Construction Control ... 5
2.1.2 The Need of Planning and Scheduling ... 7
2.1.2.1 Identification ... 7
2.1.2.2 Significance ... 7
2.2 Construction Productivity ... 8
2.3 Causes of Time and Cost Overruns in Indonesia ... 10
2.4 Project Objective ... 12
2.4.1 Project Life Cycle... 13
x
3.2. Methodology Flowchart Explanation ... 18
3.2.1 Data Collation and Interpretation Step ... 18
3.2.2 Tasks Outcome Predication Step ... 19
3.2.3 Time-Cost Estimation and Risk Analyze ... 19
3.2.4 Diagrams and Final Considerations ... 22
CHAPTER IV PROJECT DESCRIPTION ... 23
4.1. Project Background ... 23
4.1.1. General data ... 23
4.1.2. Engineering data ... 23
4.1.3. Work Background Structure ... 26
4.3 Normal Duration Estimation ... 36
CHAPTER V TIME - COST RISK ANALYSIS ... 43
5.1 Risk probability Distribution Report ... 46
CHAPTER VI FINAL CONSIDARATIONS ... 55
6.1 Conclusion ... 55
6.2 Suggestion ... 56
REFERENCES ... 57
APPENDICES... 61
xi
Figure 2.1 Traditional Approach for Rational Planning ... 6
Figure 2.2 Typical Project Life Cycle ... 13
Figure 3.1 Methodology Sequence ... 17
Figure 3.2 Preparation Step ... 18
Figure 3.3 Tasks Outcome Prediction Step ... 19
Figure 3.4 Time-Cost Estimation Step ... 19
Figure 3.5 Probability Distribuitions ... 21
Figure 3.6 Chart Diagran and Final Considerations ... 22
Figure 4.1 Sketgch Drawing of the Project Foundation ... 24
Figure 4.2 Half Section Portico ... 24
Figure 5.1 Cost Risk Analysis Results ... 47
Figure 5.2 Time Risk Analysis Results ... 47
Figure 5.3 Project Deadline Report ... 48
Figure 5.4 Sensibility among Tasks Finish Time ... 48
Figure 5.6 ITS FMIPA Construction Schedule Based on Monte Carlo Simulation ... 49
xii
xiii
Table 2.4 Variables influencing cost control in Indonesia ... 10
Table 2.5 Variables influencing time control in Indonesia... 11
Table 2.6 High Risk toward Time-Cost Scheduling... 11
Table 4.1 Required Material Construction ... 25
Table 4.2 Work Background Structure ... 26
Table 4.3 Take-off Volume of the Pre-construction ... 30
Table 4.4 Take-off Volume of the Structural Works ... 31
Table 4.5 Normal Cost Results of the Pre-construction, Spun Pile Foundation and Sub – Structure Works ... 32
Table 4.6 Normal Cost Results of Upper Structure Works .. 33
Table 4.7 Normal Duration Results of the Pre-construction, Spun Pile Foundation and Sub – Structure Works ... 37
Table 4.8 Normal Duration of Upper Structure Works ... 38
Table 4.9 Recap of Normal Time-Cost Estimation ... 41
Table 5.1 Selected Cost Control Variabel ... 44
Table 5.2 Selected Delays Control Variabel ... 44
Table 5.3 Delta Cost among Normal Cost and Risk Cost .... 51
xiv
1
CHAPTER I
INTRODUCTION
1.1 Background
The construction industry is by far one of the most important economic sectors worldwide and more complex than the manufacturing industry. While the manufacturing industry exhibit high-quality products, timelines of service delivery, reasonable cost of service, and low failure rates, on the other hand the construction industry is totally opposite; most projects exhibit cost overruns, time extensions and conflicts among relationship. Time and cost parameters of a construction project, have been identified as major facets of the decision-making process. Construction planning has been the biggest challenging task for construction project managers, due to uncertainty and complexity of construction works that affect duration and budget of the Project.
Delays and cost overruns are fairly vast. In a series of interesting empirical studies covering 20 countries across the five continents, Flyvbjerg and Buhl (2004) have shown that infrastructure projects often suffer from cost overruns. In Indonesia for example, delays and cost overrun are common problems in large project, said Kaminget.al. (1997a). He identified that only 54.5 % of project managers completed more than 90% of their projects; 15.2% of completed only between 70 – 90% of their projects and 30.3% completed less than 70%.
value for money a project scheduling is required and a good schedule should include risks analysis.
A risk analysis framework for estimating time and costs holds considerable promise for improving the time-cost estimation quality at civil works projects, since it provides opportunities to explicitly address much of the uncertainty inherent in the cost estimating process. At a time when cost estimators are being asked to provide more and better cost information earlier in project planning and design than ever before, every opportunity to improve the quality of time-cost estimating should be explored and exploited.
The process of engineering design and planning includes assessing the risks associate with specific design and appropriate modification. Risk assessment in civil engineering, particularly in the construction planning and cost estimate is very important to carried out.
Cavignac (2012) claimed that cost of risk is a concept many construction companies have never thought about despite the fact that it is one of the largest expense items. Furthermore, according to PMI (2008) risk management in the construction project management context is a comprehensive and systematic way of identifying, analyzing and responding to risks to achieve the project objectives. Construction projects can be managed using various risk management tools and techniques.
Figure1.1 ITS FMIPA Tower Location
1.2 Problem formulation
The following research questions will be analyzed throughout this research:
1. What kind of risks should be considered for ITS FMIPA Tower Planning.
2. What is the real time - cost when those possible risks are acknowledged in order to obtain valuable results.
1.3 Research Objectives
The objectives that will be achieved through this research are: 1. Identify and highlight risk factors influencing time and
cost overruns on Indonesia construction projects.
2. Rescheduling time-cost of ITS FMIPA Tower, based on risks analysis.
1.4 Problem Limitations
1.5 Research benefits
The benefits of this research consisted on:
1. Introducing another reference for ITS FMIPA Tower regarding to time-cost scheduling, based on risk analysis. 2. Generating researcher’s attention in order to improve the
quality of project scheduling.
3. Presenting how the cost and time estimate can influence authorization and appropriation decisions.
5
CHAPTER II
LITERATURE REVIEW
2.1. Construction Industry
The construction industry differs greatly from others, since it presents peculiarities that reflect a very dynamic and complex structure. The art of building gathers a range of professionals, machinery and supplies in general and by associating them, leads to obtain a successful project. Palacios (1995) said that civil construction is considered a highly fragmented industry in a large number of small companies, involving a huge variety of stakeholders in relation to other sectors and it is not sophisticated. In contrast, nowadays the civil construction is the most intensified sector, becoming more sophisticated and has more tendencies in following up the technology development. Nevertheless, it can be considered a sector that depends on many internal and external factors.
These industry characteristics show that a planning development and management control interconnected, allows several companies to compete each other without exception. The small companies may suffer a huge disadvantage compared to bigger one, precisely because most of them do not have any strategic planning.
2.1.1 Planning and Construction Control
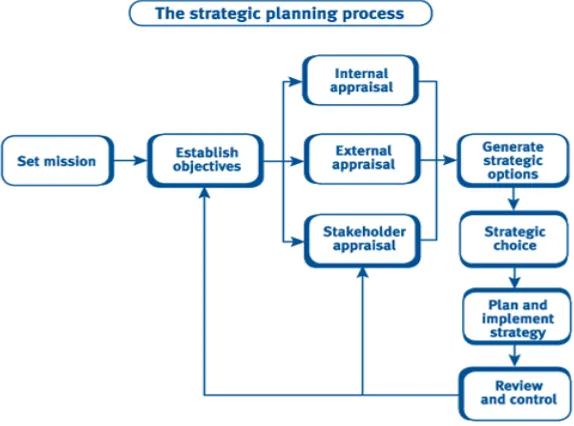
Assed (1986) said, planning is an administrative function that includes the selection of objectives, guidelines, plans, processes and programs. So that these objectives may be achieved effectively, the company needs to get harmony between the financial and physical resources available. This harmony is done through rational planning. This approach breaks down the process of strategic planning into three distinct steps: Strategic analysis (examination of the current strategic position), Strategic choice and Strategic implementation as shown the figure 2.1.
2.1.2 The Need of Planning and Scheduling 2.1.2.1 Identification
Planning and scheduling are closely related; they're both processes that apply to almost every element of starting and running a construction. The project schedule is one of the most important tools in creating a successful project. However, the true value of the schedule is only achieved if several other tools are implemented and integrated.
The schedule is an integral part of the project management system required on move projects. It is integrated with budget, resources, WBS, scope, and quality requirements to produce a virtual model of the project execution plan to guide the work and reflect progress and performance through the life of the project. According to Shruti (2009), Scheduling is the way we actually manage a project. Without scheduling, nothing or nobody is managing the project and hence amounts to failure of a project. He understood that scheduling is process which describes guidance and pathway for a project to run and in order to succeed this process risk should be part of it.
2.1.2.2 Significance
There are a couple of important reasons why planning and scheduling are important for construction field:
a) A solid plan and schedule helps keep costs down and allows operating according to a budget.
b) Set strict ad budget restrictions based on your plan. c) Having a plan and schedule also helps make project
goals seem more realistic and achievable
together. For example, if one of manager objectives is to increase productivity and the additional goal tied to that objective might be to train the worker. These competing needs may complicate the process and cause delays in the project plan until both issues are addressed.
2.2 Construction Productivity
The most challenging issue in Construction industry in the last decade is how to improve the productivity. Many construction managers in Indonesia believed that the occurrence of waste might affect the productivity level. Since the last two decades, some researchers had investigated the sources of reducing construction productivity. The Business Roundtable construction industry cost effectiveness study (1983) concluded that the primary causes for the decline of construction productivity directly or indirectly involved poor management practice.
However, these studies generally only focused on the evaluation of productivity at the level of activity of a job. Productivity itself can be measured at various levels, such as: at the national level, at industry level, at company level, at project level, or at the level of task or activity of a job. Productivity data at the level of activity can not be directly used to measure productivity at the project level because there is missing in linkages between the activity factors. Meanwhile, researcher like Haskell (2004) in America found that many productivity data in the construction industry are incomplete and contradictory. Besides that, there is no regular data collection and no regular measurement of productivity, either by industry or by government.
“inadequate material storage”, “excessive paper-work requests” and “inadequate planning”. The main causes of rework were found as design changes and poor instruction.
As a comparison, Table 2.2 (Adapted from Kaming et al., 1997) presents the productivity problems in Indonesia with other countries.
Table 2.2 Productivity Problems in Several Countries
Moreover one of the newest researches about construction productivity in Indonesia appointed also 9 groups of factors that need special attention in an effort to increase the local project productivity completion are:
a) Factors relating to the design,
b) The factors associated with implementation and planning, c) Factors related to labor,
d) Factors associated with supervision, e) Factors associated with material, f) Factors related to site management, g) Factors associated with equipment,
h) Factors associated with leadership and coordination, i) External factors.
if only a has relatively low position, according to its role in improving motivation and loyalty of workers and increasing dignity, and quality of life of workers.
2.3 Causes of Time and Cost Overruns in Indonesia
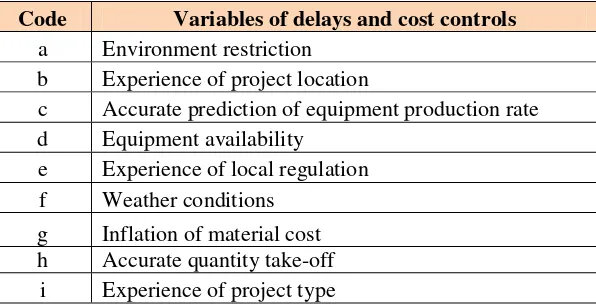
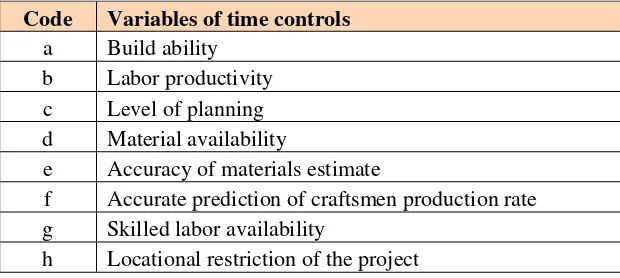
Delay of project and cost overruns in Indonesia is one of most important problems at construction management field. Cost overrun is defined as excess of actual cost over budget. Cost overrun is also sometimes called "cost escalation," or budget overrun." (Zhu et al 2004). The predominant factors influencing time and cost overruns/delays are design changes, poor labor productivity, inadequate planning and resource shortages. Table 2.4 and 2.5 illustrates the variables of delay and cost controls, which studied by Kaming et al (1997) in Indonesia.
Table 2.4: Variables influencing cost control in Indonesia
Code Variables of delays and cost controls
a Environment restriction b Experience of project location
c Accurate prediction of equipment production rate d Equipment availability
e Experience of local regulation f Weather conditions
g Inflation of material cost h Accurate quantity take-off
Table 2.5: Variables influencing time control in Indonesia
Code Variables of time controls
a Build ability b Labor productivity c Level of planning d Material availability
e Accuracy of materials estimate
f Accurate prediction of craftsmen production rate g Skilled labor availability
h Locational restriction of the project
Kaming et al (1997) examine the factors influencing construction cost overruns on high-rise projects in Indonesia, They found that cost overruns occur more frequently and are thus a more severe problem than time overruns on high-rise construction in Indonesia. The predominant factors influencing cost overruns are material cost increases due to inflation, inaccurate materials estimating and degree of project complexity. In addition apart from Kaming claimed the table below illustes others reference of high risks toward Time-Cost over Construction Project.
Table 2.6: High Risk toward Time-Cost Scheduling
No. High Risks toward Time-Cost Scheduling Variables Control
Literatures
A Contractual
A1 Incomplete contractual degree Project Risk Management Hand Book) A2 Late payment by the owner (PT.PP (Persero) A3 Failure realization of loans for
the financing project
2.4 Project Objective
A project can be defined as an activity which has a beginning and an end, which achieves specific objectives trough a set of defining tasks and effective use of resources. A specific project objective or outcomes include: To scope, within time, within cost, good accident record; Quality; Utility and dependability.
Project scope is the work that needs to be accomplished to deliver a product, service or result with specified feature and functions. It should include tangible resources (Men, Money, Machines, Material and Management expertise) and intangible resources (Information). It is reasonable to assume that the objective of a building project is to create the best possible facility for a given level of expenditure, stated Wideman (1981).
B Management
B1 Priorities Changes on program that already underway
B3 Bureaucratic project permission Djojosoedarso, 2003
C Productivity
C1 Lack of equipment Kaming et al., 1997 C2 Low labor productivity PT.PP Persero C3 Supervision delays Kaming et al., 1997
D Design and Technology
D1 Design changes
Kaming et al., 1997 and
Survei Pendahuluan, Laia 2010
D2 Complexity work due to site construction elevation
Survei Pendahuluan, Laia 2010
C Internal Approval
Indeed, even in develop countries, the adversarial attitude amongst the various segments of the building industry is so entrenched that it is sometimes difficult to persuade the parties to the project to act together in the common interest.
Then, the project manager must be aware of the dichotomies that exist and the pitfalls that may be faced. This is the first step in understanding and improving the performance of the team and the resulting development process.
2.4.1 Project Life Cycle
Project Life Cycle, refers to a logical sequence activities to accomplish the project goals or objectives. Regardless of scope or objectives, any project goes through a series stages during its life. Since management is process of planning, supervising and controlling project resources in such a way that positive outcomes (project objectives) are achieved. Projects can be managed by using a life cycle approach: The figure 2.4 shows a typical project life cycle separated into its generally accepted four fundamental phases. It also lists the activities to be expected in each phase. The phase separations correspond to key decision points for purposes of executive level control.
Of course, not all projects conform rigorously to the stages shown and the activities within each may vary somewhat. However, less than satisfactory project performance and lack of control can frequently be traced to significant departures from the division of activities as shown.
2.5 Construction Risk Management
Risk management is one of the nine knowledge areas propagated by the Project Management Institute. The benefits of the risk management process include identifying and analyzing risks, improvement of construction project management processes and effective use of resources, (Project Management Institute; 2008).
The PMBOK® Guide defines a project risk as “an uncertain event or condition that, if it occurs, has a positive or negative effect on at least one project objective”. There are many possible risks which could lead to the failure of the construction project, and through the project, it is very important what risk factors are acting simultaneously. As stated by Raz et al (2002), too many project risks as undesirable events may cause construction project delays, excessive spending, unsatisfactory project results or even total failure.
Cost of risk is a concept many construction companies have never thought about despite the fact that it is one of the largest expense items, stated Cavignac (2009). Risk management helps the key project participants – client, contractor, consultant, and supplier – to meet their commitments and minimize negative impacts on construction project performance in relation to cost, time and quality objectives.
1. Risk identification; 2. Risk assessment; 3. Risk mitigation; 4. Risk monitoring.
From those steps, risk identification perhaps the most important step in the risk management process, as it attempts to identify the source and type of risks. It includes the recognition of potential risk event conditions in the construction project.
Risks and uncertainties, involved in construction projects, cause cost overrun, schedule delay and lack of quality during the progression of the projects and at their end . As stated by Baloi and Price (2003), poor cost performance of construction projects seems to be the norm rather than the exception, and both clients and contractors suffer significant financial losses due to cost overruns.
2.5.1 Accounting for Risk in Project Cost and Schedule
Accounting for risk is critical to developing more accurate project estimates. Identifying possible risks and determining their potential impact will allow Project Managers to take into account factors that are not yet well defined but may ultimately influence project cost.
When comparing risk-based cost estimation methodology to traditional approaches the differences are instead of applying a factor for unknowns, specific event risks are identified and quantified in place of these contingencies and allowances. To determine an accurate estimate range for both cost and schedule, risk must be measured. Project estimates should be comprised of three components:
2.5.2 Risk Analysis for an Accomplished Project
The application of risk management procedures in construction can give early visibility to potential "problem areas" and opportunities, where effort and money can be expended early in the design and construction phases to reduce vulnerability and insurance costs.
However the post construction analysis may selves as key point when there is an unexpected new development in a project or change in the life-cycle of a project. APM (2000), claimed that there are no particular circumstances under which Project Risk Analysis and Management should not be used expect perhaps for repeat project, where such analyses have already been carried out, unless of course there specific differences between the projects. So the absence of relevant data may make a quantitative assessment not worthwhile but such circumstance must never a rigous qualitative analysis being carried out.
CHAPTER III
METHODOLOGY
3.1.Research Stages
In this research the following methodological sequence has been used:
3.2.Methodology Flowchart Explanation
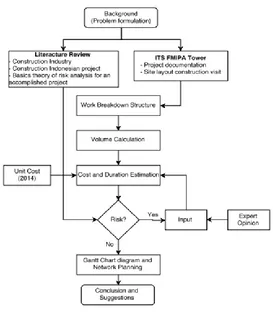
In the previous chapter, the underlying theoretical framework of this study has been presented. This chapter describes the methodology undertaken in relation to justification of the research paradigm, questionnaire design, sampling process and data collection.
This research methodology focuses in 4 main stages:
a. On the first stage illustrates the general concept of this research, problem formulation, research objectives, problem limitation and benefits of the research. Furthermore provides data collections that are divided into 2 sub-parts: Literature review and ITS FMIPA Tower documentation.
b. The second stage focusing on tasks outcome predication. c. The third stage is time-cost estimation by acknowledging
its possible risks, conclusions and suggestions.
3.2.1Data Collation and Interpretation Step
Figure 3.2 Preparation Step
projects and the need of scheduling as sources to minimize uncertainty and Basic theory risk analysis for an accomplished project.
3.2.2Tasks Outcome Predication Step
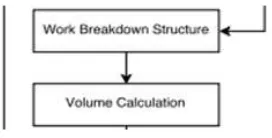
Figure 3.3Tasks Outcome prediction Step The tasks outcome prediction covers two main components:
a. WBS (Work Breakdown Structure) b. Quantity volume
WBS is required at this stage because it may assist key personnel in the effective allocation of resources, project budgeting, procurement management, scheduling, quality assurance, quality control, risk management, product delivery and service oriented management.
3.2.3 Time-Cost Estimation and Risk Analyze
In these stages the will be estimated the time-cost for ITS FMIPA Tower construction development. Based on the literature review and project characteristics, the author will identify critical activities and acknowledge the possible risks both related for time and cost analyze. The Cost estimation has three main factors: Quantify volume, Unit cost and Risk input.
Cost Estimate - A prediction of quantities, price of resources required by the scope of an asset investment option or project. As a prediction, an estimate must address risks and uncertainties. In order to minimize uncertainty, rise risk time-cost will be considerate only for those tasks that appear to be more complex. The risk analysis will be conducted through quantitative analysis and qualitative analysis (See Appendix 3.1b). The expert will be someone from construction management field and familiar with Indonesian construction works.
Both for the quantitative and qualitative risk analysis (Inputs) will be through Data Gathering and Representation Techniques, as following:
a. Interviewing: Interviewing techniques are used to
quantify the probability and impact of risks on project objectives. The information needed depends upon the type of probability distributions that will be used.
For instance, information would be gathered on the optimistic (low), pessimistic (high), and most likely scenarios for some commonly used distributions, and the mean and standard deviation for others.
b. Probability distributions: Continuous probability
Two examples of widely used continuous distributions are shown in Figure 3.5:
Figure 3.5 Probability Distributions
In this research, one of the two continuous distributions available in RiskyProject Professional software will be used. This software was deloveped from Intaver Institute and has an integrated risk analysis such as: task duration, start and finish times, uncertainties in costs and resources, uncertainties in quality, safety, technology, and others. RiskyProject analyzes project schedules with risks and uncertainties, calculates the chance that projects will be completed within a given period of time and budget, ranks risks, and presents the results in formats that are easy to read and understand. It seamlessly integrates with Microsoft Project or can run as a standalone application.
c. Expert judgment: Subject matter experts internal or external to the organization, such as engineering or statistical experts, validate data and techniques.
previous research as high risk structural works, except if the expert judgment suggests something else. The high risk toward Time-Cost Scheduling Variables Control can be seen in table 3.2.
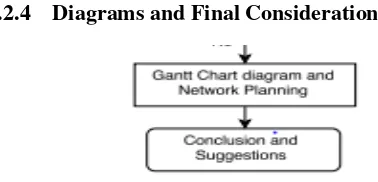
3.2.4 Diagrams and Final Considerations
Figure 3.6 Diagram and Final Considerations
This step focuses on analyzing the scheduling from the "bottom up". This technique breaks the larger tasks down into detailed tasks and shows the time needed to complete each WBS element. In order to oversee the tasks progress will be drown a chronogram type Gantt Charts and network diagram (RiskyProject Professional Software). Gantt Charts are a way to graphically show progress of a project. Management of a project is made easier if it is viewed as small manageable items where the dependencies are visually illustrated, the overall processing time determined and progress tracked.
CHAPTER IV
PROJECT DESCRIPTION
4.1.Project Background
4.1.1. General data
Owner : ITS Campus
Consultant : ARKONIN
Contractor : PT.WASKITA KARYA
Building characteristics : High Rise Building
Project designation : ITS FMIPA Tower
Location : Jln Raya ITS, Sby
Land area : 4.245.10 m2
Land clearing : 2.611.84 m2
Building size : 2.149.00 m2
Foundation type : Pile (foundation)
4.1.2. Engineering data a. Pile Foundation
Pile length of precast concrete : 18m
Diameters : 300, 400
and 500mm
Pile connection : Las
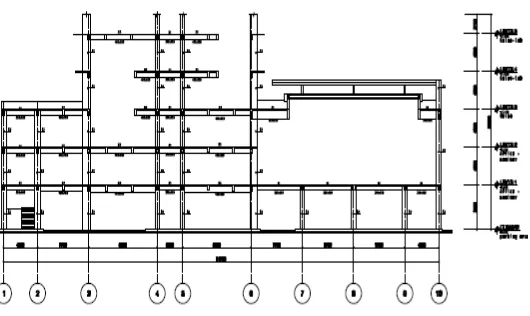
Figure 4.1: Sketch drawing of the project Foundation
Figure 4.2: Half Section Portico
b. Structural design
1. Ground floor
Concrete strength : K-350
Reinforcement (diameter < Ø10)
Reinforcement (diameter < Ø16)
Reinforcement (diameter < Ø19)
Reinforcement (diameter < Ø25)
2. Floor 1 to 3
Concrete strength: K-350
Reinforcement (diameter < Ø10)
Table 4.1 Required materials construction
No Materials Specification Origin Transportation
1 Sand District around Project Location Dump Truck
2 Coal District around Project Location Dump Truck
3 Gravel District around Project Location Dump Truck
Gresik Cement Holcim
Master Steel Surabaya
Cakra Steel Jakarta
d. Equipment
Concrete Mixer
Concrete Mix Truck
Concrete vibrator
Bar cutter
Bar bender
Pile Injection machine
Crane Service
Theodolite
Water pass
4.1.3. Work Background Structure
A Work Background Structure (WBS) is a deliverable-oriented grouping of work involved in a project that defines the total scope of the project. For this project the proposed WBS is given below:
Table 4.2 WBS Elements
No. Task Name Unit
1 ITS FMIPA TOWER CONSTRUCTION
2 I. PRE - CONSTRUCTION
3 Clean the site construction m2
12 Soil excavation m3 13 Installation of sheet piles
14 Compacting the subgrade m2
15 Termite protection over foundation and ground floor
m2
16 Soil consolidation m3
17 Moving the excavated soils m3
18 Dense sand consolidation over foundation m3 19 Base slab of cement concrete m3 20 Joining Spun pile with Pile cap reinforcement Pc
72 Column m3,kg,m2
Notice that the intranet WBS are mostly presented in Tabular form, Chart and in Mind-Mapping Approach. For instance in this project the Tabular form is taking place in order to provide more detail about Time-Cost estimates.
4.1. Normal Cost Estimation
Cost estimation is an approximation of the probable cost of a product or resources computed on the basis of available information. The fees are calculated based on the volume of each WBS element and unit cost value set by the government or the results of field surveys.
No WBS ELEMENTS <1> I. PRE - CONSTRUCTION
1 Clean the site construction 2611.84 m2
2 Demolition and Mobilization services eq 1 Ls
3 Temporary light installations contract 21 P/M
4 Water (Jet pum and water tank 500 L insta 1 Ls
5 PDA test 2 Pt
No WBS ELEMENTS <2> STRUCRURAL ACTIVITIES
I SPUN PILE ( Foundation) 1 Spun Pile (Supplier)
a Diameter 500 mm 3924 m'
b Diameter 400 mm 468 m'
c Diameter 300 mm 540 m'
2 Draving Spun pile
a Diameter 500 mm 3924 m'
b Diameter 400 mm 468 m'
c Diameter 300 mm 540 m'
3 Pile connector ( Electrical Las)
a Diameter 500 mm 218 ctr
b Diameter 400 mm 26 ctr
c Diameter 300 mm 30 ctr
4 Cutting the Head of Spun Pile
a Diameter 500 mm 218 pc
b Diameter 400 mm 26 pc
c Diameter 300 mm 30 pc
5 Wast of Spun Pile Head 46.17 m3
Volume Unit
Volume Unit It is crucial to stress that before cost estimation we need to ensure that quantity take-off has been taken already. For instance, in this analysis most of volume data had been taken from the previous schedule, provided by Alkoni Consultant. The remaining volume estimation such as concrete reinforcement from the sixth floor was conducted by the author based on the project engineering drawing (see appendix 2).
The required data relatively to the estimated volume can be seen in the following recap tables:
Table 4.4 Take-off Volume of the Structural Works
In this research the calculation approaches for the normal Cost estimates is done as follows:
1. Soils and Concrete
Volume = length x width x height
No WBS ELEMENTS
<2> SUB-STRUCTURE WORKS
1 Bauwplank Installation 266.4 m'
2 Soil excavation 3184.75
3 Soil consolidation ( addicional) 1390.65 m3
4 Moving the excavated soils 1191.88 m3
5 Dense sand consolidation over foundation 105.76 m3
6 Base slab of cement concrete 75.54 m3
7 Sheet Pile Installation For GWT
a GWT Excavation Area 268.26 m2
b SPT Area 225.46 m2
8 Compating the subgrade (ground floor and f 1510.83 m2
9 Applying termite protection over foundation 4818.53 m2
10 Soil consolidation ( addicional) 1390.65 m3
11 Moving the excavated soils 1191.88 m3
12 Dense sand consolidation over foundation 105.76 m3
13 Base slab of cement concrete 75.54 m3
14 Joining Spun pile with Pile cap 248
a Concrete strength K-350 848.01 m3
b Reinforcement 81946.31 kg
c Form work 2877.4 m2
<3>
15 Concrete strength K-350 2291.79 m3
16 Reinforcement 303599.8 kg
17 Form work 26969.11 m2
Volume Unit
UPPER STRUCTURE WORKS
2. Reinforcement
Volume = length x 2(diameter) x 0.006165
3. Cost estimation
Cost = Unit cost x volume
Example:
Clean the site construction Unit cost (2014) = Rp 7,950 Volume = 2611.84m2
Then, the clean the site construction cost is Rp 20,764,128. For further result relatively to cost estimation, can be seen on the tables below:
No. Task Name Normal Cost (Rp) Risks
ITS FMIPA TOWER CONSTRUCTION
I PRE - CONSTRUCTION none
1.1 Demolition and Mobilization services equipament
20,764,128.00
1.2 Clean the site construction 20,000,000.00
1.3 Temporary light installations contract
26,250,000.00
1.4 Temporary water facilities (Jet pum and water tank 500 L )
9,130,000.00
1.5 PDA test 15,000,000.00
Sub - Total <I> 91,144,128.00
II SPUN PILE FOUNDATION none
2.1 Spun Pile ( Supplier) 1,937,677,019.04
(5.3)
Cost =
Rp 7,950
x
2611.84m
2= Rp 20,764,128
(5.2)
2.2 Draving Spun Pile 1,841,690,808
2.3 Pile Connection ( Electrical Las) 36,825,326.00
2.4 Cutting Head Spun Pile 50,194,380.00
2.5 Spun Pile Head Wast 18,779,647.50
Sub - Total <II> 3,885,167,180.54
III SUB - STRUCTURE WORKS none
3.1 Bauwplank Installation 24,914,234.16
3.2 Soil excavation 119,560,610.60
3.3 Installation of sheet piles 366,774,389.86
3.4 Joining Spun pile with Pile cap
3.8 Sewage Treatment Plant (STP) 291,057,623.25
3.9 Slab and Shear Wall 17,170,118.59
Sub - Total <III> 2,844,694,297.14
No. Task Name Normal Cost (Rp) Risk
ITS FMIPA TOWER CONSTRUCTION
IV UPPER-STRUCTURE WORKS
4.1 GROUND FLOOR
4.7 SIXTH FLOOR
4.3 Normal Duration Estimation
The duration estimation determines the required time to complete a WBS element. Mostly durations are calculated based on the volume (see 4.2) as well as through productivity, derived from SNI, Unit Cost or field surveys.
- Productivity equation:
𝑝𝑟𝑜𝑑𝑢𝑐𝑡𝑖𝑣𝑖𝑡𝑦 ∶ 𝑘𝑜𝑒𝑓𝑖𝑐𝑖𝑒𝑛𝑡1
Example:
Clean the site construction produactivity
Koefisien = 0.0500 (From Unit cost 2014) Productivity = 1/ 0.0500 = 20
- Duration equation:
𝐷𝑢𝑟𝑎𝑡𝑖𝑜𝑛 ∶ 𝑝𝑟𝑜𝑑𝑢𝑐𝑡𝑖𝑣𝑖𝑡𝑦𝑣𝑜𝑙𝑢𝑚𝑒
Example:
Clean the site construction
Volume = 2611.84m2 (See 4.3 and appendices 3) Productivity = 20 (From previous calculation) Labors = 10 (Assumption)
Duration = 2611.84m2/20 x10 = 15.0952 ≈ 15 days
For further result relatively to productivity (See appendix 3) but for estimation duration resulta are showing in the tables below.
(5.4)
No. Task Name
Demolition and Mobilization services equipament
15
1.2 Clean the site construction
1.3 Temporary light installations contract
1.4
Temporary water facilities (Jet pum and water tank 500 L )
1.5 PDA test 2
Sub - Total <I> 17 II SPUN PILE FOUNDATION
none
2.1 Spun Pile ( Supplier)
2.2 Draving Spun Pile 7
2.3 Pile Connection ( Electrical Las) 13
2.4 Cutting Head Spun Pile 6
(GWT)
IV UPPER-STRUCTURE WORKS
4.1 GROUND FLOOR
4.9 EIGHT FLOOR
This is end of the normal Time-Cost estimation. For further details about duration estimation (Volume, Coefficient, Productivity and labour’s quantity) can be seen in the appendices 3. The appendices shows that the overall duration is 628 days that correspond a period of 8 hours a day. In order to increase productivity and give more value to time, the project development has been taken the following approach:
- Duplicating daily work period (From 8h/day to 16 h/day). - The strategy focus on having two groups of labors with same number of labors and each group works in different period over 8 h/day.
No WBS ELEMENTS Subtotal of Normal Time-cost estimation days
<1> PRE-CONSTRUCTION Rp.91,144,128.00 15
<2> STRUCTURAL WORKS Rp.24,461,108,488.64 314
I SPUN PILE 3,885,167,180.54
II SUB-STRUCTURE 2,844,694,297.14
III UPPER STRUCTURE 17,731,247,010.97
10% OF TAX: Rp.2,455,225,261.66
TOTAL: Rp.27,007,477,878.31 329
Table 4.9 Recap of Normal Time - Cost Estimation
CHAPTER V
TIME - COST RISK ANALYSIS
5.1 Risk collection and Expert Judgment Process
In the methodological sequence risk analysis is the most crucial point of this final project. Many qualitative risks that are qualified as variables of delays and cost control have been identified in the literature (see tables 2.4, 2.5 and 2.6. However, all variables are not analyzed on this research.
Apart from the literature review an interview or consultation with expert and familiar with Indonesian construction project took place in order to verify whether the required data can be applied on this research.
This final had two main correspondents. The primary and direct consultation was with the current Infrastructure Manager of ITS Campus.Through his remarkable response risks like Material Availability Weather Condition, Labors availability were concluded that are totally suitable on this analysis. In addition, also another direct interview was with one of the Expertindo trainer and lecturer at UGM University. Based on problem formulation of this research and from normal time-cost presented, he agreed with previous expert and suggested also to consider Poor Time-Cost estimates as threats along this analysis.
Risks Mitigation/ Impact Code <1> PRE-CONSTRUCTION 91,144,128.00
<2> STRUCRURAL ACTIVITIES I Sub-Structure
1 Spun Pile (Foundation) 3,885,167,180.54 Materials Availability 10 – 25% A Sub-Structure Materials Availability 10 – 25%
A Bauwplank Installation Weather Condition 5 – 10% B Soil excavation Labors Availability 5 – 10% C Sheet pile installation Materials Availability
Joining Spun pile Design changes;
Concreting Pile Cap 1 – 3%
Ground floor beam ( Re-estimate Concreting Ground Water Tank (GWT) if needful) Sewage Treatment Plant (STP)
Slab and Shear Wall
III Upper Structure Materials Availability a Ground Floor Design changes
b First to Third Floor Labors Availability 5 – 10% C
c Fourth to Six Floor 1 – 3%
d Seven to Ten Floor (Re-estimate
if necessary) Poor cost estimates
Poor cost estimates
Normal Project Budget (Including 10% of tax) 27,007,477,878.31
2,844,694,297.14 10 – 25%
No Normal Cost (Rp.) Experte Response
A
D Variables of delays and cost control
`
Normal Duration ( days) Risks Mitigation/ Impact Code <1> PRE-CONSTRUCTION 17
<2> STRUCRURAL ACTIVITIES I Sub-Structure
1 Spun Pile (Foundation) Materials Availability 10 – 30% A Weather Condition 10 – 25% B Sub-Structure Materials Availability 10 – 30% A
Bauwplank Installation Weather Condition 10 – 25% B Soil excavation Labors Availability 5 – 10%
C Sheet pile installation
Joining Spun pile 1 – 3%
Concreting Pile Cap ( Re-estimate
Ground floor beam if needful)
Concreting Ground Water Tank (GWT) Sewage Treatment Plant (STP) Slab and Shear Wall
III Upper Structure Materials Availability a Ground Floor Design changes;
b First to Third Floor Labors Availability 5 – 10% B c Fourth to Six Floor Weather Condition 5 – 10% C d Seven to Ten Floor
a) Material Availability and Design Change
From the expert response, materials availability is a big threat in the construction industry, especially when we are running a project and the local government has specific project that must be finish in short time. Supplier focusing on the government project due to the government legislation and other projects may suffer huge disadvantages. This happened when the “Highway Tanjung Benoa Bali Bridge and the Surabaya –Jakarta
double track Railways has been built, the price of spun
piles, concrete and its components increased significantly from to 10-25% . Such kind of event mostly may lead to project design change that may affect the proposed schedule.
Regarding the design change it is necessary to understand how to do the changes. Effective change management helps us to avoid additional and excessive costs we will incur if we do not adequately manage the people side of change. Has mentioned earlier, normally design change may happen when there is poor material availability or when the stakeholders decide to change the geometry of building. So far, if such thing happens the project may suffer a huge disadvantage regarding the project accomplishment with an probabilistic delay over 10%, said the correspondent. Thus, it is extremely important to consider those issues on this analysis.
b) Weather Condition
up to 20% because it is difficult to carry out soil excavation as well as pouring and curing concrete.
c) Labors’ Availability
The availability of labors is another threat that should be acknowledged in order to improve project schedules. All great managers agree that the availability of labors are not equal all time. In the end of a year and Ramadan periods for example, is quiet difficulty to find labors and it may affect the project budget in that period from 5-10% and boost up the project delay significantly.
d) Poor Time-Cost Estimates
Most of the Consultants and Contractors with high standard agree that poor time-cost estimation may have a significant impact within a project. One of consulted expert mentioned, this issue is mostly addressed by reviewing the schedule estimates. Yet, in this project planning apart from the time-cost being reviewed, the experts suggested to input a significant value from 1-3% from the Time-Cost estimation. In the previous schedule made by consultant, this issue seems being considerate but unfortunately just for the upper structure works but the substructure works was totally neglected.
5.2 Risk probability Distribution Report
From figure 5.1, it can be seen that the mean cost risk of ITS FMIPA construction is 31,819,771,500 with a standard deviation around Rp.218,908,077.00. Most manager agrees that apart from mean cost we still need to consider an contingency cost, which is from 50th percentile over 75th.
Figure 5.1 Cost Risk Analysis Results
Then : Contingency Cost = (range within P50 to P75)
= (31,842,724,978 ) / (31,936,236,784)
= Rp.
93,511,806From figure 5.2, it can be seen that the mean risk duration probability of ITS FMIPA Tower construction is 348 days with a standard deviation around 8 days. Moreover the contingency duration is 5 days, from the range among P50 to P75 percentile, which is above the project deadline mean (03/15/2019).
Furthermore the figure 5.4 illustrates tasks and its coefficient in order to oversee critical path among them.
From figure 5.4 can be seen that the upper construction tasks has strong correlation between risks and project duration. It make all sense because is the summary task with critical and had been suffered a significant impact from the assigned risks. Another
Figure 5.3 Project deadline report
important detail from mentioned figure, is that although the tenth floor is having the lowest duration, its coefficient value is higher than the fifth floor and this is because if we look at figure and 5.5, it is having more assigned risk compared to the fifth floor.
In addition, further details about scheduling and risks assigned are shown in figure 5.6 as well as in the appendix 4.
No. Task Name Normal Time (days) Risk Time (days) Delta (days) Delta (%) Risks/Code
I PRE - CONSTRUCTION 17 none
II SPUN PILE FOUNDATION 27 30 3 11% A , E
ITS FMIPA TOWER CONSTRUCTION
UPPER-STRUCTURE WORKS
Another way to demonstrate how time-cost risks analysis impacts the project is based on presenting a short comparison between normal time-cost and the time-cost risk. Thus, WBS element with its time and cost delta are summarized in table 5.3 and table 5.4
Table 6.3 : Delta Cost among Normal Cost and Risk Cost
Table 5.4 : Delta Time among Normal Time and Risk Time
No. Task Name Normal Cost (Rp) Risk Cost (Rp) Delta (Rp) Delta (%) Risks/Code
I PRE - CONSTRUCTION 91,144,128.00 none
II SPUN PILE FOUNDATION 3,885,167,180.54 4,811,821,645.00 926,654,464.46 24% A , D
ITS FMIPA TOWER CONSTRUCTION
Total :
Both earlier tables (table 5.3 and 5.4) presented clearly how the time-cost risk approach improves project scheduling. Besides, as shown in figure 5.5 the risks were assigned according to their starting date. Note that the percentile delta in these tables does not match fully with the ranked coefficient; this is because the strong correlation between risks and project duration were based on project frame time and percentile delta for each WBS element delivery.
Table 5.5: Recap of the Time - Cost Risk Analysis
A= Materials availabilityThe recap table shows the difference between the current schedules without risks and changes when the possible time-cost control are acknowledged .In addition, it shows the most affected crucial tasks as well as summarizing the most relevant parameters towards ITS FMIPA Construction Project. Overall, the most important issue for time-cost risk analysis is to determine initial stage with a fixed date. Many new project managers still have trouble looking in the big picture and what to focus on. Time-Cost risk requires a quick response planning in order to unlike crisis management.
From this analysis can be inferred, Time-Cost risk make all difference into of project planning. Where the judgment expert also help to create and monitor a watch list of risks that are low priority, but are still identified as potential risks. A good result of project risks often lead Project managers strive to make their jobs looking easier and well-run project.
CHAPTER VI
FINAL CONSIDARATIONS
6.1 Conclusion
From the analyzed data and statistical techniques used in this final project, the following statements can be inferred.
1. From the literatures and consultation with construction management expert were identified many risks, qualified as variables of delays and cost controls for Indonesia construction project. Yet, not all variables of delays and cost risks impact the structural works directly. Thus, for ITS FMIPA Tower structural planning were acknowledged the following risks:
- Material availability - Weather condition - Labors availability - Poor Time estimation - Poor Cost estimation
2. Result of the normal Time-Cost estimation and with risks analysis:
a. The normal cost estimation for the structural project works is Rp.27,007,477,878.31 (Including 10% of tax) but with risks analysis it becomes Rp. 31,913,283,306. Expecting to overruns 18% from the normal cost .
b. The normal duration is 329 days but with risks analysis changes to 353 days. Expecting to be 7% ahead of the schedule.
c. Three most crucial tasks ranked and affecting on project duration are: third, second and fourth floor.
known as Poor time estimates, Weather condition, Material availability.
e. The outcome of each assigned risk depends on the current schedule. For instance the starting point of this project schedule assumed to start on 07/14/2017 and the outcome Mean shows that the completion time will be on 02/11/2019 without risks and 03/15/2019 with risks.
6.2 Suggestion
REFERENCES
Assed, José Alexandre (1986). Construção civil: viabilidade,
planejamento, controle. Rio de Janeiro: Livros Técnicos e Científicos, 1986. 95 p. (Translated into English under the title [Civil Construction: feasibility, planning, control. Rio de Janeiro: Scientific and Technical Books, 1986. 95 p.])
APM (2000). A Guide book by the Association for Project Management: The University of Birmingham. Business Roundtable (1983) More Construction for the Money.
Summary Report of the Construction Industry Cost Effectiveness Project, the Business Roundtable, New York. Baloi D, Price ADF (2003) Modeling global risk factors affecting construction costperformance. Int J Proj Manage;21(4):261–269. Cavinganac, J. (2009). Managing Risk in a Construction
Company [Internet]. Construction Business Owner. November [cited 2012 March 10].
Available:http://www.constructionbusinessowner.com/topics/in surance/constructioninsurance/ managing-risk-construction-company. Accessed 9 October 2016, 8am.
Chiavenato, Idalberto (1983). Introdução à Teoria geral da
Administração.3.ed. São Paulo: Atlas, 1983. (translated into English under the title [Introduction of general administration theory]).
Flyvbjerg, B, M K S Holm and S L Buhl (2004: “What Causes
Cost Overrun in Transport Infrastructure Projects?”, Transport Reviews, 24 (1), 3-18.
Haskell, P.H(2004).: Construction Industry Productivity, America’s Design-Build Leader.
Proceedings of the 30th Annual Project M anagement Institute Seminars & Symposium, 10-16 October: Project Management Institute; 2000.
Kaplan Financial Knowledge Bank, (2012): Traditional approach of rational planning,[Internet] Available:
http://kfknowledgebank.kaplan.co.uk, Accessed 15 October 2016, 9pm.
Kaming, P.F.; Olomolaiye, P.O.; Holt, G.D and Harris, F.C.
(1997) Factors Influencing Construction Time and Cost Overruns on High-Rise Projects in Indonesia. Construction Management and Economics, Vol. 15, 83-94.
John Wiley & Sons (2009), Indianapolis: Wysocki RK. Effective Project Management: Traditional, Agile, Extreme. .
Nerija and Banaitiene (2011), Risk Management in Construction Projects, Chapter 19 [Internet] Available:
http://www.intechopen.com/books/risk-management-current- issues-and-challenges/risk-management-in-construction-projects. Accessed 3 October 2016, 7pm.
PMI (2008). Guide to the Project Management Body of Knowledge (PMBOK® Guide). 4th ed. Newtown Square:
Project Management Institute.
Palacios, Victor Hugo R; Villacreses, Xavier Esteban R.(1995).
Raz Z, Shenhar AJ, Dvir D (2002). Risk Management, Project Success and Technological Uncertainty; 32(2):101–109. Shruti, Gauri (2009). Project Management (PMP)
Why scheduling is important? – Available: http://www.careerride.com/pmp-scheduling.aspx. Accessed 20 September 2016, 10pm
Tririgunarsyah, B. (2004). Constructability Practices among
Construction Contractors in Indonesia, Journal of Construction Engineering and Management, 130 (5) 656-665.
Wideman R.M, (1981), Managing the Development of Building
Projects for Better Results, updated for web presentation, December, 2000 Wysocki RK. Effective project management: traditional, agile, extreme. Indianapolis: John Wiley & Sons; 2009.
Zhu. K. and Lin.L., (2004), A stage – by – stage Factor Control
Frame work for cost Estimation of construction projects, Owners Driving Innovation International Conference.
APPENDICES
QUESTIONNAIRE FORM
•
What kind of risks should be considered for ITS FMIPA Tower Planning?
`
Risks? Mitigation/ Impact?
<1> PRE-CONSTRUCTION 91,144,128.00 <2> STRUCRURAL ACTIVITIES
I Sub-Structure
1 Spun Pile (Foundation) 2,844,694,297 Sub-Structure Sewage Treatment Plant (ST Slab and Shear Wall III Upper Structure
a Ground Floor b First to Third Floor c Fourth to Six Floor d Seven to Ten Floor
17,731,247,011
Normal project duration 27,007,477,878.31
Variables of cost control / Risks
No WBS Elements Normal Cost (Rp) Experte Response
II
1 Spun Pile (Foundation) 27 Sub-Structure Sewage Treatment Plant (ST Slab and Shear Wall III Upper Structure
a Ground Floor b First to Third Floor c Fourth to Six Floor d Seven to Ten Floor
Normal project duration 329 II
71
214
Variables of time control / Risks
`
Risks? Mitigation/ Impact?
<1> PRE-CONSTRUCTION 91,144,128.00 <2> STRUCRURAL ACTIVITIES
I Sub-Structure
1 Spun Pile (Foundation) 2,844,694,297 Materials Availability 10 – 25% Sub-Structure Materials Availability 10 – 25% Bauwplank Installation Weather Condition 5 – 10% Soil excavation Labors Availability 5 – 10% Sheet pile installation
Joining Spun pile Concreting Pile Cap Ground floor beam Concreting Ground Water Ta Sewage Treatment Plant (ST Slab and Shear Wall III Upper Structure
a Ground Floor
b First to Third Floor Labors Availability 5 – 10% c Fourth to Six Floor
d Seven to Ten Floor
Normal project duration 27,007,477,878.31
Weather Condition
10 – 25% Materials Availability
Materials Availability 10 – 25%
5 – 10%
Variables of cost control / Risks
No WBS Elements Normal Cost (Rp) Experte Response
II
1 Spun Pile (Foundation) 27 Materials Availability 10 – 30% Weather Condition 10 – 25% Sub-Structure
Bauwplank Installation Weather Condition 10 – 30% Soil excavation Labors Availability 10 – 25% Sheet pile installation
Joining Spun pile Concreting Pile Cap Ground floor beam Concreting Ground Water Ta Sewage Treatment Plant (ST Slab and Shear Wall III Upper Structure
a Ground Floor Weather Condition 10 – 30%
b First to Third Floor Material Availability 10 – 30% c Fourth to Six Floor Labors Availability 10 – 25% d Seven to Ten Floor
Variables of time control / Risks
II
71
214
Normal project duration 329
No WBS Elements Normal Duration (days) Experte Response
Project Manager: TRI JOKO WAHYU, ST., MT, Ph. D Institution/Firm: ITS CAMPUS
`
Risks? Mitigation/ Impact?
<1> PRE-CONSTRUCTION 91,144,128.00 <2> STRUCRURAL ACTIVITIES
I Sub-Structure
1 Spun Pile (Foundation) 2,844,694,297 Sub-Structure
Bauwplank Installation Soil excavation
Sheet pile installation 1 – 3%
Joining Spun pile ( Re-estimate
Concreting Pile Cap if needful)
Ground floor beam Concreting Ground Water Ta Sewage Treatment Plant (ST Slab and Shear Wall III Upper Structure
a Ground Floor 1 – 3%
b First to Third Floor ( Re-estimate
c Fourth to Six Floor if needful)
d Seven to Ten Floor
17,731,247,011 Poor time estimates
Variables of cost control / Risks
No WBS Elements Normal Cost (Rp) Experte Response
II
2,844,694,297 Poor time estimates
“I truly agree with the previous correspondent, those qualitative risks are the most common issues faced by Indonesian contractors. Yet, from my experience also it is necessary to consider risks like poor
time-cost estimates,” Stated Mr. Toriq. Notice, this interview was direct with the correspondent.
`
Risks? Mitigation/ Impact ?
<1> PRE-CONSTRUCTION 17
<2> STRUCRURAL ACTIVITIES I Sub-Structure
1 Spun Pile (Foundation) 27 Sub-Structure
Bauwplank Installation
Soil excavation 1 – 3%
Sheet pile installation Poor time estimates ( Re-estimate
Joining Spun pile if needful)
Concreting Pile Cap Ground floor beam Concreting Ground Water Ta Sewage Treatment Plant (ST Slab and Shear Wall III Upper Structure
a Ground Floor
b First to Third Floor 1 – 3%
c Fourth to Six Floor Poor time estimates ( Re-estimate
d Seven to Ten Floor if needful)
Normal project duration 329 II
71
214
Variables of time control / Risks
No WBS Elements Normal Duration (days) Experte Response
Profile:
Project Manager: TORIQ ARIF, ST., MT., CIPM Experience : 12 YEARS
Type
Quantity width height Length Volume DIAMETER Amount TOTAL Weight bh m m m point DIAMETER (Bar) (m) kg/m
beton (m3) B C=A*B 0.006165
1 Triangles 20 1.5 0.16 0.3 1.852 13 3 1.06 1.10
•
TAKE-OFF VOLUME SAMPLES
I.
Column
II.
Shear Wall
III.
Stairs from Sixth Floor
•
Quantity type Number
of floor width height Length Volume DIAMETER Amount TOTAL Weight
bh Floor m m m Point DIAMETER (bar) (m) kg/m Concrete (m3) B C=A*B 0.006165
1 C1 14 1 0.75 0.75 4.20 33.08 20 7 1605.24 4258.86
Stirrup 29.00 12 2.84 1210.69 1074.80
2 C2 20 1 0.5 1 4.20 42 20 20 1519.00 3753.75
Stirrup 12 3.14 158.26 36.76
75.08 9124.18
No Colunm
type Illustration
Total :
Take-off volume from Sixth to tenth floor ( 4.2 m height)
Numeber
of type width height Length Volume DIAMETER Amount TOTAL Weight
bh m m m pint DIAMETER (Bar) (m) kg/m
beton (m3) B C=A*B 0.006165
1 Shear
Wall 1 1 0.4 4.2 5.8 9.744 16 131.92 382.57 603.78
Stirrup 8 162.40 1364.16 568.24
2 Shear
Wall 1 2 0.4 4.2 3.2 10.752 16 145.36 465.15 734.12149
Stirrup 13 89.60 1860.61 969.27
3 Shear
Wall 2 1 0.4 4.2 5.8 9.84 16 131.92 382.57 603.78 Stirrup 13 162.40 1364.16 568.24
30.34 4047.45
Shear wall type Illustraction