Development of Robust and Redesigning
Cellular Manufacturing System Model
Considering Routing Flexibility, Setup Cost, and Demand
Changes
Muhammad Shodiq Abdul Khannan†
Department of Industrial Engineering, Faculty of Engineering Sarjanawiyata Tamansiswa University, Indonesia
Tel: (+62) 274-562-265 Fax: (+62) 274-547-042 E-ma
AnasMaruf
Department of Industrial Engineering Institut Teknologi Bandung, Indonesia
Tel/Fax: (+62) 22-2506449 Email: [email protected]
Abstract.In designing Cellular Manufacturing System (CMS), there are many aspects that require consideration. Among of them are machine capacity, alternative routing process, intra-cell and inter-cell material handling cost and setup cost. Due to these considerations, this study proposes two models: Robust CMS and Redesigning CMS. Both models have the same objective function which is minimizing total cost of the CMS layout design. The total cost consists of machinery depreciation cost, operating costs, inter-cell material handling cost, intra-cell material handling cost, machine relocation costs and setup costs. Robust CMS is a CMS where the machine-cell configuration is fixed during the whole planning period. Redesigning CMS is a CMS where its machine-cell configuration may change during the planning period due to the demand changes. The proposed model for both systems is an integer linear programming model. Numerical examples are elaborated in the paper to depict the influence of changes in demand and total cost.
Keywords:Robust CMS, Redesigning CMS, Routing Flexibility, Setup Cost, demand.
1. INTRODUCTION
Cellular Manufacturing System (CMS) is an application of Group Technology that combines the speed of flow shop and the flexibility of job shop. Beside its benefit, Cellular Manufacturing System design has a low capability to cope with demand changes (Ebara, 2006). In designing CMS, there are many aspects requiring consideration. Among of them are machine capacity, alternative routing process, intra-cell and inter-cell material handling cost and setup cost. Ebara (2006) developed two models in order coping with demand changes: flexible cells that resistance with the changes and redesign cells that adapt and respond to the changes. Flexible CMS, later will be named as Robust CMS, is a CMS where the machine-cell configuration is fixed during the whole planning period. Redesigning CMS is a CMS where its machine-cell configuration may change due to the demand changes
during the planning period. Model developed by Ebara (2006) has not considered machine capacity yet. Machine capacity should be considered to ensure that the incoming demand can be processed bythe machine resources. The Objective of this model is to minimize the total material handling cost.
2. LITERATURE REVIEW
Cellular Manufacturing System has been intensively studied in the last three decades. CMS design divides into two strategies: based on similarity coefficient/group technology (Askin, 1997; Shafer, 1993) and machine-cell strategy (Ebara, 2006; Jayakumar, 2010;Javadian, 2011).
There are many design objectives in CMS Design (Garbie, 2008). These objectives are to minimize intra-cell and inter-cell material handling costs (Ebara, 2006), to minimize the machine relocation costs, operating cost, and amortized cost (Jayakumar, 2010), to minimize the machine load variation, to minimize the operating costs, to minimize capital investment, to maximize of resource (machine and labor) utilization, and to maximize the output (Garbie, 2008). Constraint functions considered in CMS design are capacity constraint, routing constraint, and maximum cell size constraint (Jayakumar 2010). Ebara (2006) did not consider capacity contraint in CMS design. In designing CMS, in order coping with demand changes, there are two design categories: Robust CMS (Pillai, 2007) and Redesigning CMS (Jayakumar, 2010). Ebara (2006) developed these two models. In the design of CMS, most cell formation techniques can be separated into two main techniques: mathematical programming (Linear, Programming, Integer Programming and Dynamic Programming) and heuristics approaches (Garbie, 2008). Some models that used mathematical programming are Ebara (2006) and Jayakumar (2010). Tavakoli (2006) used metaheuristic for solving the problem. Javadian (2011) proposed non-dominated sorting genetic algorithm (NSAGAII) as design technique to solve the problem. .
According to the literature review, this study proposes two models: Robust CMS and Redesigning CMS considering Routing Flexibility, Setup Cost, and Demand Changes. This model used Integer Linear Programming to solve the problem.
3. THE MATHEMATICAL MODEL
The Proposed Model is developed mostly based on Ebara (2006) and Jayakumar (2010). This study proposed two models: Robust CMS and Redesigning CMS. The objective function is minimizing the total cost of the CMS layout design. The total cost consists of machinery depreciation cost, operating costs, inter-cell material handling cost, intra-cell material handling cost, machine relocation costs and setup costs.
Assumption:
Following assumptions are made for the development of the model: operating time and demand are known and
deterministic. Demand may change at each planning periods. Operating cost, amortized cost, relocation cost and setup cost are known. Number of machine is fixed during planning periods.
Notation Index
C index for manufacturing cell (c=1, …, C) m index for machine type (m=1, …, M) p index for part type (p=1, …, P)
j index for operation need by part p (j=1, …, Op) h index for time periods (h=1,…,H)
Parameter Input
P number of part type
Op number of operation for each part types
M number of machine types
C maximum number that cell can be developed H number of periods
Bpinter batch size for inter-cell movements of part
type p
Bpintra batch size for inter-cell movements of part
type p
Cinter inter-cell material handling cost per batch Cintra intra-cell material handling cost per batch Cre redesign cost including install, shifting and
uninstalling
Camorm amortized cost of machine of type m per period
Coperm operating cost of machine type m for each unit
time
Finter inter-cell material handling cost (robust) Fintra intra-cell material handling cost(robust) Rintra intra-cell material handling cost (redesign) Rre redesign cost including install, shifting and
uninstalling (redesign) Setuppm setup cost for part p { $/setup}
Sjpm setup cost for individual operation j for part p at
machine type m {$/operation}
UB maximal cell size i.e., maximum number of machines per cell
Dph demand for part type p at period h
ajpm = 1, if operation j of part type p can be done on
machine type m; 0, otherwise
tjpm processing time required to process operation j
of part type p on machine type m (hour)
Tm time capacity of machine m in terms of unit time (hours) for each period.
Decision variable Robust CMS
Nmc number of machines of type m assigned to cell c
xjpmc 1, if operation j of part type p is done on
Redesigning CMS
Nmch number of machines of type m assigned to cell c
in period h Mathematical Formulation
A. Robust CMS Objective Function Minimize
(i). Amortized cost
𝐹𝑎𝑚𝑜𝑟𝑡𝑖𝑧𝑒𝑑=𝐻 � � 𝑁 (ii). Operating Cost
𝐹𝑜𝑝𝑒𝑟𝑎𝑡𝑖𝑛𝑔=𝐻 � � � � 𝐶𝑜𝑝𝑒𝑟𝐷𝑝𝑡𝑗𝑝𝑚𝑥𝑗𝑝𝑚𝑐
(iii). Setup Cost
𝐹𝑠𝑒𝑡𝑢𝑝=� �� � 𝑆𝑒𝑡𝑢𝑝
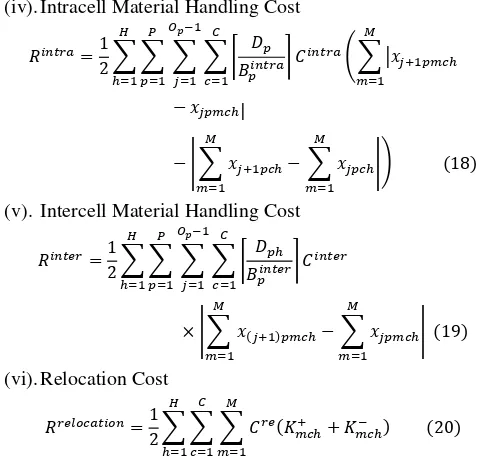
(iv). Intracell Material Handling Cost
𝐹𝑖𝑛𝑡𝑟𝑎=𝐻 � � � � 𝐷𝑝
(v). Intercell Material Handling Cost
𝐹𝑖𝑛𝑡𝑒𝑟=𝐻 � � � � 𝐷𝑝ℎ
The objective function of Robust CMS is minimizing total CMS design cost (1) which is consist of amortized cost (5), operating cost (6), setup cost (7), intra-cell material handling cost (8) and inter-cell material handling cost (9). Equation (2) is Routing constraint to ensure each part operation is processed only on one machine among several alternative machines that able to do the process (routing flexibility). Capacity constraint (3) is to ensure machine capacity is not exceeded and to determine the number of each machine type in each cell. Maximum cell size constraint (4) ensures the number of machines allocated to each cell does not exceed the maximum size of the cell.
A. Redesigning CMS
Objective Function Minimize (i). Amortized cost
𝑅𝑎𝑚𝑜𝑟𝑡𝑖𝑧𝑒𝑑=� � � 𝑁 (ii).Operating Cost
𝑅𝑜𝑝𝑒𝑟𝑎𝑡𝑖𝑛𝑔=� � � � � 𝐶
(iii).Setup Cost
(iv).Intracell Material Handling Cost
(v). Intercell Material Handling Cost
𝑅𝑖𝑛𝑡𝑒𝑟 =1
(vi).Relocation Cost
𝑅𝑟𝑒𝑙𝑜𝑐𝑎𝑡𝑖𝑜𝑛=1
The objective function of Redesigning CMS is minimizing total CMS design cost (14) which consists of amortized cost (15), operating cost (16), setup cost (17), intra-cell material handling cost (18), inter-cell material handling cost (19), and relocation costv(20).
Equation (11) is Routing constraint to ensure each part operation is processed only on one machine among several alternative machines that able to do the process (routing
flexibility). Capacity constraint (12) is to ensure machine capacity is not exceeded and to determine the number of each machine type in each cell. Maximum cell size constraint (13) ensures the number of machines allocated to each cell does not exceed the maximum size of the cell. Balance constraint (14) ensures the number of machines is always the same after reconfigurationis conducted.
5. CASE STUDY AND COMPUTATIONAL RESULT
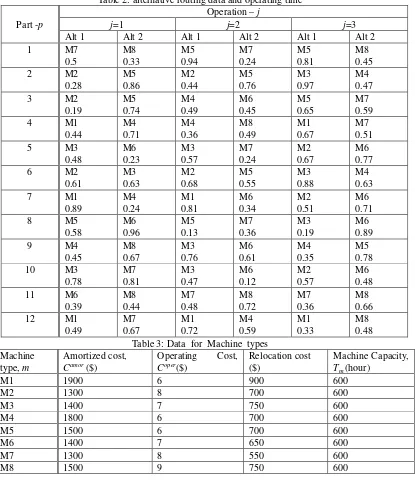
The Numerical Test use the data taken from Jayakumar (2010) which consists of 12 parts and 8 machines with an alternative routing. Data for each part type such as the machine cost, the operating cost per hour, the relocation cost, and the time capacity of each machine provided in Table 1. The units of intercell and intracell material handling costs per batch are considered constant and did not consider the distance travelled. Their values used are $40 and $6 respectively. Batch size inter-cell each part type is different around 25 to 45 units/ movement. Batch size intra –cell is different for each part type. Demand for each part type might change during each period. For example demand of part type P1 at period 1 is 400 units, at period 2 is 650 units and period 3 is zero. Redesigning CMS model usethe demand on rolling period h1, h2 and h3 to design the model while Robust CMS used the average demand.
Table 1:Data for Part types. Part type,
p
batch size inter-cell,
batch size Intra-cell, batch,Cintr
Table 2: alternative routing data and operating time Table 3: Data for Machine types
Machine type, m
Amortized cost, Camor ($)
Operating Cost, Coper($)
Relocation cost ($)
Machine Capacity, Tm (hour)
Computational Result:
M1
Figure 1 shows the Machine-cell configuration for Robust CMS.Two units of machine types M4, and one unit of machine type M1, M2 and M7 are assigned at Cell 1. One unit of machine type M3, M4, M5 and M6 are assigned at Cell 2. One unit of machine type M1, M6 and M7 are assigned at Cell 3. This configuration is fixed during planning period.
In Table 4, routing operation for each part type p are provided. For example, the first and second operations of part type P1 are performed on machine types M7 in cell 1 and the
third operation is performed on machine type M5 in Cell 2 ; thus part type P1 needs one inter-cell movement (between cell 1 and cell2). On part type P2, the first and second operations are performed on machine type 2 at Cell 1 therefore there is one intra-cell movement (between machine types M2 and M4 in cell 1). In the similar way, inter-cell movement occurs when batches of part type P3 are moved from cell 1 (where first operation is done on machine type M2 and second operation is done on machine type M4) to cell 3 (where third operation is done on machine type M7).
Table 4: Routing Robust CMS
Part type, p Routing, Machine-Cell P1
P2 P3 P4 P5 P6 P7 P8 P9 P10 P11 P12
7(1) – 7(1) – 5(2) 2(1) – 2(1) – 4(1) 2(1) – 4(1) – 7(3) 4(1) – 4(1) – 7(1) 6(3) – 7(3) – 2(1) 2(1) – 2(1) – 4(2) 4(2) – 6(3) – 7(3) 5(2) – 5(2) – 3(2) 4(2) – 6(3) – 4(2) 3(2) – 6(3) – 6(2) 6(2) – 7(3) – 7(3) 1(2) – 1(3) – 1(3)
Machine-cell configuration for Robust CMS is shown at figure 2:
M1
M7 M7
M6
M2 M3
M5 M4 M3
M1 M4 M4 Cell 1
Cell 3 Cell 2
M1
M6 M5
M4
M2 M3
M1
M3
M4 M4 Cell 1
Cell 3 Cell 2
M1
M5 M4
M3 M3
M2
M4
M6 M7 M6 Cell 1
Cell 3 Cell 2
H
Periode h1 Periode h2 Periode h3
M7
M7
M8
M6 M8
M7 M1
M2
Figure 2: Machine-Cell Configuration Redesigning CMS
Machine-cell configuration for Redesigning CMS at Figure 2 shows that the machine-cell configuration might change during rolling period h1, h2 and h3. At period h1, two units of machine type M7, and one unit of machine type M1, M2 and M6 are assigned at Cell 1. Two unit of machine type M3 and one unit of machine type M4 and M5 are assigned at Cell 2. Two units Machine type M4 and one unit of machine type M1, M6 and M8 are assigned at Cell 3. At period h2, one unit of machine type M1, M2, M4, M5 and M6 are assigned at Cell 1. Two units of machine type M3 are assigned at Cell 2. Two unitsmachine type M4 and One
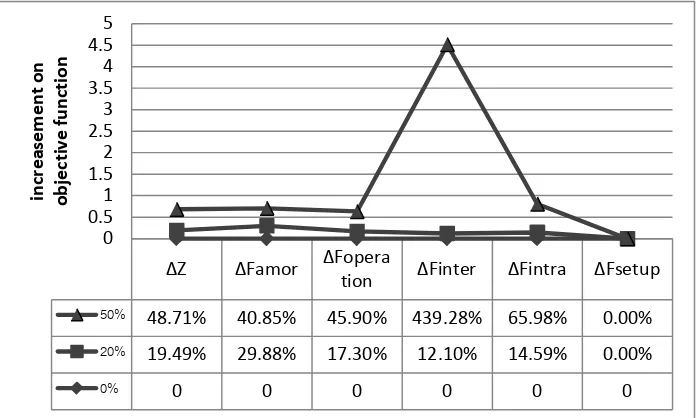
ΔZ ΔFamor ΔFopera
tion ΔFinter ΔFintra ΔFsetup
50% 48.71% 40.85% 45.90% 439.28% 65.98% 0.00%
20% 19.49% 29.88% 17.30% 12.10% 14.59% 0.00%
0% 0 0 0 0 0 0
0 0.5 1 1.5 2 2.5 3 3.5 4 4.5 5
in
cr
ea
sem
en
t o
n
o
b
jec
ti
v
e f
u
n
ct
io
n
Table 5: Routing Redesigning CMS
Part type Routing, Machine(Xjpmch)
Period 1, h1 Period 2, h2 Period 3, h3
P1 P2 P3 P4 P5 P6 P7 P8 P9 P10 P11 P12
8(3) – 7(1) – 8(3) 6(1) – 2(1) – 4(2) is not produced 1(3) – 3(1) – 1(3) 6(3) – 7(1) – 6(1) is not produced 4(3) – 6(1) – 2(1) 5(2) – 5(2) – 3(2) 4(3) – 6(3) – 4(3) 3(2) – 6(2) – 6(2) is not produced 1(1) – 1(1) – 1(1)
7(3) – 7(3) – 8(3) is not produced 2(1) – 6(1) – 5(1) 1(1) – 6(1) – 1(3) is not produced 2(1) – 5(1) – 4(3)
is not produced is not produced 3(1) – 3(2) – 4(3) 3(2) – 6(1) – 6(1) is not produced 1(1) – 7(3) – 1(1)
is not produced 6(3) – 2(2) – 4(2)
is not produced 1(3) – 4(1) – 7(2) 6(3) – 7(3) – 2(3) 3(1) – 5(1) – 4(1) 4(2) – 6(3) – 6(3) 5(1) – 5(1) – 3(1) is not produced 3(1) – 6(3) – 6(3) 6(3) – 7(3) – 7(3) is not produced
In Table 5, routing operation for each part type p are provided and are different for each rolling period h1, h2 and h3. For example, at period h1 part type P1, the first operation is performed on machine type M8 in cell 3, the second operation is done on machine type M7 in Cell 1 and third operations of part type P1 is performed on machine types M) in cell 3 and; thus part type P1 needs two inter-cell movements (between cell 3 and cell1). At period h2, Part type P1 all operations are performed in cell 3 with machine type M7, M7 and M8. At period h3, part type P1 is not produced
since demand at this period is zero (Table 1). In similar way, at period h1, Part type P2, the first and second operations are performed at Cell 1 (on machine type M6 and M2) and third operation are performed Cell 2 on machine type M4. At period h2 part type P2 is not produced since demand is zero. At period 3, Part type P2 the first operation is performed at Cell 3 on machine type M6 and second operation are performed at Cell 2 with machine type M2 and third operation are performed Cell 2 with machine type M4.
Sensitivity Analysis
Figure 3: Sensitivity Analysis of Demand Changes on objective function
Sensitivity analysis performed to see the effects of input parameters changes on the objective function. Sensitivity analysis performed for the two input parameters: demand
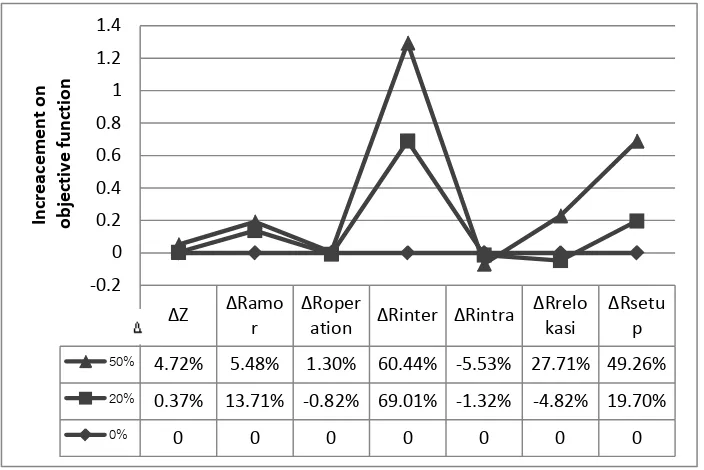
ΔZ ΔRamo r
ΔRoper
ation ΔRinter ΔRintra
ΔRrelo
kasi
ΔRsetu
p
50% 4.72% 5.48% 1.30% 60.44% -5.53% 27.71% 49.26%
20% 0.37% 13.71% -0.82% 69.01% -1.32% -4.82% 19.70%
0% 0 0 0 0 0 0 0
-0.2 0 0.2 0.4 0.6 0.8 1 1.2 1.4
In
cr
ea
cem
en
t o
n
o
b
jec
ti
v
e f
u
n
ct
io
n
so the operations must be processed in a machine outside the cell. Operating costs is linearly rising when demand is increased. Operating cost equals time (tjpm) multiplied by
the Demand for each part p (Dp) so that when demand is
rising operating costs is rising too. Setup cost is not affected by demand changes because the number of machines used is not changed.
Figure 4 : Sensitivity Analysis of Setup Parameter Changes to Objective Function
Figure 4 shows that if the setup cost parameter increased by 50%, it will increase inter-cellular material handling cost 60.44%, relocation cost 27.71% and total setup cost 49.26% and decrease intra-cellular material handling cost 5.53%. Meanwhile, if the setup costs parameter increased by 20% , it will increase inter-cellular material handling 69.01% and decrease inter-cellular material handling cost 1.32% while total setup cost increased by19.70%. The increase in setup cost parameter (Δsetup) tends to increase the setup cost (ΔRsetup) linearly, material handling cost (ΔRintra) decrease and Inter-cell material handling cost (ΔRinter) increase. This means the jobs for processing demand mostly performed inter-cell.
5. CONCLUSION
In this study, two models, Robust and Redesigning Cellular Manufacturing System were developed. Both models consider the setup cost, machine capacity and demand changes. The results show that the setup cost should be considered in Cellular Manufacturing System design because it made a different machine configuration. In other words, CMS configuration is case sensitive to the changes of the setup cost. Robust CMS best for non-fluctuating demand and Redesigning CMS best for fluctuating demand.
REFERENCES
Askin, R., Selim, H., and Vakharia, A. (1997)A Methodology for Designing Flexible Cellular Manufacturing Systems, IIE Transactions 29 (7), 599–610.
Damayanti, D.D., Cakravastia, Maruf A., Wiraatmadja I.I. (2007) Product family assembly line design in dynamic production environment, Proceedings of the 7th Asia Pacific
Industrial Engineering and Management Systems Conference, Bangkok, Thailand.
Ebara, H., Hirotani, D., Takahashi, K., and Morikawa, K. (2006) Cellular Manufacturing System Capable of Responding to Changes in Demand, Reconfigurable Manufacturing System and Transformable Factories, Springer-Verlag Berlin Heidelberg, chapter III, 341-353.
Garbie, I.H., Parsaei, H.R., and Leep, H.R. (2008) Designing Cellular Manufacturing for Next Generation Production Systems, Collaborative Engineering: Theory and Practice, Springer Science + Business Media, LLC
Jayakumar, V. and Raju, R. (2010), An Adaptive Cellular Manufacturing System Design with Routing Flexibility and Dynamic System Reconfiguration, European Journal of Scientific Research Vol. 47 No.4, 595-611.
Pillai. V. M., and K. Subbarao, (2007) A Robust Cellular Manufacturing System Design For Dynamic Part Population using a Genetic Algorithm, International Journal of Production Research, pp. 1-20.
Shafer, S.Μ.and Rogers, D.F. (1993) Similarity and distance measures for cellular manufacturing. Part II: An extension and comparison, International Journal of Production Research, 31, 1315–1326.
Tavakkoli-Moghaddam. R., M. B. Aryanezhad, N. Safaei, and A. Azaron, (2005) Solving a Dynamic Cell Formation Problem using Meta-heuristics, Applied Mathematics and Computation 170(2), 761–780.
AUTHOR BIOGRAPHIES
Muhammad Shodiq Abdul Khannan is a lecturer in Department of Industrial Engineering, Faculty of Engineering Sarjanawiyata Tamansiswa University, Yogyakarta, Indonesia. He received a Master of Industrial Engineering, at Bandung Institute of Technology in2012.
His research interests include Cellular Manufacturing System and Collaborative Production Planning. His email address is <[email protected]>