Low temperature hydrothermal synthesis of calcium phosphate ceramics: Effect of
excess Ca precursor on phase behaviour
Asep Sofwan Faturohman Alqapa, b & Iis Sopyana, *
aDepartment of Manufacturing and Materials Engineering, Faculty of Engineering, International Islamic University Malaysia (IIUM),
P O Box 10, Kuala Lumpur 50728, Malaysia
bMechanical Engineering Program, Faculty of Engineering, University of Bengkulu, Jalan Raya Kandang Limun,
Bengkulu 38000, Indonesia Email: [email protected]
Received 31 July 2009; revised and accepted 20 October 2009
Low temperature hydrothermal exchange reaction has been used to synthesize calcium phosphate materials comprising hydroxyapatite and -tricalcium phosphate using CaO and NH4H2PO4 as calcium and phosphorus precursors respectively.
The effect of excess of calcium precursor on phase behaviour of these materials has been investigated by varying CaO content (0, 10 and 20 mole% excess of 0.1 mole CaO) in the suspension. The as-synthesized paste has been dried followed by calcination at 700-1200 ºC. Results show the formation of Ca-deficient apatite at the lower calcination temperature. Excess of CaO shifts the balance to hydroxyapatite formation at the higher calcination temperature such that -tricalcium phosphate, -tricalcium phosphate + hydroxyapatite and hydroxyapatite of higher purity are obtained with 0, 10 and 20 mole% excess CaO, respectively.
Keywords: Hydrothermal synthesis, Hydroxyapatites, Calcium deficient apatites, Calcination, Ceramics,
Calcium phosphates
IPC Code: Int. Cl.9 C04B35/447
Calcium phosphate has been studied as bone repair materials for the last 80 years1. The use of calcium
phosphate biomaterials, particularly hydroxyapatite (HA) and tricalcium phosphate (TCP), has gained popularity due to their excellent biocompatibility, bioactivity and osteoconductivity attributed to the close chemical resemblance with the mineral component of natural bone and teeth2,3. HA and TCP
have been used, not only for bone implant substitute materials1,2, but have also been identified for
applicability as drug delivery4, antiseptics5, food
supplements6, and hyperthermia treatment agents7,8.
The potential of the material as anticancer agent has been investigated and it has been found that nanoscale HA is effective in inhibiting cancer cells growth9,10.
The success of calcium phosphate-based biomate-rials in biomedical application depends largely on the availability of highly pure, crystalline HA with fine particle size, enabling improved biological and me-chanical properties. Intensive studies on calcium phosphate involving a wide range of powder process-ing techniques have been carried out with the aim of producing HA powder with well defined particle morphology11. Numerous synthesis techniques have
been developed to produce HA such as solid state re-action, microwave processing, pH shockwave,
hydro-thermal and wet precipitation. Differences in the preparative routes lead to variations in morphology, stoichiometry, and level of crystallinity. Amongst these methods, the most commonly used technique is the precipitation technique involving wet chemical reactions between calcium and phosphorus precursors under controlled temperature and pH conditions.
Other methods such as sol-gel, spray pyrolysis and mechano-chemical method, have also been developed and well documented12,13. The advantage of the wet
precipitation technique which involves aqueous solu-tion is that its by-product is mostly water and the probability of contamination during processing is very low11. However, a long ageing time is required to
al-low the precipitation reaction to end, as keeping the single ion concentration uniform during the precipita-tion stage is very difficult14. Although many studies
ALQAP & SOPYAN: LOW TEMPERATURE HYDROTHERMAL SYNTHESIS OF CALCIUM PHOSPHATE CERAMICS 1493
Materials and Methods
The apatite based calcium phosphate was prepared using calcium oxide granules (CaO) (Techno Pharmchem, India) and ammonium di-hydrogen phosphate (NH4H2PO4) (Systerm, Malaysia) as the
precursors with distilled water as the solvent. For the preparation of the solution, stoichiometric weight of 0.1 mole calcium oxide was mixed in 100 ml distilled water with vigorous stirring to get a soluble suspension. Into this suspension, ammonium dihydrogen phosphate powder on the base of 1.67 Ca/P was then added dropwise such that the fluidity of the suspension remained constant. The suspension was heated until its temperature reached 90 °C when a paste was obtained. The overall process may be
The paste was dried overnight at 80 °C in a drying oven before the next characterization. Three samples were synthesized: Ca-0 for no CaO excess, Ca-1 for
10 mole% excess CaO and Ca-2 for 20 mole% excess
CaO added to 0.1 mole CaO as the stoichiometric basis. The prepared powders were then calcined in a Protherm PLF 160/5 furnace at 700-1200 °C. A heating rate of 10 °C min-¹ was applied until the
required temperature was reached and then the heating was continued for 1 hour.
To identify the functional groups of the samples, Fourier transform infrared (FTIR) spectra were recorded using a Perkin-Elmer Spectrum 100 FTIR spectrometer over 4000-400 cm-1 with scanning range
at a 4 cm-1 resolution. Using CuK radiation ( =
1.5406 nm), X-ray diffraction pattern were obtained on a Shimadzu XRD 6000 diffractometer. Scan speed of 2o per minute and a step size of 0.02o over the 2
range of 20-50o were used. Crystallographic
identification of the phases of synthesized apatite was done by comparing the experimental XRD patterns to standards of the Joint Committee on Powder Diffraction Standards (JCPDS) card number 09-0432, Markovic et al.’s published data for HA15,
JCPDS 09-169 whitlockite mineral and Ermrich & Peters published data for -tricalcium phosphate16.
The as-synthesized powders were subjected to thermal analysis using a heating rate of 2 °C min-1
over 30-1150 °C in air atmosphere using a Perkin-Elmer Phyris Diamond TG-DTA instrument.
Results and Discussion FTIR spectra
To study the evolution of functional groups in the samples calcined at different temperatures, the FTIR spectra of the samples were analysed. The functional groups normally observed in the FTIR of calcium
OH- ions, i.e., stretching, vibrational, and translational
modes at 3700-2500, 630 and 390 cm-1,
2200-1950 cm–1 region15,17.Water molecules appear at
1642 cm-1 but may be obscured by the CO
replace OH– ions in the HA lattice (designated as the
“A-type” carbonate), if any, are at 1455 cm–1 and
1540 cm–1 (ref. 20).
Figure 1 shows the representative FTIR spectra for the sample Ca-0, calcined at 700, 900, and 1200 °C. These are at 3700-2600 of OH- (stretching), at 1643 of
water molecules or CO3, and at 1442-1419 of CO3.
No change in position is observed for the bands at 1089, 1020, and 600 cm-1 over the calcination range of
700-1200oC. Along with the band at 958 cm-1 PO 4 ( 1)
observed in the sample calcined at 700oC, in sample
calcined at 800oC, two new bands at 970 and
945 cm-1; these are observed in samples calcined up to
1200oC. The band at 875 cm-1 for HPO
4 and at
800oC and instead, the band for P
2O7 appears at
727 cm-1; the band intensity tends to increase up to
1200oC. The PO
4 band at 600 cm-1 appears at 700oC
with the band at 589 cm-1 appears weaker at the higher
temperature. The band at 559 cm-1 PO
4 ( 4) appears at
700oC with two new bands seen at 545 and 495 cm-1
at 800oC. The 495 cm-1 band still appears up to
1200oC, but the 545 band splits into two, to give
bands at 550 and 536 cm-1 at 1200oC. The
disappearing or reducing bands due to HPO4 and OH
along with appearance of band due to P2O7 and two
new bands of PO4 at 970 and 945 cm-1 show the
appearance of TCP in the samples as also confirmed by the X-ray data. It is noteworthy that non-single peak between 1019-900 and/or more than two peaks in the range 600-500 cm-1 are indicators of the
non-HA phase.
On heating at 800oC, the bands at 630 cm-1 due to
OH and at 875 cm-1 due to HPO
4 disappear, and band
due to P2O7 at 727 cm-1 arises. The band at 875 cm-1
is possibly due to replacement of PO4 by CO3 as
sug-gested by Santos & Clayton20. Besides the 958 cm-1
peak, two other peaks at 970 and 945 cm-1 appear. The
presence of these two peaks along with the 727 cm-1
peak indicates that the phase is -TCP,and not HA, as indicated from the X-ray patterns (shown later in Fig. 2). Moreover, not only is the 727 cm-1 band
ob-served but also seen are the bands at 1165 and 1124 cm-1 due to P
2O7 (ref. 21). With increasing
tem-perature, the unreacted phosphorus monomer may be
oxidized to HPO4, which then condenses to produce
P2O7 and H2O at higher temperatures.
The spectra of the sample Ca-1 calcined at 700oC
show the same peak positions as of the sample Ca-0,
i.e., bands at 1089, 1019, 958, 875, 630, 600, and 559 cm-1. However, there are changes in the spectra of
samples calcined at 800-1200oC. The 630 cm-1 OH
band increases in resolution up to 1000oC and then
decreases for the higher temperatures suggesting an increase and decrease in HA respectively. After 800oC, the 559 cm-1 PO
4 ( 4) blunts and other peaks
arise between 530 and 570 cm-1 as was observed for
sample Ca-0. The P2O7 band at 727 cm-1 appears after
800oC and becomes stronger up to 1100oC, but
disappears again at 1200oC. After 800oC, some new
peaks arise before and after the 958 PO4 ( 1) band
which becomes stronger up to 1100oC, but is
significantly reduced at 1200oC. All these suggest the
appearance of non-HA phase. The increase in number of peaks is also been in the range of 1200-1020 cm-1
along with increase in the P2O7 peak at 727 cm-1. The
functional group characteristics of the sample Ca-1
are not generally different from those of sample Ca-0,
except that the latter has no OH (librational) in its spectra after calcination at 800oC.
Fig. 1 – The IR spectra of sample Ca-0 calcined at (a) 700oC;
(b) 900oC and (c) 1200oC.
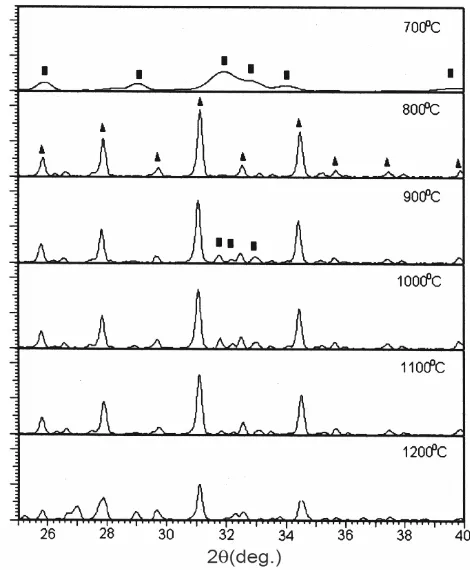
Fig. 2 – X-ray spectra of the sample Ca-0 calcined at temperatures
ALQAP & SOPYAN: LOW TEMPERATURE HYDROTHERMAL SYNTHESIS OF CALCIUM PHOSPHATE CERAMICS 1495
The increase in the 630 cm-1 OH band until 1000oC
and decrease above 1000oC, accompanied by the
appearance of 727 cm-1 P
2O7 band which decreases at
1200oC, and also the appearance of PO
4 peaks at 970
and 945 cm-1 are all indicators of the biphasic CaP,
i.e., containing both HA and -TCP. Therefore, it is concluded that the 970 and 945 cm-1 bands may be
attributed to -TCP. This is also supported by the fact that a decrease in resolution of the two peaks at 975 and 940 cm-1 was observed at 1200oC, indicating that
the appearance of -TCP is likely during the conversion process to another phase, which is most probably -TCP.
In the IR spectra of the sample Ca-2 calcined at
700-1200oC, the upper region, i.e., 4000-1300 cm-1,
shows the bands as observed in the samples Ca-0 and Ca-1 after calcination at 700oC; these disappear after
calcination at 800oC and above. The characteristic
characteristic peaks as mentioned earlier increase in transmittance with the increase in calcination temperatures and are stable up to 1100oC. The
transmittance of these peaks reduces after calcination at 1200oC, indicating a change in phase. The
characteristic peaks differentiate the sample Ca-2
from the other two samples, Ca-0 and Ca-1. Here it is
likely that HA exists as a single and stable phase at all calcination temperatures, unless the X-ray data indicates -TCP as trace.
The Ca-2 sample has a distinct IR pattern, and the
main peaks are stable at all the calcination tempera-tures. Particularly, the PO4 ( 1) remains as a single
peak at 958 cm-1 and the PO
4 ( 4) at 559 cm-1 is also
stable. It is also interesting to note that the existence of the CO3 and HPO4 bands in the range of 3800-1400
cm-1 do not affect the stability of the bands at 1089,
1019, 958, 600 and 559 cm-1 of PO
4 and at 630 cm-1
for OH, which was not been in the spectra of the Ca-0
and Ca-1 samples. All these six bands are
characteris-tics for HA as confirmed by the X-ray data. Thus, the sample Ca-2 has the IR spectra of the HA phase
pat-tern at all the higher temperatures. An increase in the amount of HA is also observed here, as observed by
the increase in intensity of the OH (librational) band in particular, and the characteristic companion peaks in general, with temperature. Even though P-OH or HPO4 bands are observed, the excess calcium
pre-vents the condensation reaction of HPO4 to P2O7 and
water. As a result, the transformation from CDHA to -TCP is not observed in the Ca-2 sample.
While the three samples after calcination at 700 oC
have the same spectra in general, but in more detail,
samples Ca-0 and Ca-1 at all heating temperatures is
not seen in sample Ca-2. This suggests that the
ap-pearance of PO4 ( 4) peak position has been affected
by calcium. After 800oC, P-OH or HPO
4 which is
ob-served in sample Ca-0 condenses to form P2O7 and
H2O immediately at this temperature or even at lower
calcination temperatures but with longer dwell time as suggested by Markovic et al.15 Once P2O7 appears and
OH disappears, the sample will have no more HA. The presence of H2O as the by-product of the HPO4
condensation reaction, or from water bonded to some intermediates, or even from the atmosphere is likely to affect the number of hydroxyl ions in the apatite crystal. However, as the hydroxyl ions in HA crystal occupies a site slightly above or below the triangular calcium plane, the replacement of hydroxyl, by carbonate for example, does not significantly affect the overall crystal system. A significant change will take place if carbonate is replaced by phosphate, leading to change in the a-lattice parameter22. Thus,
the presence of carbonate ions affects the order within the apatite structure. This is thought to yield disordered arrangement of phosphate ions that do not assemble in the expected hexagonal structure defining an ideal HA crystal system.
X-ray analysis
Figure 2 shows the X-ray patterns of the sample
Ca-0 calcined at 700-1200oC. It shows the
700oC-calcined sample is totally different from those
calcined at higher temperatures. The X-ray pattern indicates that the 700oC sample characterizes HA
peaks of low crystallinity, while at 800oC, the -TCP
peaks appear as the main phase. At 900oC and above,
HA appears again with very weak intensity. The X-ray pattern of 1200oC calcined sample suggests that
its intensity decreases. It is likely to be transformed to -TCP. However, no -TCP identified in the pattern indicates that the transformation is just beginning. One study has reported that the transformation to
-TCP starts at 1160oC (ref. 17).
Table 1 shows the main peaks within the range of 25-40o in 2 for all the samples after calcination at
700oC and for comparison, data of HA according to
JCPDS 09-0432. Table 1 suggests that one of the HA peaks, i.e., (112), of the sample Ca-0 is unresolved
because the peak is too broad. In addition, the 2 positions shift to the left or to the right of the standard HA positions. This suggests the appearance of calcium-deficient hydroxyapatite. The fraction of crystalline phase (Xc) in the HA powders can be
evaluated by Eq.(2) (ref. 23),
(112)/(300) (300)
1 /
= −
c
X V I … (2)
where V(112)/(300) is the intensity of the hollow between
(112) and (300) diffraction peaks of HA and I(300) is
the intensity of (300) diffraction peak. The fraction of HA crystalline phase (Xc) of the sample Ca-0 calcined
at 700°C is only 0.205, and HA does not exist at higher calcinations temperatures (Fig. 2). The lattice parameters of the three samples have been compared with those previously reported for HA and -TCP (henceforth referred to as the standard)15,16. The lattice
parameter of the sample Ca-0 for HA phase at 700°C
(9.433 Å) is higher than standard a-lattice (9.418 Å),
but less than the c-lattice. Regarding HA phase
atomic spacing (d), the values at around 2 = 25.86
and 34.04° of the sample Ca-0, i.e., 3.436 and 2.629 Å
respectively, are lower than those of the standard values i.e., 3.440 and 2.630 Å. When the calcination temperature increases to 800°C, the sample Ca-0 has
-TCP as the single phase. The X-ray patterns indicate no identifiable change in peak with increasing temperature, except at 1200°C calcination where enrichment in peak number was observed indicating the unstability of the phase. At 800°C where -TCP is the main phase of the sample Ca-0,
the a-lattice parameters of the sample for 800, 900,
1000, 1100 and 1200°C are 10.446, 10.429, 10.429, 10.468 and 10.429 Å respectively with an average of 10.440 Å; while for the c-lattices parameter these
va-lues are 37.375, 37.380, 37.380, 37.282 and 37.380 Å respectively with an average of 37.359 Å. These average values are in good agreement with their standard values 10.429 and 37.380 Å, respectively. The parameter d of the sample Ca-0 arbitrarily taken
at 2 = 25.782 and 34.398° gave the average values of
3.461 and 2.601 Å, which are very close to the standard values, 3.453 and 2.605 Å, respectively.
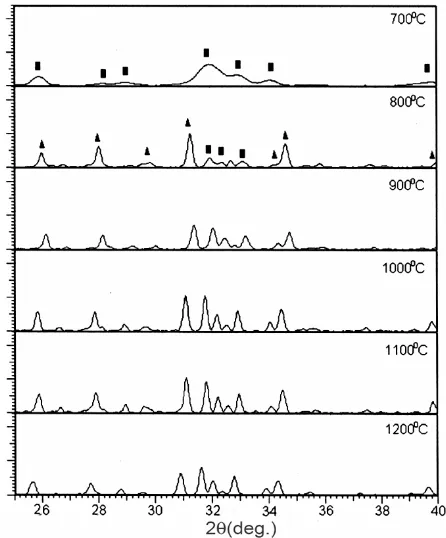
Figure 3 shows the X-ray patterns of the sample
Ca-1 calcined at 700-1200oC. It is observed that HA
or calcium-deficient apatite peaks appear as a broad pattern such that the (112) peak is unresolved (see Table 1). The fraction of crystalline phase (Xc) is
Fig. 3 – X-ray spectra of the sample Ca-1 calcined at temperatures
of 700 -1200oC. [ HA; TCP].
Table 1–The positions of main peaks of all the samples after calcination at 700oC
2 (deg.)
(002) (102) (210) (211) (112) (300) (202) (310)
HA a 25.879 28.126 28.966 31.773 32.196 32.902 34.048 39.818
Ca-0 25.885 28.28 29.012 31.88 n.a. 32.64 34 39.65
Ca-1 25.869 28.2 28.925 31.957 n.a. 32.9 34.01 39.66
Ca-2 25.87 28.14 29.17 32.04 n.a. 32.88 34.035 39.595
ALQAP & SOPYAN: LOW TEMPERATURE HYDROTHERMAL SYNTHESIS OF CALCIUM PHOSPHATE CERAMICS 1497
0.259. As the IR spectra show, the OH (librational) band is clearly observed at higher calcination temperatures at 800-1200oC, leading to identifiable
HA peaks in the X-ray spectra. The intensities of the HA peaks also increase with increase in temperature. The fractions of crystalline phase (Xc) of the HA for
800, 900, 1000, 1100 and 1200oC are 0.443, 0.689,
0.786, 0.820 and 0.799 respectively. It is clear that a significant improvement in the crystalline fraction does not occur after 1000oC. Figure 3 also indicates
that -TCP is the main phase at 800oC and above. The
-TCP intensities do not increase significantly from 800oC (500 cps) to 1100oC (520 cps), and decrease
significantly at 1200°C (350 cps), although the
indication for -TCP getting transformed to -TCP has not yet appeared. The average value of the a- and c-lattice parameters over 800-1200oC (i.e., 9.422 and
6.895 Å respectively) are closer to the standard values for HA phase (i.e., 9.418 and 6.884 Å respectively) and identical to the standard for values TCP phase (i.e., 10.429 and 37.380 Å respectively). There is no disruption of the lattice parameters in TCP. The a- or c-lattice parameter of HA tends to fluctuate for
different temperatures although an increasing trend is also observed. For TCP, however, the value of parameters is constant over the range of 800-1200oC.
The X-ray patterns of the sample Ca-2 calcined at
700-1200oC (Fig. 4) show that the HA (112) is
unresolved at 700oC (see Table 1) indicating the
calcium-deficient hydroxyapatite phase. When calcined at 800oC, the HA peaks appear as four peaks
in the range of 2 = 31.77-34.05º, i.e., (211), (112), (300), and (202). The fraction of HA crystalline phase (Xc) increases with increase in temperature, i.e., 0.257,
0.651, 0.795, 0.889, 0.935 and 0.961 at 700, 800, 900, 1000, 1100 and 1200oC respectively. This
quantitatively proves that significant improvement in the fraction of crystallinity can be obtained by elevating the calcination temperature. The -TCP is still invisible at 700°C and appears when the sample
is calcined at 800oC but decreases in intensity with the
increased temperatures (Fig. 4). In the 1200oC-calcined sample, even the -TCP peak is
insignificant. The single P-O band of 958 cm-1 (for 1
PO4) and two P-O bands of 600 cm-1 and 559 cm-1
(both for 4 PO4) as well as 630 cm-1 band for OH
(librational), are characteristic peaks for HA.
The HA phase of the sample Ca-2 is the main
phase of the sample. The average values of the a- and c- lattice parameters of Ca-2 over 700-1200°C
(i.e., 9.401 and 6.874 Å respectively) are lower than those of the HA standard (i.e., 9.418 and 6.884 Å respectively). The a- and c-lattice parameters change
with the CaO content. For the a- and c- lattice
parameters, it is observed that aCa-0 > aCa-1 = aTCP and
cCa-0 < cCa-1 = cTCP for TCP phase; aCa-1 aHA > aCa-2
and cCa-1 > cHA > cCa-2 for HA phase, while the
average values of atomic spacing shows the trend:
dCa-0 = dCa-1 > dTCP for TCP and dCa-1 > dHA dCa-2
for HA. One reason for this trend in d is that
impurities (such as carbonate), play a role in influencing the crystal system of the samples. Santos and Clayton20 have reported that carbonate
substitution has a negative correlation with the
a-lattice parameter. The value of parameters here
fluctuates suggesting that variation in carbonate has occurred due to uncontrolled atmosphere. There may be another possible reason, i.e., the secondary phase which has been observed may affect the crystal system. The contraction in the
a-parameter is likely to be compensated by the
expansion in the c-parameter, and vice versa, such
that the ratio, c/a, is kept the same and, as a result, the
atomic spacing of the samples is closer to that of the standard.
Fig. 4 – X-ray spectra of the sample Ca-2 calcined at temperatures
We have also carried out studies on 1 and 2 mole% excess of CaO with 0.125 mole CaO as the basis (7 g CaO and 8.63 g NH4H2PO4) in 150 ml distilled water.
The principal difference between 1 and 10 mole% excess CaO samples is that the former, i.e., 1 mole% excess has no HA and only -TCP at all calcination temperatures employed where the -TCP shows around 600 cps of the main peak intensity (0210) for 900°C calcination temperature. The latter, i.e., 10 mole% excess, has -TCP and HA with the main peak intensity of -TCP around 370 cps. There is no difference in the phase appearance between the 2 and 20 mole% excess CaO samples. Both give HA as main phase with -TCP as traces, however, the 2 mole% excess sample has the HA main peak (211) intensity of around 850 cps, higher than that of 20 mole% excess around 600 cps for 900°C calcination temperature.
Thermogravimetry analysis of the samples Ca-0, Ca-1, and Ca-2 give information regarding the
influence of excess CaO on reaction commencement as observed from weight loss. The phase transformations generally require heat as DT analyses indicate, except in the final stages when heat is released and the corresponding phase possibly begins transforming to further phase at higher temperature. The weight losses detected are mainly due to a decrease in amount of O-H groups of intermediate phase reaction. The common pattern in the TG curves of the three samples reveals four reaction sites in the ranges of 40-100oC, 100-250oC, 250-600oC and
600-800oC. These may be attributed to the loss of
residual water for the first, water and ammonia evaporations for the second and the third, and densification and crystallization for the fourth range. The TG curves show the difference in weight losses until ~700oC, with the sample Ca-0 showing the
lowest and Ca-2 the highest loss. At around 700oC, it
is seen that the temperature at which the weight loss occurs decreases and weight loss level increases with the increase in excess calcium. It has been reported earlier that the weight losses at ~700oC is probably
due to removal of water as the by-product from the reaction of P2O74- ions with lattice OH- ions, forming
TCP24. However, this is not true in this study since the
sample Ca-0, with the highest portion of TCP,
showed the least weight loss. It is suggested that the loss is due to deviation from the stoichiometric reaction as the reaction using excess Ca precursor removes more reactants.
It is noteworthy that the TG curves of the samples
Ca-0 and Ca-1 show multiple losses, compared to the
single weight loss for sample Ca-2. The multiple
losses in the TG pattern are probably due to multipe reactions. It is proposed that calcium hydroxide
transform during heating to super-phosphate or monocalcium phosphate monohydrate The above calcium dihydrogen phosphate may also decompose into monetite (CaHPO4) and phosphoric
It is accordingly inferred that many overlapping reactions may occur since phosphoric acid and ammonium dihydrogen phosphate are produced at higher temperatures. Once the monetite or brushite is formed, it decomposes into calcium pyrophosphate (Ca2P2O7) and water at 700-900oC (Eqs 8 & 9)25. weight losses observed in the samples Ca-0 and Ca-1
ALQAP & SOPYAN: LOW TEMPERATURE HYDROTHERMAL SYNTHESIS OF CALCIUM PHOSPHATE CERAMICS 1499
with CaO to form TCP (Ca3(PO4)2) at higher
temperature25, as observed by the P
2O7 band at
727 cm-1 in the IR spectra at calcination temperature
above 800oC. However, the other intermediate phases
are readily decomposed during heating into the subsequent phase at the given temperature and are not observed in the X-ray patterns.
In X-ray patterns of all of the samples calcined at 700oC, the observed peaks are broad, showing its low
crystallinity. Such broad peaks can not merely be associated with less calcium in a sample because the samples Ca-1 and Ca-2 with excess calcium also
show such broad peaks. It is suggested that the appearance of CDHA phase is not merely due to less calcium, but also due to incomplete transformation of HA. The TG–DTA curves suggest that the transformation reaction is still in progress at 700oC as
the transformation is not complete above 700oC.
-TCP appears replacing the CDHA after the sample
Ca-0 is calcined at 700oC; the -TCP phase may
due to the condensation of HPO42- upon heating into
P2O74- and water as suggested elsewhere15,26.
Simultaneously, P2O74- may react with O-H in the
presence of ionic calcium to form -TCP as described in following reaction (Eq. 11).
2
2 2 7 3 4 2 2
Ca P O 2OH− Ca + Ca (PO ) H O
+ + → + … (11)
However for the sample Ca-2, another explanation
for the very small -TCP may be necessary because the P2O74- band is not observed in the IR spectra. A
small amount of NH4H2PO4 may produce P2O5 during
heating27 which reacts with CaO resulting in Ca 2P2O7,
and -TCP is then obtained as the following sequence of reactions shows (Eqs 12 & 13).
washed several times to remove either phosphorus or
calcium compounds remaining in the solution before drying or aging. Unfortunately, the source of Ca2P2O7
is not only one, as described above. The monetite and brushite formed are also sources of calcium
In the above studies, calcium phosphate materials with three different calcium contents, viz., stoichiometric CaO (Ca-0), 10 mole% excess CaO
(Ca-1), and 20 mole% excess CaO (Ca-2) with
0.1 mole CaO as the base, have been successfully synthesized using CaO and NH4H2PO4 through low
temperature hydrothermal process. The as prepared powders have been dried, followed by calcination at 700-1200oC at 100oC interval. The difference in CaO
content brought about difference in stability of the calcium phosphate phase over the different heating regimes. The samples Ca-0, Ca-1 and Ca-2 have
been characterized as unstable, unstable and stable phase respectively. The appearance of -TCP is due to calcium deficiency since its amount decreases with the increasing Ca content. Multiple reactions forming intermediates probably occur in the samples Ca-0 and Ca-1 causing the thermal unstability of calcium
phosphate phase. The X-ray analysis shows different lattice parameters in all the three samples. Even though all the samples have the c/a lattice ratio close
to that of the standard, the sample Ca-2 has the
closest the atomic spacing d.
Acknowledgement
One of the authors, (ASFA), would like to thank the Ministry of National Education, The Republic of Indonesia, for a scholarship, (No. 2865.33 &
3 Kokoska M S, Friedman C D, Castellano R D & Costantino P D, Arch Facial Plast Surg, 6 (2004) 290.
4 Takano I & Ishi Y, J Orthop Sci, 2 (1997) 98.
5 Beloufa S, Chaair H, Loukili H, Digua J & Sallek B, Mater Res, 11 (2008) 93.
6 Dawson-Hughes B, Seligson F H & Hughes V A, Am J Clin Nutr, 44 (1986) 83.
8 Gross K A, Jackson R, Cashion J D & Rodriguez-Lorenzo L M, Eur Cells MaterSuppl, 3 (2002) 114.
9 Fu Q, Zhou N, Huang W, Wang D, Zhang L & Li H, J Biomed Mater Res, 74A (2005) 156.
10 Aoki A, Ogaki M & Kano S, Rep Inst Med Dent Eng, 27
(1993) 39.
11 Ramesh S, Tan C Y, Bhaduri S B, Teng W D & Sopyan I, J Mater Process Technol, 206 (2008) 221.
12 Sopyan I, Singh R & Hamdi M, Indian J Chem, 47A (2008)
1626.
13 Murugan R & Ramakrishna S, Am J Biochem Biotech, 3
(2007)118.
14 Bezzi G, Celotti G, Landi E, La Torretta T M G, Sopyan I & Tampieri A, Mater Chem Phys, 78 (2003) 816.
15 Markovic M, Fowler B O & Tung M S, J Res Natl Inst Stand Technol, 109 (2004) 553.
16 Ermrich M & Peters F, Z Kristallogr Suppl, 23 (2006) 523.
17 Gibson I R, Rehman I, Best S M & Bonfield W, J Mater Sci Mater Med, 11 (2000) 533.
18 Smith B, Infrared Spectral Interpretation. A Systematic Approach, (CRC Press, Boca Raton, London, New York,
Washington D C) 1999, pp. 74
19 Neira I S, Guitan F, Taniguchi T, Watanabe T & Yoshimura M, J Mater Sci, 43 (2008) 2171.
20 Santos R V & Clayton R N, Am Mineral, 80 (1995) 336.
21 Nakamura S & Nakahira A, J Ceram Soc Japan, 116(1)
(2008) 42.
22 Kreidler E R & Hummel F A, Am Mineral, 55 (1970)
170.
23 Landi E, Logroscino G, Proietti L, Tampieri A, Sandri M & Sprio S, J Mater Sci Mater Med, 19 (2008) 239.
24 Cheng Z H, Yasukawa A, Kandori K & Ishikawa T, J Chem Soc Faraday Trans, 94 (1998) 1501.
25 Forschungvorhaben StSch 4386, Industrielle Hinterlassenschaften der Rohphosphat-Verarbeitung (Teil
3b, Andreas Reichelt, München) 2005, pp. 80, 82, 100, 115. 26 Ben-Nissan B, Chai C & Evans L, Crystallographic and
Spectroscopic Characterization and Morphology of Biogenic and Synthetic Apatites, in Encyclopedic Handbook of Biomaterials and Bioengineering, Part B: Applications, Vol. 1, edited by D L Wise, D J Trantolo, D E Altobelli,
M J Yaszemski, J D Gresser & E R Schwartz, (Marcel Dekker, New York) 1995, pp. 191-221.
27 Neiman R & Sarma A C, J Dent Res, 59 (1980) 1478.
![Fig. 4 – X-ray spectra of the sample Ca-2 calcined at temperatures of 700 -1200oC. [� HA; � TCP]](https://thumb-ap.123doks.com/thumbv2/123dok/1412306.2025260/6.612.319.556.427.713/fig-ray-spectra-sample-ca-calcined-temperatures-tcp.webp)
