Risk Analysis
Risk Analysis
Assessing Uncertainties beyond
Expected Values and Probabilities
Terje Aven
Telephone (+44) 1243 779777
Email (for orders and customer service enquiries): [email protected] Visit our Home Page on www.wileyeurope.com or www.wiley.com
All Rights Reserved. No part of this publication may be reproduced, stored in a retrieval system or transmitted in any form or by any means, electronic, mechanical, photocopying, recording, scanning or otherwise, except under the terms of the Copyright, Designs and Patents Act 1988 or under the terms of a licence issued by the Copyright Licensing Agency Ltd, 90 Tottenham Court Road, London W1T 4LP, UK, without the permission in writing of the Publisher. Requests to the Publisher should be addressed to the Permissions Department, John Wiley & Sons Ltd, The Atrium, Southern Gate, Chichester, West Sussex PO19 8SQ, England, or emailed to [email protected], or faxed to (+44) 1243 770620.
This publication is designed to provide accurate and authoritative information in regard to the subject matter covered. It is sold on the understanding that the Publisher is not engaged in rendering professional services. If professional advice or other expert assistance is required, the services of a competent professional should be sought.
Other Wiley Editorial Offices
John Wiley & Sons Inc., 111 River Street, Hoboken, NJ 07030, USA Jossey-Bass, 989 Market Street, San Francisco, CA 94103-1741, USA Wiley-VCH Verlag GmbH, Boschstr. 12, D-69469 Weinheim, Germany
John Wiley & Sons Australia Ltd, 42 McDougall Street, Milton, Queensland 4064, Australia John Wiley & Sons (Asia) Pte Ltd, 2 Clementi Loop #02-01, Jin Xing Distripark, Singapore 129809 John Wiley & Sons Canada Ltd, 6045 Freemont Blvd, Mississauga, ONT, L5R 4J3
Wiley also publishes its books in a variety of electronic formats. Some content that appears in print may not be available in electronic books.
British Library Cataloguing in Publication Data
A catalogue record for this book is available from the British Library ISBN 978-0-470-51736-9
Contents
Preface ix
Part I
Theory and methods
1
1 What is a risk analysis? 3
1.1 Why risk analysis? . . . 5
1.2 Risk management . . . 6
1.2.1 Decision-making under uncertainty . . . 8
1.3 Examples: decision situations . . . 13
1.3.1 Risk analysis for a tunnel . . . 13
1.3.2 Risk analysis for an offshore installation . . . 14
1.3.3 Risk analysis related to a cash depot . . . 14
2 What is risk? 17 2.1 Vulnerability . . . 21
2.2 How to describe risk quantitatively . . . 22
2.2.1 Description of risk in a financial context . . . 24
2.2.2 Description of risk in a safety context . . . 25
3 The risk analysis process: planning 29 3.1 Problem definition . . . 29
3.2 Selection of analysis method . . . 34
3.2.1 Checklist-based approach . . . 35
3.2.2 Risk-based approach . . . 36
4 The risk analysis process: risk assessment 39 4.1 Identification of initiating events . . . 39
4.2 Cause analysis . . . 40
4.3 Consequence analysis . . . 41
4.4 Probabilities and uncertainties . . . 43
4.5 Risk picture: Risk presentation . . . 44
4.5.1 Sensitivity and robustness analyses . . . 48
5 The risk analysis process: risk treatment 51
5.1 Comparisons of alternatives . . . 51
5.1.1 How to assess measures? . . . 53
5.2 Management review and judgement . . . 55
6 Risk analysis methods 57 6.1 Coarse risk analysis . . . 57
6.2 Job safety analysis . . . 62
6.3 Failure modes and effects analysis . . . 64
6.3.1 Strengths and weaknesses of an FMEA . . . 69
6.4 Hazard and operability studies . . . 70
6.5 SWIFT . . . 71
6.6 Fault tree analysis . . . 72
6.6.1 Qualitative analysis . . . 74
6.6.2 Quantitative analysis . . . 76
6.7 Event tree analysis . . . 78
6.7.1 Barrier block diagrams . . . 80
6.8 Bayesian networks . . . 80
6.9 Monte Carlo simulation . . . 83
Part II
Examples of applications
85
7 Safety measures for a road tunnel 87 7.1 Planning . . . 877.1.1 Problem definition . . . 87
7.1.2 Selection of analysis method . . . 88
7.2 Risk assessment . . . 88
7.2.1 Identification of initiating events . . . 88
7.2.2 Cause analysis . . . 90
7.2.3 Consequence analysis . . . 90
7.2.4 Risk picture . . . 94
7.3 Risk treatment . . . 95
7.3.1 Comparison of alternatives . . . 95
7.3.2 Management review and decision . . . 95
8 Risk analysis process for an offshore installation 97 8.1 Planning . . . 97
8.1.1 Problem definition . . . 97
8.1.2 Selection of analysis method . . . 98
8.2 Risk analysis . . . 98
8.2.1 Hazard identification . . . 98
8.2.2 Cause analysis . . . 98
8.3 Risk picture and comparison of alternatives . . . 103
8.4 Management review and judgement . . . 104
9 Production assurance 105 9.1 Planning . . . 105
9.2 Risk analysis . . . 105
9.2.1 Identification of failures . . . 105
9.2.2 Cause analysis . . . 106
9.2.3 Consequence analysis . . . 106
9.3 Risk picture and comparison of alternatives . . . 108
9.4 Management review and judgement. Decision . . . 109
10 Risk analysis process for a cash depot 111 10.1 Planning . . . 111
10.1.1 Problem definition . . . 111
10.1.2 Selection of analysis method . . . 112
10.2 Risk analysis . . . 113
10.2.1 Identification of hazards and threats . . . 113
10.2.2 Cause analysis . . . 113
10.2.3 Consequence analysis . . . 116
10.3 Risk picture . . . 118
10.4 Risk-reducing measures . . . 120
10.4.1 Relocation of the NOKAS facility . . . 120
10.4.2 Erection of a wall . . . 121
10.5 Management review and judgment. Decision . . . 121
10.6 Discussion . . . 122
11 Risk analysis process for municipalities 123 11.1 Planning . . . 123
11.1.1 Problem definition . . . 123
11.1.2 Selection of analysis method . . . 124
11.2 Risk assessment . . . 124
11.2.1 Hazard and threat identification . . . 124
11.2.2 Cause and consequence analysis. Risk picture . . . 125
11.3 Risk treatment . . . 128
12 Risk analysis process for the entire enterprise 131 12.1 Planning . . . 131
12.1.1 Problem definition . . . 131
12.1.2 Selection of analysis method . . . 132
12.2 Risk analysis . . . 132
12.2.1 Price risk . . . 132
12.2.2 Operational risk . . . 135
12.2.3 Health, Environment and Safety (HES) . . . 137
12.3 Overall risk picture . . . 140
12.4 Risk treatment . . . 141
13 Discussion 143 13.1 Risk analysis as a decision support tool . . . 143
13.2 Risk is more than the calculated probabilities and expected values 144 13.3 Risk analysis has both strengths and weaknesses . . . 145
13.3.1 Precision of a risk analysis: uncertainty and sensitivity analysis . . . 145
13.3.2 Terminology . . . 147
13.3.3 Risk acceptance criteria (tolerability limits) . . . 149
13.4 Reflection on approaches, methods and results . . . 152
13.5 Limitations of the causal chain approach . . . 152
13.6 Risk perspectives . . . 154
13.7 Scientific basis . . . 157
13.8 The implications of the limitations of risk assessment . . . 159
13.9 Critical systems and activities . . . 161
13.10 Conclusions . . . 166
A Probability calculus and statistics 167 A.1 The meaning of a probability . . . 167
A.2 Probability calculus . . . 168
A.3 Probability distributions: expected value . . . 170
A.3.1 Binomial distribution . . . 171
A.4 Statistics (Bayesian statistics) . . . 172
B Introduction to reliability analysis 173 B.1 Reliability of systems composed of components . . . 173
B.2 Production system . . . 175
B.3 Safety system . . . 175
C Approach for selecting risk analysis methods 177 C.1 Expected consequences . . . 177
C.2 Uncertainty factors . . . 179
C.3 Frame conditions . . . 179
C.4 Selection of a specific method . . . 180
D Terminology 183 D.1 Risk management: relationships between key terms . . . 186
Bibliography 187
Preface
This book is about risk analysis – basic ideas, principles and methods. Both theory and practice are covered. A number of books exist presenting the many risk analysis methods and tools, such as fault tree analysis, event tree analysis and Bayesian networks. In this book we go one step back and discuss the role of the analyses in risk management. How such analyses should be planned, executed and used, such that they meet the professional standards for risk analyses and at the same time are useful in a practical decision-making context. In the book we review the common risk analysis methods, but the emphasis is placed on the context and applications. By using examples from different areas, we highlight the various elements that are part of the planning, execution and use of the risk analysis method. What are the main challenges we face? What type of methods should we choose? How can we avoid scientific mistakes? The examples used are taken from, among others, the transport sector, the petroleum industry and ICT (Information and Communication Technology). For each example we define a decision-making problem, and show how the analyses can be used to provide adequate decision support. The book covers both safety (accidental events) and security (intentional acts).
The book is based on the recommended approach to risk analysis described and discussed in Aven (2003, 2007a, 2008). The basic idea is that risk analysis should produce a broad risk picture, highlighting uncertainties beyond expected values and probabilities. The aim of the risk analysis is to predict unknown physical quantities, such as the explosion pressure, the number of fatalities, costs and so on, and assess uncertainties. A probability is not a perfect tool for expressing the uncertainties. We have to acknowledge that the assigned probabilities are subjective probabil-ities conditional on a specific background knowledge. The assigned probabilprobabil-ities could produce poor predictions. The main component of risk is uncertainty, not probability. Surprises relative to the assigned probabilities may occur and by just addressing probabilities such surprises may be overlooked.
statistical analysis. This makes the book more self-contained, and it gives the book the required sharpness with respect to relevant concepts and tools. We have also included a brief appendix covering basic reliability analysis, so that the reader can obtain the necessary background for calculating the reliability of a safety system.
This book is primarily about planning, execution and use of risk analyses, and it provides clear recommendations and guidance in this context. However, it is not a recipe-book, telling you which risk analysis methods should be used in different situations. What is covered is the general thinking process related to the planning, execution and use of risk analyses. Examples are provided to illustrate this process. The book is based on and relates to the research literature in the field of risk, risk analysis and risk management. Some of the premises for the approach taken in the book as well as some areas of scientific dispute are looked into in a special “Discussion” chapter (Chapter 13). The issues addressed include the risk concept, the use of risk acceptance criteria and the definition of safety critical systems.
The target audience for the book is primarily professionals within the risk analysis and risk management fields, but others, in particular managers and decision-makers, can also benefit from the book. All those working with risk-related prob-lems need to understand the fundamental principles of risk analysis.
This book is based on a Norwegian book on risk analysis (Aven et al. 2008), with co-authors Willy Røed and Hermann S. Wiencke. The present version is, however, more advanced and includes topics that are not included in Aven et al. (2008).
The terminology used in the book is summarised in Appendix D. It is to a large extent in line with the ISO standard on risk management terminology, ISO (2002). Our approach means a humble attitude to risk and the possession of the truth, and hopefully it will be more attractive also to social scientists and others, who have strongly criticised the prevalent thinking of risk analysis and evaluation in the engineering environment. Our way of thinking, to a large extent, integrates technical and economic risk analyses and the social scientist perspectives on risk. As a main component of risk is uncertainty about the world, risk perception has a role to play to guide decision-makers. Professional risk analysts do not have the exclusive right to describe risk.
Acknowledgements
A number of individuals have provided helpful comments and suggestions to this book. In particular, I would like to acknowledge my co-authors of Aven et al. (2008), Willy Røed and Hermann S. Wiencke. Chapters 7 and 11 are mainly due to Willy and Hermann; thanks to both. I am also grateful to Eirik B. Abrahamsen and Roger Flage for the great deal of time and effort they spent reading and preparing comments.
For financial support, thanks to the University of Stavanger, and the Research Council of Norway.
I also acknowledge the editing and production staff at John Wiley & Sons for their careful work.
Part I
Theory and methods
The first part of the book deals with theory and methods. We are concerned about questions such as: What is a risk analysis? How should we describe risk? How should we plan, execute and use the risk analysis? What type of methods can we apply for different situations?
1
What is a risk analysis?
The objective of a risk analysis is to describe risk, i.e. to present an informative risk picture. Figure 1.1 illustrates important building blocks of such a risk picture. Located at the centre of the figure is the initiating event (the hazard, the threat, the opportunity), which we denoteA. In the example, the event is that a person (John) contracts a specific disease. An important task in the risk analysis is to identify such initiating events. In our example, we may be concerned about various diseases that could affect the person. The left side of the figure illustrates the causal picture that may lead to the eventA. The right side describes the possible consequences ofA. On the left side are barriers that are introduced to prevent the event A from occurring; these are the probability reducing or preventive barriers. Examples of such barriers are medical check-ups/examinations, vaccinations and limiting the exposure to contamination sources. On the right side are barriers to prevent the dis-ease (event A) from bringing about serious consequences; the consequence reducing barriers. Examples of such barriers are medication and surgery. The occurrence of A and performance of the various barriers are influenced by a number of fac-tors – the so-called risk-influencing or performance-influencing facfac-tors. Examples are: The quality of the medical check-ups; the effectiveness of the vaccine, drug or surgery; what is known about the disease and what causes it; lifestyle, nutrition and inheritance and genes.
Figure 1.1 is often referred to as a bow-tiediagram. We will refer to it many times later in the book when the risk picture is being discussed.
We refer to the event A as an initiating event. When the consequences are obviously negative, the term “undesirable event” is used. We also use words such as hazards and threats. We say there is a fire hazard or that we are faced with a terrorist threat. We can also use the term initiating event in connection with an opportunity. An example is the opportunity that arises if a competitor goes bankrupt or his reputation is damaged.
The risk analysis shall identify the relevant initiating events and develop the causal and consequence picture. How this is done depends on which method is
A: John contracts a
specific disease
John gets well
John has short-term ailments
John has long-term ailments John dies Lifestyle Nutrition Hereditary factors Environment
Quality of medical check-ups, effects of vaccines,
...
Quality of operation, effects of medication, ...
Vaccines
Medication
Operation
Medical
check-ups
Figure 1.1 Example of a bow-tie.
used and on how the results are to be used. However, the intent is always the same: to describe risk.
In this book, we differentiate between three main categories of risk analysis methods: simplified risk analysis, standard risk analysis and model-based risk anal-ysis. These three categories of methods are described in more detail in Table 1.1.
The different methods mentioned in the table will be discussed in Chapter 6.
Table 1.1 Main categories of risk analysis methods. Main category Type of Description
analysis
Simplified risk analysis
Qualitative Simplified risk analysis is an informal procedure that establishes the risk picture using brainstorming sessions and group discussions. The risk might be presented on a coarse scale, e.g. low, moderate or large, making no use of formalised risk analysis methods.
Standard risk analysis
Qualitative or quantitative
Standard risk analysis is a more formalised procedure in which recognised risk analysis methods are used, such as HAZOP and coarse risk analysis, to name a few. Risk matrices are often used to present the results.
Model-based risk analysis
Primarily quantitative
Reflection
An overview of historical data (for example, accident events) is established. Does this constitute a risk analysis?
No, not in isolation. Such data describe what happened, and the numbers say something about the past. Only when we address the future (for example, the number of fatalities in the coming year) does the risk concept apply. To analyse what will happen, we can decide to make use of the historical numbers, and the statistics will then provide an expression of risk. In this way, we are conducting a risk analysis.
1.1
Why risk analysis?
By carrying out a risk analysis one can:
• establish a risk picture;
• compare different alternatives and solutions in terms of risk;
• identify factors, conditions, activities, systems, components, etc. that are important (critical) with respect to risk; and
• demonstrate the effect of various measures on risk.
This provides a basis for:
• Choosing between various alternative solutions and activities while in the planning phase of a system.
• Choosing between alternative designs of a solution or a measure. What mea-sures can be implemented to make the system less vulnerable in the sense that it can better tolerate loads and stresses?
• Drawing conclusions on whether various solutions and measures meet the stated requirements.
• Setting requirements for various solutions and measures, for example, related to the performance of the preparedness systems.
• Documenting an acceptable safety and risk level.
Risk analyses can be carried out at various phases in the life time of a system, i.e. from the early concept phase, through the more detailed planning phases and the construction phase, up to the operation and decommisioning phases.
We need to distinguish between the planning phase and the operational phase. When we design a system, we often have considerable flexibility and can choose among many different solutions; while often having limited access to detailed information on these solutions. The risk analysis in such cases provides a basis for comparing the various alternatives. The fact that we have many possible decision alternatives and limited detailed information implies, as a rule, that one will have to use a relatively coarse analysis method. As one gradually gains more knowledge regarding the final solution, more detailed analysis methods will become possible. All along, one must balance the demand for precision with the demand for decision support. There is no point in carrying out detailed analyses if the results arrive too late to affect the decisions.
In the operating phase, we often have access to experience data, for example, historical data, on the number of equipment and systems failures. In such cases, one can choose a more detailed analysis method and study these systems specifically. However, here the decision alternatives are often limited. It is easier by far to make changes “on paper” in planning phases than to make changes to existing systems in the operating phase. Risk analyses have, therefore, had their greatest application in the planning phases. In this book, however, we do not limit ourselves to these phases. Risk analyses are useful in all phases, but the methods applied must be suited to the need.
1.2
Risk management
Risk management is defined as all measures and activities carried out to manage risk. Risk management deals with balancing the conflicts inherent in exploring opportunities on the one hand and avoiding losses, accidents and disasters on the other (Aven and Vinnem 2007).
Risk management relates to all activities, conditions and events that can affect the organisation, and its ability to reach the organisation’s goals and vision. To be more specific we will consider an enterprise, for example a company. Identifica-tion of which activities, condiIdentifica-tions and events are important will depend on the enterprise and its goals and vision.
In many enterprises, the risk management task is divided into three main cate-gories, which are management of:
• strategic risk
• financial risk
• operational risk.
Strategic risk includes aspects and factors that are important for the enterprise’s long-term strategy and plans, for example:
• mergers and acquisitions
• competition
• political conditions
• laws and regulations
• labour market.
Financial risk includes the enterprise’s financial situation, and comprises among others:
• market risk, associated with the costs of goods and services, foreign exchange rates and securities (shares, bonds, etc.);
• credit risk, associated with debtors’ payment problems;
• liquidity risk, associated with the enterprise’s access to capital.
Operational risk includes conditions affecting the normal operating situation, such as:
• accidental events, including failures and defects, quality deviations and nat-ural disasters;
• intended acts; sabotage, disgruntled employees, and so on;
• loss of competence, key personnel;
• legal circumstances, for instance, associated with defective contracts and liability insurance.
For an enterprise to become successful in its implementation of risk management, the top management needs to be involved, and activities must be put into effect on many levels. Some important points to ensure success are:
• Establishment of a strategy for risk management, i.e. the principles of how the enterprise defines and runs the risk management. Should one simply follow the regulatory requirements (minimal requirements), or should one be the “best in the class?” We refer to Section 1.3.
• Establishment of a risk management process for the enterprise, i.e. formal processes and routines that the enterprise has to follow.
• Establishment of management structures, with roles and responsibilities, such that the risk analysis process becomes integrated into the organisation.
• Implementation of analyses and support systems, for example, risk analysis tools, recording systems for occurrences of various types of events, etc.
• Communication, training and development of a risk management culture, so that the competence, understanding and motivation level within the organi-sation is enhanced.
presenting the risk analysis process, but most structures contain the following three key elements:
1. planning
2. risk assessment (execution)
3. risk treatment (use).
In this book, we use the term “risk analysis process,” when we talk about the three main phases: planning, risk assessment and risk treatment, while we use “risk management process” when we include other management elements also, which are not directly linked to the risk analysis.
We make a clear distinction between the terms risk analysis, risk evaluation and risk assessment:
Risk analysis+Risk evaluation=Risk assessment
The results from the risk analysis are evaluated. How does alternativeI compare with alternativeII? Is the risk too high? Is there a need to implement risk-reducing measures? We use the term risk assessment to mean both the analysis and the evaluation.
Risk assessment is followed by risk treatment. This represents the process and implementation of measures to modify risk, including tools to avoid, reduce, optimise, transfer and retain risk. Transfer of risk means to share with another party the benefits or potential losses connected with a risk. Insurance is a common type of risk transfer.
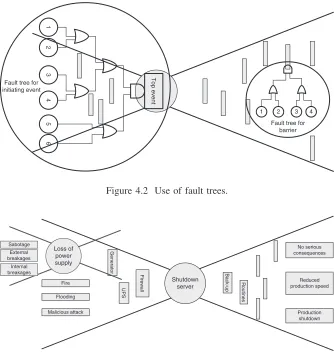
Figure 1.2 shows the main steps of the risk analysis process. We will frequently refer to this figure in the forthcoming chapters. It forms the basis for the structure of and discussions in the Chapters 3, 4 and 5.
1.2.1
Decision-making under uncertainty
Risk management often involves decision-making in situations characterised by high risk and large uncertainties, and such decision-making presents a challenge in that it is difficult to predict the consequences (outcomes) of the decisions. Generally, the decision process includes the following elements:
1. The decision situation and the stakeholders (interested parties):
– What is the decision to be made?
– What are the alternatives?
– What are the boundary conditions?
– Who is affected by the decision? – Who will make the decision?
Problem definition, information gathering and organisation of the work
Selection of analysis method
Identification of initiating events (hazards, threats, opportunities)
Consequence analysis
Risk picture
Compare alternatives, identification and assessment of measures
Management review and judgement. Decision
Planning
Risk assessment
Risk treatment
Cause analysis
Figure 1.2 The main steps of the risk analysis process.
2. Goal-setting, preferences and performance measures:
– What do the various interested parties want?
– How to weigh the pros and cons?
– How to express the performance of the various alternatives?
3. The use of various means, including various forms of analyses to support the decision-making:
– Risk analyses
– Cost-benefit analyses (see Chapter 3)
– Cost-effectiveness analyses (see Chapter 3).
4. Review and judgement by the decision-maker. Decision.
Decision problem. Decision alternatives
Analyses and evaluations.
Risk analyses Decision analyses
Managerial review and
judgement Decision Stakeholders’
values,
preferences, goals and criteria
Figure 1.3 A model for decision-making under uncertainty (Aven 2003).
for sorting these and choosing which ones are to be processed further. Finally, the decision-maker must perform a review and judgement of the various alterna-tives, taking into account the constraints and limitations of the analyses. Then the decision-maker makes a decision.
This is a simple model of the decision-making process. The model outlines how the process should be implemented. If the model is followed, the process can be documented and traced. The model is, however, not very detailed and specific. The decision support produced by the analyses must be reviewed by the decision-maker prior to making the decision: What is the background informa-tion of the analyses? What are the assumpinforma-tions and supposiinforma-tions made? The results from the analyses must be evaluated in the light of factors, such as:
• Which decision-making alternatives have been analysed?
• Which performance measures have been assessed?
• The fact that the analyses represent judgements (expert judgements).
• Difficulties in determining the advantages and disadvantages of the different alternatives.
• The fact that the results of the analyses are based on models that are simpli-fications of the real world and real-world phenomena.
views the basis in a larger context. Perhaps the analysis did not take into consider-ation what the various measures mean for the reputconsider-ation of the enterprise, but this is obviously a factor that is of critical importance for the enterprise. The review and judgement must also cover this aspect.
The weight the decision-maker gives to the basis information provided depends on the confidence he/she has in those who developed this information. However, it is important to stress that even if the decision-maker has maximum confidence in those doing this work, the decision still does not come about on its own. The decisions often encompass difficult considerations and weighing with respect to uncertainty and values, and this cannot be delegated to those who create the basis information. It is the responsibility of the decision-maker (manager) to undertake such considerations and weighing and to make a decision that balances the various concerns.
Reflection
In high-risk situations, should the decisions be “mechanised” by introducing pre-defined criteria, and then letting the decisions be determined by the results of the analyses?
No, we need a management review and judgement that places the analyses into a wider context.
Various decision-making strategies can form the basis for the decision. By “decision-making strategy” we mean the underlying thinking and the principles that are to be followed when making the decision, and how the process prior to the decision should be. Of importance to this are the questions of who will be involved and what types of analysis to use.
A decision-making strategy takes into consideration the effect on risk (as it appears in the risk analysis) and the uncertainty dimensions that cannot be cap-tured by the analysis. The result is thus decisions founded both in calculated risk and applications of thecautionary principleandprecautionary principle. The cau-tionary principle means that caution, for example by not starting an activity or by implementing measures to reduce risks and uncertainties, shall be the overriding principle when there is uncertainty linked to the consequences, i.e. when risk is present (HSE 2001, Aven and Vinnem 2007). The level of caution adopted will, of course, have to be balanced against other concerns, such as costs. However, all industries would introduce some minimum requirements to protect people and the environment, and these requirements can be considered justified by reference to the cautionary principle.
in the living quarters should be protected. The assigned probability for the living quarters on a specific installation plant being exposed to fire may be judged as low, but we know that fires occur from time to time on such installations. It does not matter whether we calculate a fire probability of x or y, as long as we consider the risks to be significant; and this type of risk has been judged to be significant by the authorities. The justification is experience from similar plants and sound judgements. A fire may occur, since it is not an unlikely event, and we should then be prepared. We need no references to cost-benefit analysis. The requirement is based on cautionary thinking.
Risk analyses, cost-benefit analyses and similar types of analyses are tools pro-viding insights into risks and the trade-offs involved. But they are just tools – with strong limitations. Their results are conditioned on a number of assumptions and suppositions. The analyses do not express objective results. Being cautious also means reflecting this fact. We should not put more emphasis on the predictions and assessments of the analyses than what can be justified by the methods being used. In the face of uncertainties related to the possible occurrences of hazardous sit-uations and accidents, we are cautious and adopt principles of safety management, such as:
• robust design solutions, such that deviations from normal conditions are not leading to hazardous situations and accidents;
• design for flexibility, meaning that it is possible to utilise a new situation and adapt to changes in the frame conditions;
• implementation of safety barriers to reduce the negative consequences of hazardous situations if they should occur, for example a fire;
• improvement of the performance of barriers by using redundancy, mainte-nance/testing, etc.;
• quality control/quality assurance;
• the precautionary principle, which says that in the case of lack of scientific certainty on the possible consequences of an activity, we should not carry out the activity;
• the ALARP principle, which says that the risk should be reduced to a level which is As Low As Reasonably Practicable.
Thus the precautionary principle may be considered a special case of the cau-tionary principle, as it is applicable in cases of scientific uncertainties (Sandin 1999, L¨ofstedt 2003, Aven 2006). There are, however, many definitions of the precautionary principle. The well-known 1992 Rio Declaration uses the following definition:
Seeing beyond environmental protection, a definition such as the following reflects what is a typical way of understanding this principle:
The precautionary principle is the ethical principle that if the conse-quences of an action, especially the use of technology, are subject to scientific uncertainty, then it is better not to carry out the action rather than risk the uncertain, but possibly very negative, consequences.
We refer to Aven (2006) for further discussion of these principles.
It is prudent to distinguish between management strategies for handling the risk agent (such as a chemical or a technology) from those needed for the risk absorbing system (such as a building, an organism or an ecosystem) (Renn 2005), see also Aven and Renn (2008b). With respect to risk absorbing systems robustness and resilience are two main categories of strategies/principles.Robustnessrefers to the insensitivity of performance to deviations from normal conditions. Measures to improve robustness include inserting conservatisms or safety factors as an assur-ance against individual variation, introducing redundant and diverse safety devices to improve structures against multiple stress situations, reducing the susceptibility of the target organism (example: iodine tablets for radiation protection), estab-lishing building codes and zoning laws to protect against natural hazards as well as improving the organisational capability to initiate, enforce, monitor and revise management actions (high reliability, learning organisations).
A resilient system can withstand or even tolerate surprises. In contrast to robust-ness, where potential threats are known in advance and the absorbing system needs to be prepared to face these threats, resilience is a protective strategy against unknown or highly uncertain events. Instruments for resilience include the strength-ening of the immune system, diversification of the means for approaching identical or similar ends, reduction of the overall catastrophic potential or vulnerability even in the absence of a concrete threat, design of systems with flexible response options and the improvement of conditions for emergency management and system adap-tation. Robustness and resilience are closely linked but they are not identical and require partially different types of actions and instruments.
The decision-making strategy is dependent on the decision-making situation. The differences are large, from routine operations where codes and standards are used to a large extent, to situations with high risks, where there is a need for comprehensive information about risk.
1.3
Examples: decision situations
In this book, we will present a number of examples of the use of risk analysis. A brief introduction to some of these examples is provided below.
1.3.1
Risk analysis for a tunnel
dimensioned based on regulatory requirements stating that the project must be able to handle a 20-MW fire, i.e. a fire in several vehicles, trucks, and the like. Partway in the construction process, however, new regulatory requirements came into effect stating that the design should withstand a fire of 100 MW, which means a fire involving a heavy goods vehicle or a fire in a hazardous goods transport. To upgrade the fire-related ventilation now, when the tunnel is more or less completed, will lead to significant costs and will delay the opening of the tunnel by 6–12 months.
A risk analysis is carried out to assess the effect of upgrading the ventilation system in accordance with the new regulatory requirements, and to assess the effect of alternative safety measures. In the regulations, there is an acceptance for introducing alternative measures if it can be documented that they would lead to an equivalent or higher level of safety. The aim of the risk analysis is to provide a basis for determining which measure or measures should be implemented. The reader is referred to Chapter 7.
1.3.2
Risk analysis for an offshore installation
A significant modification of an offshore installation is to be carried out. This would require more production equipment and result in increased accident risk. An increase in production equipment provides more sources of hydrocarbon leakages that can cause fire and explosion if ignited. The problem is to what extent one should install extra fire protection to reduce the consequences in the event of a fire. A risk analysis is to be carried out to provide a basis for making the decision.
How is this analysis to be carried out? How should the risk be expressed? To what degree should we quantify the risk? We have many years of experience records from the operation of this installation. How can we utilise this information? To what degree is the use of cost-benefit analysis relevant in this context?
The reader is referred to Chapter 8 where these problems are discussed.
1.3.3
Risk analysis related to a cash depot
• How should the risk be expressed?
• Should criteria for acceptable risk level be defined, so that we can compare the results from the risk analysis with these?
• How should one take into consideration the significant uncertainty associated with the future regarding the scope of robberies and which methods the perpetrators will use?
• How are the results of the risk analysis to be communicated?
• How can the results from the analysis be utilised in the municipal adminis-trative process?
2
What is risk?
The objective of a risk analysis is to describe risk. To understand what this means, we must know what risk is and how risk is expressed. In this chapter we will define what we mean by risk in this book. We will also look closer at the concept of vulnerability.
Risk is related to future eventsAand their consequences (outcomes)C. Today, we do not know if these events will occur or not, and if they occur, what the consequences will be. In other words, there is uncertaintyU associated with both AandC. How likely it is that an eventAwill occur and that specific consequences will result, can be expressed by means of probabilitiesP, based on our knowledge (background knowledge),K. Here are some examples:
Illness (Refer Figure 1.1)
A: A person (John) contracts a certain illness next year.
C: The person recovers during the course of 1 month; 1 month−1 year; the person never recovers; the person dies as a result of the illness. Generally, we define C to be the time it takes before he recovers.
U: Today we do not know if John will contract this illness, and we do not know what its consequence will be.
P: Based on our knowledge of this illness (K), we can express that the prob-ability that John contracts this illness is, for example, 10%, and that if he gets the illness, the probability that he will die is 5%. We write, P (A|K)=0.10 and P (he dies|A, K)=0.05. The symbol|is read as “given,” so that P (A|K) expresses our probability thatAwill occur given our knowledgeK.
Dose –response
Physicians often talk about the dose–response relationship. Formulae are estab-lished showing the link between a dose and the average response. The dose here means the amount of drugs that is introduced into the body, the training dose, etc.
This is the initiating event A. In most cases it is known – there is no uncertainty related toA. The consequence (the response) of the dose is denotedC. It can, for instance, be a clinical symptom or another physical or pathological reaction within the body. By establishing a dose–response curve we can determine a typical (aver-age) response value for a specific dose. In a particular case, the response C is unknown. It is uncertain (U). How likely it is thatC will take different specific outcomes can be expressed by means of probabilities. These probabilities will be based on the available background knowledge K. We may for example assign a probability of 10% that the response will be a factor 2 higher than the typical (average) response value.
Exposure – health effects
Within the discipline work environment, one often uses the terms “exposure” and associated “health effects.” The exposure can, for example, be linked to bio-logical factors (bacteria, viruses, fungi, etc.), noise and radiation. An initiating event Acould be that this exposure has reached a certain magnitude. The conse-quences – the health effects – are denoted C, and we can repeat the presentation of the dose–response example.
Disconnection from server
A: An important computer server that is used in a production company fails (no longer functions) over the next 24 hours.
C: No consequences; reduced production speed; production stoppage.
U: Today we do not know whether the server will fail or not, and what the conse-quences will be in case of failures.
P: We know that the server has failed many times previously. Based on the his-torical data (K) we assign a probability of 0.01 that the server will fail in the course of the next 24 hours. The failure of the server has never before led to a production shutdown. However, system experts assign a probability of 2% for a production shutdown in the event of a server failure. HenceP (A|K)=0.01 and P (production stoppage|A, K)=0.02.
Fire in a road tunnel
A: A fire breaks out in a vehicle in a certain road tunnel next year.
C: Lightly injured road users; severely injured road users; 1–4 killed; 5–20 killed; >20 killed.
U: Today we do not know if there will be a fire in the tunnel, and the consequences of such a fire.
Product sale
An enterprise that manufactures a particular product initiates a campaign to increase sales.
C: Sales (profitability)
U: Today we do not know the sales and profitability numbers.
P: Based on historical knowledge (K), the probability that the sales will exceed 100 is expressed asP (C >100|K)=0.05.
Based on these examples, we present a general definition of risk (Aven 2007a):
By risk we understand the combination of (i) events A and the con-sequences of these events C, and (ii) the associated uncertainties U (about what will be the outcome), i.e. (C, U). For simplicity, we write onlyC, instead of AandC.
We may rephrase this definition by saying that risk associated with an activity is to be understood as (Aven and Renn 2008a):
Uncertainty about and severity of the consequences of an activity, where severity refers to intensity, size, extension, and so on, and is with respect to something that humans value (lives, the environment, money, etc.). Losses and gains, for example expressed by money or the number of fatalities, are ways of defining the severity of the consequences.
Hence, risk equals uncertainty about the consequences of an activity seen in rela-tion to the severity of the consequences. Note that the uncertainties relate to the consequencesC; the severity is just a way of characterising the consequences.
A low degree of uncertainty does not necessarily mean a low risk, or a high degree of uncertainty does not necessarily mean a high risk. Consider a case where only two outcomes are possible, 0 and 1, corresponding to 0 fatalities and 1 fatality, and the decision alternatives areI andII, having probability distributions (0.5, 0.5) and (0.0001, 0.9999), respectively. Hence, for alternativeI there is a higher degree of uncertainty than for alternative II. However, considering both dimensions, we would of course judge alternativeII to have the highest risk as the negative outcome 1 is nearly certain to occur.
If uncertainty U is replaced by probabilityP, we can define risk as follows:
Probabilities associated with different consequences of the activity, seen in relation to the severity of these consequences.
In the example above, (0.5, 0.5) and (0.0001, 0.9999) are the probabilities (proba-bility distributions) related to the outcomes 0 and 1. Here the outcome 1 means a high severity, and a judgement about the risk being high would give weight to the probability that the outcome will be 1.
Reflection
Why not replace uncertainty (U) in the definition above with the probability (P)? Do we need both U andP?
Yes, we must have bothU andP. A probability is a tool to express our uncer-tainty with respect to AandC. However, it is an “imperfect tool.” Uncertainties may be hidden in the background knowledge, K. For example, you may assign a probability of fatalities occurring on an offshore installation based on the assump-tion that the installaassump-tion structure will withstand a certain accidental load. In real life the structure could however fail at a lower load level. The probability did not reflect this uncertainty. Risk analyses are always based on a number of such assumptions.
Various types of systems can be established to give a risk score of the uncer-taintiesU. One such approach is based on a two-stage assessment procedure. The starting point is a set of uncertainty factors, for example the number of leakages and the assumption that the installation structure will withstand a certain acciden-tal load. First, the factor’s importance is measured using a sensitivity analysis. Is changing the factor important for the risk indices considered (for examples of such indices, see Section 2.2)? If this is the case, we next address the uncertainty of this factor. Are there large uncertainties about the number of leakages and the load that the structure will withstand? If the uncertainties are assessed as high, the factor is given a high risk score. Hence, to obtain a high score in this system, the factor must be judged as important for the risk indices considered and the factor must be subject to large uncertainties.
The terms hazard and threat are used in the same meaning as risk, but are associated with an initiating event (A), for example, a fire. Hence the hazard fire is understood as fire risk (A, C, U). It is common to link hazards to accidental events (safety), and threats to intentional acts (security).
Reflection
Should the risk concept be restricted to negative consequences – to dangers and undesirable events?
This is the opinion of some; the word risk is associated with something unde-sirable and negative. There are, however, good reasons for not making such a distinction, and it is not unusual to relate risk to both negative and positive conse-quences. What is a negative consequence or outcome? To some, an outcome can be negative, and for others positive. We wish to avoid a discussion on whether a consequence is classified in the correct category. The point is to uncover all relevant consequences, and then assess uncertainties and assign probabilities.
We do not always introduce events A (see “Product sale” example above), and when we do, we let A be a part of the C. We can express the uncertainty associated withAandC by means of probabilities, and these indicate how likely it is that eventAwill occur and that specific consequences will take place, given our background knowledgeK. A description of risk will thus contain the components (C, U, P , K). Often we add C∗, which is a prediction of C. By a prediction we mean a forecast of what value this quantity will take in real life. In the “Product sale” example above we would like to predict the sales. We may use one number, but we often specify a prediction interval [a, b] such thatC will be in the interval with a certain probability (typically 90% or 95%). In the “Illness” example, our focus will be on prediction of the consequence C, given that the event A has occurred, i.e. the time it takes to recover. Experience shows that on the average it takes 1 month for recovery, and we can then use this as a prediction of the consequenceC. Alternatively, we could have based our prediction on the median, the value corresponding to the time within which half the number of patients will recover. In our case, we can predict that this will be 25 days. Using a number such as this is problematic, however, as the uncertainty about the consequences C is often large. It is more informative to use a prediction interval or formulate probabilities for various consequence categories of C, for example: the person will recover within 10 days, the person will recover within 1 month, the person will never recover or the person will die. We will return to such descriptions in Section 2.2.
If we say thatP (A|K)=0.10, this means that we judge it just as likely that the eventAwill occur as it is to draw a particular ball from an urn containing 10 balls. The uncertainty as to whether the eventAwill occur or not, is comparable to the uncertainty as to whether or not the particular ball in the urn will be drawn (see Appendix A).
Risk description
Risk is described by (C, C∗, U, P , K), where C equals the consequences of the
activity (including the initiating events A), C∗ is a prediction of C, U is the
uncertainty about what value C will take, and P is the probability of specific events and consequences, given the background informationK.
2.1
Vulnerability
event” is also used. Looking into the future, the consequences are not known, and vulnerability is then to be understood as the combination of consequences and the associated uncertainty, i.e.(C, U|A), using the notation introduced above.
The definition of vulnerability follows the same logic as that of risk. The uncertainty and the likelihood of various consequences can be described by means of probabilities, for example: The probability that the person will die from the specific illness.
A description of vulnerability thus covers the following elements:
(C, C∗, U, P , K|A),
i.e. the consequencesC, prediction of C (C∗), uncertaintyU, probability P and the background knowledgeK, given that the initiating eventAtakes place.
When we say that a system is vulnerable, we mean that the vulnerability is considered to be high. The point is that we assess the combination of consequences and uncertainty to be high should the initiating event occur. If we know that the person is already in a weakened state of health prior to the illness, we can say that the vulnerability is high. There is a high probability that the patient will die.
Vulnerability is an aspect of risk. Because of this, the vulnerability analysis is a part of the risk analysis. If vulnerability is highlighted in the analysis, we often talk about risk and vulnerability analyses.
2.2
How to describe risk quantitatively
As explained above, a description of risk contains the following components (C, C∗, U, P , K). How are these quantities described? We have already provided a number of examples of how we expressP, but here we will take a step further. We consider two areas of application, economics and safety. But first we recall the definition of the expected value,EX, of an unknown quantity,X, for example expressing costs or the number of fatalities. If X can assume three values, say
−10,0 and 100, with respective probabilities of 0.1, 0.6 and 0.3, then the expected value ofX is:
EX=(−10)·0.1+0·0.6+100·0.3=29.
We interpretEX as the centre of gravity of the probability distribution of X (see Appendix A).
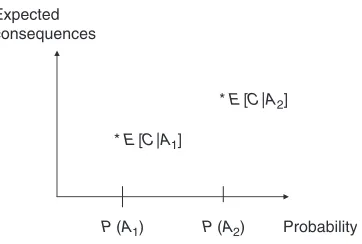
Imagine a situation where we are faced with two possible initiating eventsA1
andA2, for example, two illnesses. Should these events occur, we would expect
consequences E[C|A1] andE[C|A2], respectively. If we compare these expected
values with the probabilities forA1 andA2, we obtain a simple way of expressing
the risk, as shown in Figure 2.1. If the event’s position (marked *) is located in the far right of the figure, the risk is high, and if the event is located in the far left, the risk is low.
Probability Expected
consequences
* E[C|A2]
P(A2)
P(A1) * E[C|A1]
Figure 2.1 Risk description for two eventsA1andA2, with associated expectations E[C|A1] andE[C|A2].
Consequence category Probability
* P(C3)
C3 C1
* P(C1)
C2 * P(C2)
* P(C4)
C4
Figure 2.2 Risk description based on four consequence categories.
return to the “Illness” example above, where we defined the following consequence categories:
C1: The person recovers in 1 month C2: The person recovers in 1 month–1 year C3: The person never recovers
C4: The person dies as a result of the illness.
For the illness A1 we can then establish a description as shown in Figure 2.2.
Here P (C1)expresses the probability that the person contracts the actual illness
and recovers within 1 month, i.e.P (C1)=P (A1 andC1). We interpret the other
probabilities in a similar manner.
Alternatively, we may assume that the analysis is carried out conditional that the person is already ill, andP (C1)then expresses the probability that the person
will recover in a month. In this case,P (C1)is to be read asP (C1|A1).
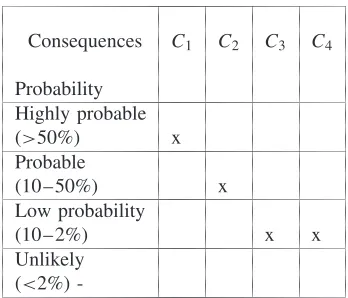
Consequences C1 C2 C3 C4
Probability Highly probable (>50%) x Probable
(10–50%) x
Low probability
(10–2%) x x
Unlikely (<2%)
-Figure 2.3 Example of a risk matrix. The x in column C1 shows that there is a
probability larger than 0.5 for consequenceC1. The numbers are conditional that
the person is ill.
to the figure (matrix) as arisk matrix. We see that the use of such matrices could make it difficult to distinguish between various risks since it is based on rather crude categories. Nonetheless, in many cases the risk matrix is sufficiently precise to provide an overview of the risk.
Often a logarithmic or an approximately logarithmic scale is used on the prob-ability axis. Risk matrices can be set up for different attributes, for example with respect to economic quantities, loss of lives, etc. We will present a number of examples of risk matrices throughout the book. We will also provide an in-depth discussion of the method. The reader is referred to Chapter 13.
2.2.1
Description of risk in a financial context
An enterprise is considering making an investment, and we denote the value of the return on this investment next year, byX. SinceXis unknown, we are led to predic-tions ofX and uncertainty assessments (using probabilities). Instead of expressing the entire probability distribution ofX, it is common to use a measure of central tendency, normally the expectation, together with a measure of variation/volatility, normally taken as the variance, standard deviation or a quantile of the distribution, for example the 90% quantilev, which is defined byP (X≤v)=0.90.
2.2.2
Description of risk in a safety context
In a safety context, terms such as FAR (Fatal Accident Rate), PLL (Potential Loss of Life), Individual Risk (IR) and F–N (Frequency–Number of Fatalities) curve are commonly used. We will explain these terms below.
In situations where risk is focused on loss of lives, the FAR value is often used to describe the level of risk.
The FAR value is defined as the expected number of fatalities per 100 million (108) hours of exposure.
When the FAR concept was introduced, 108 hours corresponded to the time of 1000 persons present at their place of work through a full life span. Today it takes 1400 persons to reach 100 million working hours. The FAR value is often related to various categories of activities or personnel. Such activity- or personnel-related FAR values are usually more informative than average values.
The expected number of fatalities over a year is referred to asPLL.
If we assume that there are n persons exposed to a risk fort hours per year, the connection between PLL and FAR can be expressed by the following formula:
FAR=[PLL/nt]108.
The average probability of dying in an accident for the n persons, referred to as theAIR (Average Individual Risk), can be expressed as
AIR=PLL/n.
Another form of risk description is associated with so-called safety functions (often referred to asmain safety functions). Examples of such functions are (PSA 2001):
• Prevent escalation of accident situations so that personnel outside the imme-diate vicinity of the scene of accident, are not injured.
• Maintain the main load carrying capacity in load bearing structures until the facility has been evacuated.
• Protect rooms of significance to combating accidental events, so that they are operative until the facility has been evacuated.
• Protect the facility’s safe areas so that they remain intact until the facility has been evacuated.
• Maintain at least one evacuation route from every area where personnel may be staying until evacuation to the facility’s safe areas and rescue of personnel has been completed.
Risk associated with loss of a safety function is expressed by the probability or the frequency of events in which this safety function is impaired. This form of risk description has its origin in analysis of offshore installations and is especially useful in the design phase.
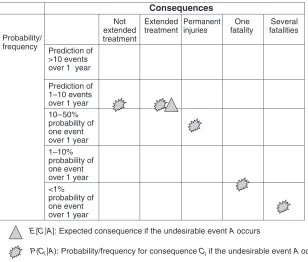
Consequences Insigni- Small Moderate Large Very large ficant (non-serious (serious (serious injuries, (>2 fatalities)
injuries) injuries) 1–2 fatalities)
Probability Highly probable (<1 year) Probable (1–10 years) Low probability (10–50 years) Unlikely (50 years or more)
Figure 2.4 Example of a risk matrix. The category “Unlikely” corresponds to a prediction of one event in 50 years or more, “Low probability” corresponds to a prediction of one event in 10–50 years, etc.
An alternative categorisation based on probability for a given year is shown in Figure 2.3.
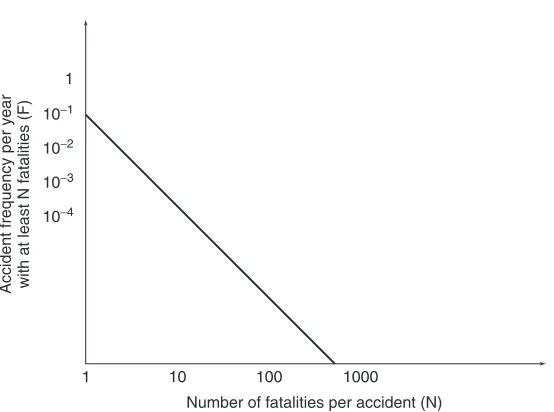
An F–N curve is an alternative way of describing the risk associated with loss of lives; refer to Figure 2.5. An F–N curve shows the frequency (i.e. the expected number) of accident events with at leastN fatalities, where the axes normally are logarithmic. The F–N curve describes risk related to large-scale accidents, and is thus especially suited for characterising societal risk.
10−1
10−2
10−3
1
10−4
1 10 100 1000 Number of fatalities per accident (N)
Accident frequency per year with at least N fatalities (F)
In a similar way, accident frequencies for personal injuries, environmental spills, loss of material goods, etc. can be defined.
Note that a frequency expresses an expected number of events per unit of time or per operation. The connection between frequency and probability is illustrated by the following example. Assume that for a specific company we have calculated a frequency of accidents leading to personnel injuries, at 7 per year, i.e. 7/8760=
0.0008 per hour. From this rate we may assign a probability of 0.0008 that such an accident will occur during 1 hour. This approach for transforming frequencies to probabilities work when this value is small; how small depends on the desired accuracy. As a rule of thumb one often uses “<0.10.”
It is also common to talk about observed (historical) PLL values, FAR values, etc. The meaning is then the number of fatalities per year (PLL) and the number of fatalities per 100 million exposure hours (FAR).
3
The risk analysis process:
planning
In this chapter, we discuss the planning of a risk analysis including the risk eval-uation, i.e. the risk assessment. The activity can be divided into the following two sub-activities; refer Figure 1.2:
• problem definition, information gathering and organisation of work (we refer to this as the problem definition activity);
• selection of analysis method.
3.1
Problem definition
The first step of a risk analysis is to define the objectives of the analysis. Why should we perform the analysis? Often, the objectives are based on a problem definition, as shown by the following example.
Example
A manufacturing company conducts a series of tests every day on its products and then stores the information in an Information and Communication Technology (ICT) system (called systemS) that automatically adjusts the production process at start-up the next day. If this information is erroneous, a large quantity of products may not meet the quality requirements and hence cannot be released into the market. This will result in significant economic losses. If system S fails, production must be stopped, again causing economic losses. To improve the reliability of systemS, management has decided to conduct a risk analysis with the following objective:
Based on a risk analysis of system S, addressing “failure of system S” and “erroneous information,” propose and recommend suitable risk-reducing measures.
When formulating the objectives, any limitations to the scope of the analysis must be taken into consideration, such as lack of available resources, time limits and lack of data and information. This is necessary in order to balance the complexity and size of the problem on the one hand, with the scope, ambitions and accuracy of the analysis on the other.
Clear boundaries for the analysis must be made, so that there is no doubt about what the results apply to. The operating conditions that are to be included in the analysis must also be determined. Examples of different operating conditions are start-up, normal operation, testing, maintenance and emergency situations.
A working group must be established. This group must have knowledge about risk analysis and about the system. Other types of specialised competence, for example in mathematical statistics, will be required in some cases.
A plan for the risk analysis should be drawn up. The plan should cover activities, responsibilities, work progress, time limits and milestones, reports and budget.
The risk analysis may address different types of attributes, such as life, health, environment, economic quantities, information, services, etc. If several attributes are to be analysed, it must be determined whether they are to be analysed separately, or they are to be combined in some way.
Experience shows that most focus is often placed on the risk analysis in itself, including analysis of data and risk calculations, and less on the planning and the use of the analyses. A more balanced analysis process will be achieved if we distribute the resources more evenly. A rule of thumb is that we should use one-third of the resources for planning, one-third for risk analysis and evaluation and one-third for the risk treatment.
It is essential that we make clear how the analyses are to be used in the decision-making process. The use, to a large extent, determines the risk analysis approach and methods. The interested parties must also be identified, so that the analysis can be suited to these parties.
Here are some examples on how the analysis can be used in the decision-making process;
• Consider changes in the risk: An analysis of the risk-reducing effect of the different alternatives or measures. The risk analysis may show, for example, that a particular measure reduces the risk by 2%, while another reduces the risk by 10%. This can in itself produce clear recommendations on what is a sensible strategy going forward, if the costs for the measures are about the same.
of ratio (index) can also be calculated in relation to quantities other than life, e.g. a ton of spilled oil. Empirical studies of implemented measures show large differences when it comes to the value of an implied statistical life.
• Cost-benefit analysis: A cost-benefit analysis is an approach to measure ben-efits and costs of a project. The common scale used to measure benben-efits and costs is the country’s currency. After transforming all attributes to monetary values, the total performance is summarised by computing the expected net present value, the E[NPV]. The main principle in transformation of goods into monetary values is to find out what the maximum amount society is will-ing to pay to obtain a specific benefit. Use of cost-benefit analysis is seen as a tool for obtaining efficient allocation of the resources, by identifying which potential actions are worth undertaking and in what way. According to this approach, a measure should be implemented if the expected net present value is positive, i.e. ifE[NPV]>0. Although cost-benefit analysis was originally developed for the evaluation of public policy issues, the analysis is also used in other contexts, in particular for evaluating projects in firms. The same methods can be applied, but using values reflecting the decision-maker’s benefits and costs, and the decision-maker’s willingness to pay.
To measure theNPV of a project, the relevant project cash flows (the move-ment of money into and out of the business) are specified, and the time value of money is taken into account by discounting future cash flows by the appropriate rate of return. The formula used to calculateNPV is:
N P V = n
t=0 at
(1+i)t, (3.1)
whereat represents the cash flow at timet, andi is the discount rate. The
terms capital cost and alternative cost are also used for i. As these terms express, i represents the investor’s cost related to not employing the cap-ital in alternative investments. When considering projects where the cash flows are known in advance, the rate of return associated with other risk-free investments, like bank deposits, makes the basis for the discount rate to be used in the NPV calculations. When the cash flows are uncertain, which is usually the case, the cash flows are normally represented by their expected values E[at] and the rate of return is increased on the basis of the
The method implies transformation of goods into monetary values, for example using the value of a “statistical life.” What is the maximum amount the society (or the decision-maker) is willing to pay to reduce the expected number of fatalities by 1? Typical numbers for the value of a statistical life used in cost-benefit analysis are 1–10 million euros. The Ministry of Finance in Norway has arrived at a value at approximately 2 million euros. For offi-cial cost-benefit analyses, the Ministry of Finance recommends use of a value of this order of magnitude.
An oil company uses the following guideline values for the cost to avert a statistical life (euros):
0
Highly effective, always implement 10,000
Effective, always implement 0.1 million
Effective; implement unless individual risk is negligible 1 million
Consider; effective if individual risk levels are high 10 million
Consider at high individual risk levels or when there are other benefits
100 million
Not socially effective – look at other options
• Risk acceptance criteria (risk tolerability limits): If the calculated risk is lower than a pre-determined value, then the risk is acceptable (tolerable). Otherwise, the risk is unacceptable (intolerable), and risk-reducing measures are required. One example of such a criterion is the following: the frequency of events during 1 year that leads to impairment of a safety function must not exceed 1·10−4. If the risk analysis arrives at a calculated frequency higher
than this limit, then the risk is unacceptable, and if the frequency is lower, then the risk is acceptable. We refer to Chapter 5.
• ALARP process: The risk should be reduced to a level that is As Low As Reasonably Practicable. This principle means that the benefits of a measure should be assessed in relation to the disadvantages or costs of the mea-sure. The ALARP principle is based on “reversed burden of proof,” which means that an identified measure should be implemented unless it cannot be documented that there is an unreasonable disparity (“gross disproportion”) between costs/disadvantages and benefits.
One way of assessing “gross disproportion” is outlined below (Aven and Vinnem 2005, 2007):
practice, economy, strategy considerations, risk, social responsibility, etc. The analysis would typically be qualitative and its conclusions summarised in a matrix with performance shown by a simple categorisation system such as very positive, positive, neutral, negative, very negative. From this crude analysis a decision can be made to eliminate some alternatives and include new ones for further detailing and analysis. Frequently, such crude anal-yses give the necessary platform for choosing one appropriate alternative. When considering a set of possible risk-reducing measures, a qualitative analysis in many cases provides a sufficient basis for identifying which measures to implement, as these measures are in accordance with good engineering or with good operational practice. Also many measures can be quickly eliminated as the qualitative analysis reveals that the burdens are much more dominant than the benefits.
2. From this crude analysis the need for further analyses is determined, to give a better basis for concluding which alternative(s) to choose. This may include various types of risk analyses.
3. Other types of analyses may be conducted to assess, for example, costs, and indices such as expected cost per expected number of saved lives could be computed to provide information about the effectiveness of a risk-reducing measure or compare various alternatives. The expected net present value may also be computed when found appropriate. Sensitivity analyses should be performed to see the effects of varying values of statistical lives and other key parameters. Often the conclusions are rather straightforward when calculating indices such as the expected cost per expected number of saved lives over the field life and the expected cost per expected averted ton of oil spill over the field life. If a conclusion about gross disproportion is not clear, then these measures and alternatives are clear candidates for imple-mentation. Clearly, if a risk-reducing measure has a positive expected net present value it should be implemented. Crude calculations of expected net present values, ignoring difficult judgements about valuation of possi-ble loss of lives and damage to the environment, will often be sufficient to conclude whether this criterion could justify the implementation of a measure.
4. An assessment of uncertainties in the underlying phenomena and processes is carried out. Which factors can yield unexpected outcomes with respect to the calculated probabilities and expected values? Where are the gaps in knowledge? What critical assumptions have been made? Are there areas where there is substantial disagreement among experts? What are the vul-nerabilities of the system?
large calculated risk under certain conditions, but the manageability could be good and could resul