Measuring Public-sector
Productivity in Selected
M
easuring
P
ublic-sector
P
roductivity in
S
elected
(13-RP-04-GE-RES-B)
Dr. Hiroaki Inatsugu, Japan, served as the volume editor.
First published in Japan
by Asian Productivity Organization Leaf Square Hongo Building, 2F 1-24-1 Hongo, Bunkyoku Tokyo 113-0033, Japan www.apo-tokyo.org
© 2016 Asian Productivity Organization
The views expressed in this publication do not necessarily reflect the official views of the
Asian Productivity Organization (APO) or any APO member.
All rights reserved. None of the contents of this publication may be used, reproduced, stored, or transferred in any form or by any means for commercial purposes without prior written permission from the APO.
ISBN 978-92-833-2465-2 (PDF)
FOREWORD...viii
INTEGRATED SUMMARY ...1
INTRODUCTION ... 1
NATIONAL GOVERNMENTS AND THE APO ... 2
THE APO AND THE PUBLIC-SECTOR PRODUCTIVITY ... 4
WHAT IS PUBLIC-SECTOR PRODUCTIVITY? ... 5
3.1. Productivity in the private sector and in the public sector ... 5
3.2. The Case of Finland ... 7
3.3. The Case of Australia ... 9
3.4. The Case of New Zealand ... 13
3.5. The Case of the UK and LSE’s study ... 15
OUR APPROACH AND FINDINGS ... 18
4.1. Our project ... 18
4.2. Research overview ... 19
Research Addendum: Review of the key concepts ... 21
REFERENCES ... 24
BANGLADESH...26
INTRODUCTION ... 26
The role of the public sector ... 27
TAX COLLECTION SERVICE ... 28
2.1. Introduction about the Agency ... 28
2.2. Input and Output Data and Analysis ... 35
2.3. Initiatives Undertaken ... 40
2.4. Best Practices and Lessons Learned ... 41
2.5. Future Plan ... 41
PASSPORT SERVICE ... 41
3.1. Introduction about the Agency ... 41
3.2. Initiatives Undertaken ... 52
REFERENCES ... 54
INDONESIA ...55
OVERVIEW OF INDONESIAN PUBLIC-SECTOR REFORM ... 55
TAX COLLECTION SERVICE ... 57
2.1. Introduction to the Agency ... 57
2.2. Data Input and Output, and Data Analysis ... 64
2.3. Initiatives Undertaken ... 70
2.4. Best Practices and Lessons Learned ... 73
ISSUING PASSPORT SERVICE ... 73
3.1. Introduction to the Agency ... 73
3.2. Input and Output Data and Analysis ... 75
3.3. Initiatives Undertaken ... 77
3.4. Best Practices and Lessons Learned ... 79
REFERENCES ... 81
ISLAMIC REPUBLIC OF IRAN ...83
INTRODUCTION ... 83
IRANIAN NATIONAL TAX ADMINISTRATION ... 86
2.1. Introduction ... 86
2.2. Input and Output Data and Analysis ... 87
2.3. Initiatives Undertaken ... 95
2.4. Best Practices and Lessons Learned ... 103
CONCLUSION ... 105
REFERENCES ... 106
PAKISTAN ...107
INTRODUCTION ... 107
TAX COLLECTION SERVICE ... 109
2.1. Introduction about the Agency ... 109
2.2. Input and Output Data and Analysis ... 110
2.3. Initiatives Undertaken ... 121
3.2. Initiatives Undertaken ... 128
3.3. Best Practices and Lessons Learned ... 129
SUMMARY/CONCLUSION/RECOMMENDATION ... 130
REFERENCES ... 131
Appendix-I ... 133
PHILIPPINES ...145
INTRODUCTION ... 145
1.1. Background and Objective of the Study ... 145
1.2. Profile of the Philippine Public Sector ... 146
1.3. Initiatives to Promote Public Sector Productivity ... 149
TAX COLLECTION SERVICE ... 155
2.1. About the Bureau of Internal Revenue ... 156
2.2. Input and Output Data and Analysis ... 163
2.3. Changes in the Tax Collection Service ... 168
2.4. Best Practices and Lessons Learned ... 171
CONCLUSION AND RECOMMENDATIONS ... 174
ACKNOWLEDGMENTS ... 175
REFERENCES ... 175
APPENDICES ... 178
ENDNOTES ... 181
SRI LANKA ...185
INTRODUCTION ... 185
1.1. Background of the Study ... 185
1.2. Administrative Structure of Sri Lanka ... 185
1.3. Management Performance Initiatives in Sri Lanka ... 188
1.4. Objectives of the Study ... 194
1.5. Selected Organizations for the Research ... 194
TAX COLLECTION SERVICES ... 194
2.1. Introduction ... 194
2.4. Initiatives Undertaken ... 208
2.5. Best Practices and Lessons Learned ... 210
PASSPORT SERVICES ... 210
3.1. Introduction ... 210
3.2. Input and output data and analysis ... 211
3.3. Main Changes in the Passport Issuing Administration in the Last 12 Years ... 213
3.4. Initiatives Undertaken ... 215
3.5. Best Practices and Lessons Learned ... 215
CONCLUSION AND RECOMMENDATIONS ... 216
4.1. Conclusion ... 216
4.2. Recommendations ... 216
REFERENCES ... 217
THAILAND ...219
INTRODUCTION ... 219
Results from public sector reform and development ... 223
Public Sector Service Award ... 225
The next step of public sector development ... 227
TAX COLLECTION SERVICE ... 227
2.1. Introduction about the Agency ... 227
2.2. Input and Output Data and Analysis ... 228
2.3. Initiatives Undertaken ... 231
2.4. Best Practices and Lessons Learned ... 233
PASSPORT SERVICE ... 235
3.1. Introduction about the Agency ... 235
3.2. Input and Output Data and Analysis ... 236
3.3. Initiatives Undertaken ... 237
3.4. Best Practices and Lessons Learned ... 238
CONCLUSION AND RECOMMENDATIONS ... 240
Public-Sector Productivity in Vietnam ... 250
TAX COLLECTION SERVICE ... 252
2.1. Introduction about the Agency ... 252
2.2. Input and Output Data and Analysis ... 257
2.3. Initiatives Undertaken ... 260
2.4. Best Practices and Lessons Learned ... 263
SUMMARY/CONCLUSION/RECOMMENDATION ... 268
REFERENCES ... 269
The discourse on governance recognizes the importance of effective, efficient institu -tions in conducting public affairs and managing shared resources. This is not simply because the public sector is directly involved in national development and competi-tiveness initiatives, but also because it is responsible for ensuring high-quality services
to satisfy societal expectations. Demands for greater efficiency and transparency and
recognition of room for improvement in the public sector are serious concerns to many.
Determining the productivity of a specific public service has proved to be challenging
as this is not only limited to the principles covering the measurement of outputs, inputs,
and productivity. An additional significant point is that output growth should take into account the quality of change. This point is confirmed in almost all the country
reports included in this volume when correlating productivity and the overall quality improvement and impact of public services.
The Asian Productivity Organization (APO) has focused on public-sector productivity growth and its measurement in recent years. Various initiatives have been undertaken to
help improve the motivation and skill level of public officials, strengthen management
systems, and enhance performance given the changing environment and current
commitment to public-service renewal in many countries. This volume examines efforts to enhance the productivity of governments in selected APO member economies.
Specifically, the research on which it is based investigated the productivity levels of
collecting taxes and issuing passports in Bangladesh, Indonesia, IR Iran, Pakistan, the Philippines, Sri Lanka, Thailand, and Vietnam. The research methodology was inspired by recent developments in measuring public-service productivity in advanced economies outside the region. The contributors to this book agreed that policy and government quality would continue to play important roles in raising public-sector productivity.
The APO thanks all authors from member countries for their commitment to the research and publication, especially Professor Hiroaki Inatsugu, who oversaw the entire process. I hope that the contents of this volume will contribute to the ongoing discussion on governance, public management, and public-sector productivity in member economies and elsewhere.
Mari Amano Secretary-General Tokyo
Dr. Hiroaki Inatsugu
Professor
Faculty of Economics and Political Science, Okuma School of Public Management Waseda University
INTRODUCTION
This book grew out of a 2013–14 report of the Asian Productivity Organization’s (APO) [1] project, Research on Performance Management for Public-sector Organizations, which was a year-long undertaking advanced by national experts from eight countries. Project participants were motivated by the conviction that “this current period of trans-formation puts more emphasis on measuring the productivity of the public sector within the framework of organizational performance management.” Indeed, for years public
sector productivity remained a neglected area of inquiry (due mostly to ‘flat produc -tivity’ assumptions based on the supposed immeasurability of government output). Recently however, performance management research of public sector institutions has become more robust and sophisticated, now focusing not only on individual employees, but also teams, programs, processes, and organizations in their entirety. In light of such
transformation, this book aims to investigate specific new systems and approaches intro
-duced by several Asian governments, and thereby gauge efficiency and efficacy levels of
selected government services.
And while I believe the current work makes an important contribution to our under-standing in this area, some of the issues raised are thorny and not without potential pitfalls. For example, politicians and reformers continue to make wide references to the notion
of “productivity,” often inflating the concept by linking it too broadly with the notion of
The present book consists of nine chapters. In this first chapter I define the concept of
public sector productivity and also review the recent literature which relates most directly to our concerns and objectives. I also set the target of this research and overview the empirical analyses of chapter 2–9. Following this introductory, chapter national experts
from eight Asian countries review and analyze nation-specific initiatives and productivity
trends in the areas of tax collection and passport issuance (Chapters 2–9) (the reason for this particular focus I explain below).
NATIONAL GOVERNMENTS AND THE APO
The government or the public sector creates the policy, infrastructure, and service delivery environment so that the private sector, civil society, other nongovernmental organizations and individual citizens can be more effective partners as engines of growth in the socio-economic development of a country. APO nations, of course, are no exception; the public sector plays a vital role in all member countries by facilitating direct and indirect contributions to GDP through economic and business development (which in turn often leads to other positive effects, such as employment generation). We must also not overlook the public sector’s key role in providing for health, education and welfare (including social security and safety net services) in general (universally), and by extension, in each country analyzed in this study.
We are now in an era of marked change and reform; in particular, numerous governments
continue to be influenced and guided by the movement of New Public Management (NPM). The NPM paradigm has spurred ministries and agencies to significantly
re-envision their roles, strategies and goals in order to transform themselves so that they
might become more cost-efficient and accountable as institutions. Some key elements
in this process include: the introduction of various forms of decentralized management; increased reliance on markets for the provision of public services; and the placing of greater emphasis on performance, output and customer orientation in the management of public-sector organizations. While reforms recently implemented by APO members vary in depth, scope and level of success, administrations are often united by the similarity of
issues faced and goals pursued, as reflected in the specific policies, institutional reforms,
and technologies implemented in order to promote greater governmental accountability.
The implications of this change mean new approaches and new systems within the
government and public service delivery. It has been one of the aims of this research to look
into this changing phenomenon and see how effective and efficient the public sector has
The APO itself was established in 1961 as a regional intergovernmental organization with the mission to contribute to the sustainable socioeconomic development of Asia and
the Pacific through enhancing productivity. Fortunately, the APO has never lagged in its
calling, steadily coordinating projects that have helped member nations adapt to rapid
change through improvements to both private and public-sector efficiency. For example,
the APO has long conducted research into, and advised member countries on, improving productivity in both the agricultural and industrial sectors, as well as for small and medium
enterprises (SMEs). More specifically, the APO may currently be seen as guided by the
following three strategic lines of thought:
1. Strengthen NPOs (National Productivity Organizations) and promote the devel-opment of small and medium enterprises (SMEs) and communities. NPOs are the backbone of the APO and thus need to be strengthened to lead national productivity initiatives. SMEs play a crucial role in the economies of members. The APO aims to improve the productivity of targeted segments of SMEs and communities. 2. Catalyze innovation-led productivity growth. Productivity improvement is not
limited only to increase efficiency. It also includes innovation-led gains that
increase the quality and performance of products and services.
3. Promoting Green Productivity. The APO will work with member countries to promote green technologies and create demand for green products and services. In addition, special effort will be directed to promoting sustainable practices in the agriculture sector [2].
For our purposes it’s crucial to remember that the APO long emphasized private-sector productivity; in contrast, a keen focus on public-sector productivity has just begun. The APO has increasingly recognized the important role of the public sector to deliver services more productive and produce results of higher value to the society. Further, throughout Asia the calls for more effective governance and better quality of public services (both from the general public and the private sector) have never been louder.
This is surely due to a series of ongoing and emerging challenges to the region: fiscal
In short, for years the APO has been concerned, justifiably, about industry, labor,
agriculture, and private service-sector productivity; but it is high time that the organization also takes a leadership role with regard to the public sector.
THE APO AND THE PUBLIC-SECTOR PRODUCTIVITY
Over the past several years, the APO has launched a series of public sector-related projects designed to address the needs of member countries. In 2009, for example, a Study Meeting on Public-sector Productivity was held in Seoul; participants discussed the status of the public sector, visions for public-sector modernization, and proposals for a public-sector development agenda. However, while generally appreciative of APO efforts, delegates to the Workshop Meeting of Heads of NPOs (in Manila) nonetheless suggested that the APO identify the scope of issues to address, as well as priority areas to focus on, so that countries might realize optimum results. This led to a smaller group meeting, comprised of specialists, organized at the APO Secretariat (Tokyo) in February 2010. There, experts discussed the framework and methods of APO projects related to public-sector productivity.
Of special note is the Study Meeting on Innovation in Public-sector Service Delivery, held in Jakarta in November 2010. Recognizing the importance of providing services to
the general public in a more efficient manner, participants identified improvement in
public-service delivery systems as one of the key areas the APO should emphasize, along with ‘lean management’ and knowledge management. As a follow-up to the Jakarta meeting, a Study Meeting on the Lean Management System in the Public Sector was held in Bangkok in August 2011.
Throughout this process many began to sense the need to develop a public-sector produc-tivity framework that could guide the APO and NPOs in member countries, enabling them to streamline activities and adopt a coordinated approach which would also promote public sector innovation and productivity in the short, medium, and long terms.
In July 2012 (again in Jakarta) a workshop on public-sector productivity was held in order to discuss public-sector productivity and innovation (including relevant national and local
government policies) and to examine and confirm the direction of APO initiatives for
Although the APO has continued these efforts to improve public-sector productivity,
a single definition and benchmark for governmental productivity has never been agreed upon, making it difficult to collect broadly practicable, robust evidence of productivity
increases. Researches so far have focused on new methodologies adopted in the private sector—knowledge management, lean management, quality award schemes, total quality management, performance management and benchmarking but has not squarely addressed the problem of measuring public sector productivity. Thus, because most member
countries have been unable to accurately measure productivity in their respective public
sectors, it has been difficult for them to gauge the overall impact of implementing the
above-mentioned initiatives.
And so I wholeheartedly welcome the APO beginning a systematic measure of
produc-tivity in the public sector. As I mentioned earlier, although “producproduc-tivity” is a definite notion in the private sector, it is not an easy task to define it in the public sector. Let us
look at a previous study on public-sector productivity.
WHAT IS PUBLIC-SECTOR PRODUCTIVITY?
3.1. Productivity in the private sector and in the public sector
According to the OECD [3], “productivity is commonly defined as a ratio of a volume
measure of output to a volume measure of input use,” that is, outputs divided by inputs.
Very few have questioned this basic formula because it appears, at first glance, clear,
even obvious. And measurement of private-sector productivity can indeed be conducted by relying on such a straightforward framework. As Dunleavy and Carrera write in their critically important book, Growing the Productivity of Government Services (which I reference extensively below):
The total volume valuation of outputs for a firm or an industry can be derived
by multiplying the numbers of the outputs (units of goods and services produced and successfully marketed to customers) by the prices for which each has been sold. Price here automatically controls for the variations in the value of different
products within and across firms. This allows us to derive a price weighted
measure of overall output that is then divided by a measure of total inputs to obtain a productivity ratio [4].
…that we do not have anything equivalent to a price for (most of) the many different services and goods that government departments and agencies
produce. Public service outputs are generally supplied to citizens, firms or
other stakeholders for free, or at highly subsidized prices. In many cases…the consumption of public sector outputs is often made mandatory or imposed on citizens [4].
Until quite recently public-sector productivity was thought to be constant, based on the assumption that values of public sector outputs are in equilibrium with the costs of producing them—that is, with ‘inputs.’ It was also assumed that placing concrete values on the diverse range of public sector outputs governments generate was not feasible; thus, no effective measure of the volume of outputs (at the national level) could be achieved. In short, this approach provided a simple, straightforward solution to the challenge that non-market outputs—the kind typically produced by the public sector—do not have
intrinsic, quantifiable prices (values) in the manner private sector (market) outputs do.
Thus, measuring outputs in the public sector was done “by valuing the inputs that went into producing them—that is, by simply entering the costs of the government staff
employed, and the materials and procurements and capital used up in their production [4].”
More specifically, because productivity was consistently defined as the ratio of outputs
divided by inputs, conventional wisdom held that calculating public-sector productivity should always yield a value of ‘one’: outputs/inputs = inputs/inputs = 1. It is this ‘output=input’ approach (based on the assumption that output is equivalent to the input) which gave rise to the notion that there have been no meaningful productivity increases in the public sector, even over the long term.
To be sure, there has existed a group of reformers—comprised of both politicians and
government officials—who have advocated reforming public administration through the introduction of private sector methods, thereby enhancing efficiency. As Michael
Barzelay [5] asked rhetorically two decades ago: “What did these reformers know
about factory administration? They knew that an efficient factory system succeeded in
producing ever-increasing quantities of goods while reducing the cost of production.”
Thus, reformers’ understanding of the components of “efficient government” was “rooted
in their knowledge about industry.” And indeed, some reformers have helped prod
govern-ments to introduce specific private-sector processes and techniques. Crucially, though, as
In short, there still exists a crucial disparity: on the one hand, the ‘output=input’ approach leads logically to the conclusion that there have been zero increases in productivity in the public sector; on the other, reformers’ exaggeration of their achievements in enhancing
public-sector productivity needs to be amended through a reliance on firm statistical data. However, the efforts of researchers and officials to better define and measure productivity
in the public sector has helped spur (and to an extent coincided with) the increased intro-duction, across continents, of policies designed to raise productivity at both national and
local administrative levels. Let us next review a few significant cases.
3.2. The Case of Finland
By the early 1990s Finland found itself confronting numerous challenges, including contraction in the country’s labor supply, a rapidly aging population, and increased
international competition. Due in part to these factors, in 1995 Finland’s national statistical institution, Statistics Finland, commenced a project to measure public-sector productivity. According to Mervi Niemi, writing for the OECD in the late 1990s, “The aim of
the project is to develop a measurement and monitoring system for government sector production and productivity by using an output indicator method to measure the volume of output [6].” Under the terms of the project, for all central government services under
review, final output and output indicators are to be specified by the directing agencies
themselves. For example, at the National Board of Patents and Registration, indicators
were defined and recorded within the following categories:
1. Number of patents 2. Number of utility models 3. Number of trademarks 4. Number of pattern rights 5. Company register cases 6. Association register cases 7. Enterprise mortgage cases
Niemi also notes that the agencies (or ‘units’) for which input/output data are being gathered manage roughly 70–80% of central government employee compensation.
The early results indicated that growth rates of output and productivity vary markedly
to cover the non-measured part of service provision until the coverage of the measurement has been considerably expanded [6].”
Since 1995 Statistics Finland has continued to collect significant amounts of data, quanti -fying input, aggregate output, and productivity growth rates through careful measurement. “The measurement of productivity growth is carried out by comparing two consecutive time periods (years)…The aggregate growth rates are compiled by weighting the growth rates of input and output of each unit by the unit’s proportion of the compensation of employees compiled in the national accounts [6].”
As can be seen in Statistics Finland’s latest report (which measures productivity of central government agencies and institutions) year-on-year changes in ‘Total productivity’ as well
as ‘Labour productivity’ have been inconsistent, often fluctuating strongly. For example,
most recently (between 2011 and 2012) ‘Labour productivity’ rose by 1.1% while ‘Total productivity’ fell by 2.5%, which was the sharpest decline yet recorded for this index. (Figure 1).
%
-3 -2 -1 -0 1 2 3 4
2000 2001 2002 2003 2004
Labour productivity Total productivity
2005 2006 2007 2008 2009 2010 2012
Figure 1. Development in the productivity of central government agencies and institutions from previous year, %
Source: Statistics Finland, Statistics on central government productivity 2012. http://www.stat.fi/til/vatt/2012/vatt_2012_2013-10-11_tie_001_en.html [7]
Statistics Finland also breaks down productivity growth figures by individual ministry. For
Table 1. Change from previous year in output, inputs, and productivity by administrative sector 2010
Administrative sector
Change % from previous year 1)
Output Labour
input Total input
Labour productivity
Total productivity
Ministry of Justice 3.6 -0.8 1.0 4.4 2.5
Ministry of the Interior -4.3 -1.6 0.4 -2.7 -4.6
Ministry of Defence -1.8 -5.2 6.1 3.5 -7.5
Ministry of Finance -0.2 -0.5 0.1 0.2 -0.4
Ministry of Agriculture
and Forestry 1.1 -2.5 -1.7 3.6 2.8
Ministry of Transport and
Communications 0.4 2.2 -2.2 -1.8 2.6
Ministry of Education and
Culture 4.2 -4.0 -0.9 8.6 5.1
Ministry of Social Affairs
and Health -1.8 -1.5 2.2 -0.4 -3.9
Ministry of Employment
and the Economy — — — — —
Ministry of the
Environment — — — — —
Other administrative
sectors — — — — —
State administration total -1.0 -2.1 1.5 1.1 -2.5
1) Exhaustive data unavailable by administrative sector
Source: Statistics on central government productivity 2012. Statistics Finland [7].
3.3. The Case of Australia
According to the Australian government’s own website, “The Review of Government Service Provision was established in 1993 by Heads of Government (now the Council of Australian Governments or COAG) to provide information on the effectiveness and
A Steering Committee comprised of senior representatives from the central agencies of Australia’s state and territorial governments, and chaired by the Chairman of
the Productivity Commission, manages the Review with assistance of a Secretariat provided by the Productivity Commission [8].
Performance information is provided for 16 service areas, for example education policy, police services, as well as housing and related services for the homeless.
Services included in the 2014 RoGS
Child care, education and training
Early childhood education and care (chapter 3) School education (chapter 4)
Vocational education and training (chapter 5)
Justice
Police services (chapter 6) Courts (chapter 7)
Corrective services (chapter 8)
Emergency management
Fire and ambulance services (chapter 9)
Health
Public hospitals (chapter 10)
Primary and community health (chapter 11) Mental health management (chapter 12)
Community services
Aged care services (chapter 13)
Services for people with disability (chapter 14) Child protection services (chapter 15) Youth justice services (chapter 16)
Housing and homelessness
Housing (chapter 17)
Homelessness services (chapter 18)
Figure 2. Services included in the 2014 RoGS
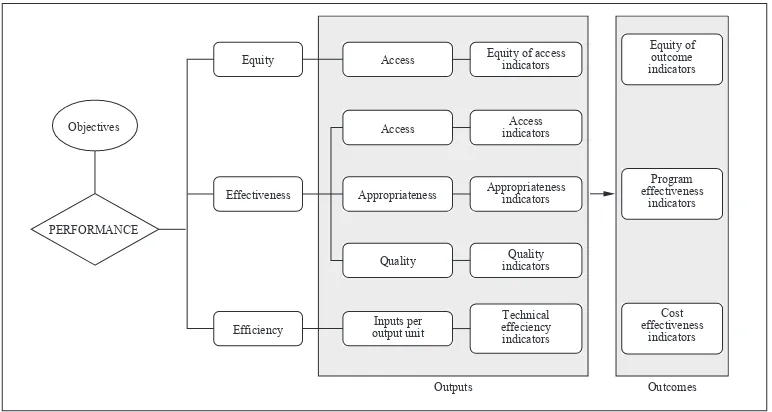
Equity
Figure 3. A general framework and examples of performance indicators
As can be seen in Figure 3, both outputs and outcomes are measured, as well as
“efficiency,” “effectiveness,” and “equity.” With regard to efficiency, the report’s focus is on technical efficiency, as explained below.
According to the 2014 RoGS, this “general framework reflects the service process through
which service providers transform inputs into outputs and outcomes in order to achieve desired policy and program objectives…To achieve these objectives, governments provide services and/or fund service providers. Service providers transform resources (inputs) into services (outputs) [8].” Within this framework, the rate at which resources are used to
effect transformation is referred to as “technical efficiency.”
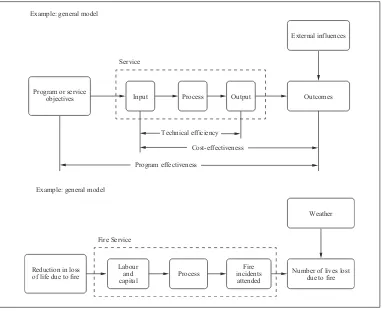
The Report contends that “the impact of these outputs on individuals, groups and the community are the outcomes of the service. In the RoGS, the rate at which inputs are used to generate outcomes is referred to as ‘cost effectiveness.’ Often, outcomes (and
to a lesser extent, outputs) are influenced by factors external to the service [8].” Figure 4 illustrates clearly the difference between technical efficiency (the ratio of inputs to
outputs) and cost-effectiveness (the ratio of inputs to outcomes), the Report
“acknowl-edg[ing] that outcomes may be influenced by factors outside the control of governments
or agencies delivering services.” The Report further accepts that “while
Example: general model
Example: general model
Program effectiveness Program or service
objectives Input
Service
Process Output Outcomes
External influences
Reduction in loss of life due to fire
Labour and capital Fire Service
Process
Fire incidents attended
Number of lives lost due to fire
Weather Technical efficiency
Cost-effectiveness
Figure 4. Service process
More specifically, the RoGS focuses on technical (or productive) efficiency [8]. As the report puts it:
Technical efficiency indicators measure how well services use their resources
(inputs) to produce outputs for the purpose of achieving desired outcomes. Government funding per unit of output delivered is a typical indicator of
technical efficiency, for example, cost per annual curriculum hour for vocational
education and training.
Comparisons of the unit cost of a service should reflect the full cost to
government. Problems can occur when some costs are not included or are treated inconsistently across jurisdictions (for example, superannuation, overheads or the user cost of capital).
Where there are shortcomings in the data, other indicators of efficiency are
in government schools, and administrative costs as a proportion of total expen-diture in disability services) [8].
In short, the Australian Productivity Organization report is measured and insightful; most importantly, it provides a useful resource that we can draw upon in the present study.
3.4. The Case of New Zealand
The New Zealand Government has been particularly keen to address public-sector produc-tivity issues. Its Fiscal Statement [9] sets forth one particular area of concern, the low rate of productivity growth, in the following manner:
Public-sector productivity is poorly measured in New Zealand and around the world. Better information on public sector productivity would make it easier to identify less effective policies. Nevertheless, based on the information we do have, our baseline assumption is that annual productivity growth in the public sector (0.3%) is about
one-fifth of economy-wide labour productivity growth (1.5%). This relatively low rate
of public sector productivity growth is due to both the nature of the services (which tend to be labour intensive with less scope for technological advances) and the operating environment (one without competitive market pressures) [9].
As is by now well known, New Zealand enacted radical public sector reforms, based on NPM principles, leading to a jump in privatization and deregulation since the 1980s. The following passage from the Statement expresses well the government’s underlying thinking:
If public-service productivity is lower than economy-wide productivity, then public services will become more expensive relative to other goods and services in the economy...
A lift in public-sector productivity would have a positive impact on the notional basket of services that could be delivered to the average New Zealander for a given level of spending. A 0.5 percentage point increase in our baseline assumption for annual public sector productivity growth, if sustained, would result in around 20% more public services per person after 40 years [9].
In short, due to historical and current political factors, New Zealanders are particularly
Of particular note is the Statement that a modest 0.5% annual productivity increase should result in roughly 20% more public services after 40 years. The Statement makes clear that, to meet such goals, New Zealand’s government cannot shy away from
tackling the most significant areas of the national budget (the “core public sector”), such
as health, education, and justice. This would involve taking a hard look at government departments “which account for around 18% of core government spending and employment [9].”
To buttress its arguments, the Statement directly references international management consultancy McKinsey, which has suggested “there is potential for public-sector
productivity improvements in various countries of 15% in the next 10 years” and also that
“benefits can be realised without major system changes through operational and business process improvement and shared services, such as streamlining finance, payroll and
administration functions across government [9].”
The Statement does acknowledge, however, that these are not easy goals to attain, requiring a sustained effort by government. For example, New Zealand currently affords its public sector chief executives considerable latitude in the directing and managing
of departments. Significantly increasing productivity may require moving away from
this arrangement and instituting greater centralized control, which is a course that could engender strong administrative resistance.
Moving to a second approach to consider, the Statement notes “Another major way the government can lower the cost of public services is to focus on what is delivered and to test policies and programmes more rigorously for their effectiveness – and to stop
those programmes that are not shown to be cost-effective [9].” A specific example given
is that of telecommunications, a service formerly provided by government which is now comprised of several private entities (indeed, many nations have moved from public control to privatization within this particular sector). In summary, the Statement presents a resolute attitude: “We have choices about such things. In the end, what services are delivered, and how, are the result of policy decisions [9].”
On the whole, the positions set forth in the Statement reflect proactive, yet sound,
In March 2010, Statistics New Zealand published a report, Measuring government sector productivity in New Zealand: a feasibility study [10]. The title appeared promising, seeming to offer a comprehensive review of public sector productivity as it relates to various sectors (through reference to inputs, outputs, and outcomes). However, the report tended to focus on healthcare and education exclusively,which is perhaps too narrow a focus.
Significantly, the Statistics New Zealand report makes direct reference to research
conducted in the UK: “In 2008, we were able to second Mr. Phillip Lee from the UK
Office for National Statistics. Mr. Lee has extensive expertise in the area of measuring
health care output and worked with Sir Tony Atkinson producing the Atkinson Report [10].” The description points to the importance of the Atkinson Report. Let’s next turn
specifically to this study.
3.5. The Case of the UK and LSE’s study
Since the 1990s, the UK government has been increasingly concerned over how to
accurately assess and understand public-sector productivity rates. This led the Office of
National Statistics (ONS) to move progressively away from the “output=input” approach and, beginning in the early 2000s, to propose a new methodology for determining public- sector productivity in which outputs are directly measured using cost-weighted activity indexes.
Sir Tony Atkinson was asked by the ONS in 2003 to conduct an independent review of the measurement of government output in the National Accounts. The Final Report of the Atkinson Review well summarizes the fundamental problem that had hampered not just the UK but numerous other countries, as well as the response decided upon in the UK:
In many countries, and in the United Kingdom from the early 1960s to 1998, the output of the government sector has been measured by convention as of value equal to the total value of the inputs; by extension the volume of output has been measured by the volume of inputs. This convention regarding the volume of government output is referred to…as the (output=input) convention, and is contrasted with direct measures of government output. The inputs taken into account in recent years in the United Kingdom are the compensation of employees, the procurement cost of goods and services, and a charge for the
consumption of fixed capital. In earlier years, and in other countries, including
This new consideration of factors such as employee compensation and the procurement cost represents a step in the right direction.
At the heart of the Review lies the approach of defining a cost-weighted index of outputs based on the actual number of specific activities performed by any given public sector
department; this measure of output is then divided by an index of the total costs involved in producing the outputs.
The review outlines a number of principles covering the measurement of outputs, inputs
and productivity, stating with conviction, “we are firmly of the view that measures of
output growth should in principle take account of quality change [11].” Here, it is worth referencing in full the thinking underlying this approach:
Output divided by inputs provides a measure of productivity change. However, the move from the (output=input) convention to direct measurement of
government output should be carefully interpreted. It is a definite advance in the
sense that government output is no longer simply assumed to equal measured inputs, but
the move should not be seen as solving at a stroke the complex problem of measuring government productivity. The statistic obtained by dividing outputs
by inputs may no longer be equal to one by definition, but no single number,
however carefully constructed, can fully capture the performance of complex public services with multiple objectives. Productivity change should be inter-preted in the light of a range of other information – the triangulation principle [11].
The UK government accepted the findings and recommendations of the Review, and the
ONS has taken the lead role in fostering the implementation of these recommendations.
As a top official of Finance Canada would praise it, “Anthony Atkinson has done an
The London School of Economics (LSE) Public Policy Group has continued work in
this same field, with the aim of understanding and measuring outputs and productivity as closely as possible [13]. The more specific goal has been “to explore the factors that drive
productivity change in this area and also to put such changes within the broader context of the implications of the switch from NPM to DEG [Digital Era Governance] approaches [13].” According to Dunleavy et al. [14], key themes of the DEG are “the re-integration of formerly scattered agencies belonging to a same public service area, the re-designing of structures and processes around the needs of users or clients to tackle the excessive dupli-cation and complidupli-cation of processes produced by NPM practices, and the digitalisation of administrative processes moving most of them online to simplify client contact with a given public service organization [14].”
The “main working hypothesis” of the LSE-PPG, as set forth in a 2009 working paper, is “that the change from NPM to DEG had an immediate negative effect on productivity as the re-centralization of activities and heavy investment in ICTs may have not paid off
immediately and a certain ‘adaptation’ time must have been necessary to fully profit from
organisational and ICT changes [13].” This may suggest that when new ICTs are introduced in certain public sectors, for example passport issuance or tax collection, productivity will initially decrease for several years before rebounding and beginning to rise.
The LSE-PPG study also included “a qualitative assessment of the key management changes in this area during the last twenty years; which illustrates the underlying change of public management approaches [13].”
Adjusted for
Adjusted for
・Output costs
・And perhaps Quality
Quality of different activites performed
For TFP:
Current spending on:
・Labour
・Intermediate resources
・Capital consumption
Or for Staff Productivity: FTE staff
Index of Outputs
divided by
Inputs
PRODUCTIVITY
Pay and price deflators
Total factor productivity (TFP) = Volume of output/Volume of total inputs, FTE productivity = Volume of output/Volume of FTE staff
Figure 5. The Atkinson Review’s Suggested Methodology for Measuring Government Productivity
Total factor productivity (TFP) = Volume of output/Volume of total inputs, FTE productivity = Volume of output/Volume of FTE staff
And most importantly, they are unambiguous in their praise, the Atkinson Review having “made a major step forward by recommending that to measure outputs we should take into account the total number of each of the activities performed by a given organization— a suggestion later taken up internationally [4].”
OUR APPROACH AND FINDINGS
4.1. Our project
police. I would like to add that their work should prove very helpful to other countries—in
large part because the definitions and explanations set forth are clear and accessible.
For these reasons it was felt the APO project could help put itself on sound footing by
employing Dunleavy and Carrera as a major reference point. However, as this is the first time
for the APO to employ such a framework, it was thought prudent to restrict the scope of
the present inquiry by focusing on two specific areas: tax collection and passport issuance.
It will maintain focus as well as consistency across different regions. In this project, we
reached an agreement to follow the framework set forth in the LSE’s findings. Chapters 2-9
review relevant data and analysis from eight member countries.
4.2. Research overview
I asked eight national experts to investigate the data of tax collection and passport issuance. However, it should be noted that, while all contributors tried to obtain the relevant data on tax collection and passport issuance, some were met with considerable
difficulty in the latter area. Available passport data, in general, tends to be limited, and is
often further restricted due to security concerns. For these reasons, several of the chapters (the Islamic Republic of Iran, the Philippines, and Vietnam) below do not present analysis of this particular government function. Moreover, even the report which could obtain the data of passport issuance, some are only output data, which is total passport issuing, and couldn’t collect the data of input.
Most of the reports show the organizational chart of tax collection and passport issuance agency, which help us to understand the procedure easier.
Several reports contributed to calculate productivity trends. For example, if we look at the concluding remarks by the Philippines’ report, Total Factor Productivity (TFP) and the labor productivity index from 2000 to 2012 are in a positive upward trend. This resulted from increasing automation of its frontline and backroom operations. However, the trend was
interrupted in the late 2000s for five years. During this period, despite growth in the value
of output, the TFP series dropped in due to sharp increases in cost and salary. Although
experiencing a productivity decrease for five years, it started to increase again from 2010 due to significant growth in the value of outputs while the volume of inputs was contained.
The report concludes as follows:
… the Philippine tax collection service especially under the Bureau of Internal
Revenue has achieved higher tax collection efficiency and productivity through
and legal measures. Both its traditional measure, the tax effort, and the produc-tivity measures, TFP index and labor (staff) producproduc-tivity index, showed highly positive results. On one hand, we can conclude that the structural reforms such as the passage of new tax measures that widened the tax base and the legal approaches to heighten voluntary compliance such as the RATE contributed to the growth of the BIR’s volume of outputs. On the other, we can conclude that the DEG management approaches such as the computerized Integrated Tax System and e-services coupled with process reengineering allowed the BIR to contain the volume of inputs despite the mandated increases in salaries, thus maintaining high productivity (See page 174).
Readers might feel the lack of critical analysis with some chapters, but it resulted from the data availability of the respective country.
I have to add that due to the political situation in 2013 in Thailand, all government
agencies were not able to perform their duty as usual and it was very difficult to obtain official data because the agencies were closed. Thailand national experts tried to finish the
report in full length.
In this brief introduction I hope to have done the following: summarize recent trends in public sector productivity analysis (by taking up the examples of Finland, Australia, New
Zealand, and the UK); explain the significance of Dunleavy and Carrera’s work, which
the APO would do well to continue referencing going forward; review the general aims of, and challenges faced by, the APO in the area of public-sector productivity; and, lastly, explain the particular focus of, and approach adopted throughout, the present study.
Long felt unsuitable for, or perhaps even unworthy of, or cutting-edge productivity analysis,
public administration is now the focus of officials and academics who are applying to it
the latest management techniques and analytical frameworks (adopted largely from
the private sector). As discussed above, in just the last 20 years this has led to new and better
insights into how the government works and can be made more efficient; most importantly,
this deeper understanding is being put into practice to considerable effect. The APO has indeed lagged in these areas but, as a group, is determined to proactively move forward.
This study, I believe, represents one such step in the right direction, and should assist member countries as they continue to try to better understand (and hopefully enhance) productivity within their respective public sectors.
Research Addendum: Review of the key concepts
It is necessary to delineate the working definitions presented in the LSE study here. Firstly, Dunleavy and Carrera rightly reject both the tendency of some to inflate the scope
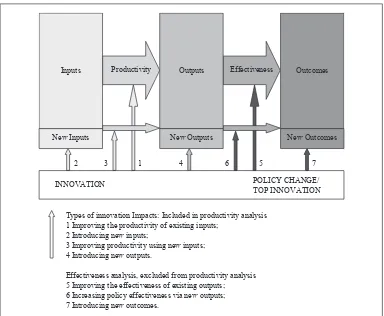
and usefulness of productivity (a tendency which often renders the concept vacuous) as well as the equally unsound position that productivity is largely irrelevant to government sectors. As the two succinctly put it: “Public-sector productivity is (and must remain) a single, deliberately limited measure, focusing solely on how many outputs are produced for a given level of inputs” (as shown in Figure 6) [4].
Inputs
New Inputs
INNOVATION POLICY CHANGE/
TOP INNOVATION
Productivity Outputs
New Outputs
Effectiveness Outcomes
New Outcomes
2 3 1 4 6 5 7
Types of innovation Impacts: Included in productivity analysis 1 Improving the productivity of existing inputs;
2 Introducing new inputs;
3 Improving productivity using new inputs; 4 Introducing new outputs.
Effectiveness analysis, excluded from productivity analysis 5 Improving the effectiveness of existing outputs; 6 Increasing policy effectiveness via new outputs; 7 Introducing new outcomes.
Figure 6. How Innovation influences productivity improvement via the introduction of
Dunleavy and Carrera further highlight the importance of separating “productivity” from
“policy effectiveness” or “efficiency.” Effectiveness, they contend, is more “concerned
with how the outputs produced translate (or not) into desired policy outcomes” while
efficiency is a “distinct [concept] unlinked to the systematic accumulation of data on
organizational performance that is our focus here [4].” Indeed, the title of Figure 5 is
revealing: “How innovation influences productivity improvement via the introduction of
new inputs, outputs and outcomes in government organizations, and why the analysis of productivity improvements need to be clearly separated from the analysis of effectiveness
[4].” (As we can see by referring back to Figure 3, the definition of productivity presented resembles the Australian Productivity Commission’s definition of “technical efficiency
[8].”
Dunleavy and Carrera stress that this figure “brings out one of the most important and
distinctive aspects of a focus on organizational productivity in the government sector, namely the close connection between it and the adoption of innovations inside government organizations [4].”
Thus, “In order to correctly estimate a measure of total output volume it is important to choose activity data covering the full range of activities performed by an agency, or the
analysis may underestimate its productivity figures [4].” At the same time, if we were to address the full range of measures officials are apt to request (with regard to the overseeing
of their own organizations) the resulting analysis would likely become overly complex. Dunleavy and Carrera therefore suggest that “relatively parsimonious coverage of key organization outputs should remain the goal [4].”
In this vein, they said that “broad gauge measures focusing on a small number of outputs are also generally preferable. A key question to ask about a government organization is what its broad mission is, and what few main outputs capture that mission and can be cost-weighted in a reasonably accurate manner [4].” They contend that main outputs tend to imply other secondary activities.
For instance, running a schools system might be measured in terms of the number of lessons delivered and the numbers of school students taught, with these main outputs also tending to denote a whole range of lesser activities (such as teachers marking children’s homework, talking to parents or liaising with other public agencies about students in
difficulties) [4].
UK central government”: social security, tax collection, customs, prison service, passport issuance, border protection, and driving and vehicle licensing [4]. (Again, our nascent project does well by maintaining a more narrow focus.)
Dunleavy and Carrera use, as the key data series for outputs, numbers of tax returns for
the major tax categories addressed [4]. Although we would like to refer to similar figures in our analysis, several member countries would have had difficulty obtaining such data.
However, the authors describe a possible alternative method for measuring outputs in
the area of tax collection: “using an appropriately deflated measure of the amount of tax
collected as the output measure [4].” One of these two outputs is taken up in each of the
following chapters. More specifically, I have asked the national experts to use
the following formulas in their analysis:
When using ‘number of tax returns processed’ as output, input for Total Factor
Productivity (TFP) shall be ‘deflated total labor cost, administration cost and, if available,
capital consumption for tax’ while input for Full-Time Equivalent Productivity (FTE productivity) shall be ‘number of full-time equivalent (FTE) staff for tax processing/ collecting.’
TFP = Number of tax returns processed
Deflated (labor cost+ administration cost+capital consumption) ……… (Formula 1.1)
FTE productivity = Number of tax returns processed
Number of full−time equivalent staff ……… (Formula 1.2)
When using alternative indicators ‘the amount of tax collected’ as output, the formula will be as follows:
TFP = The Amount of Tax Collected
(labor cost+ administration cost+capital consumption)……… (Formula 2.1)
FTE productivity = Deflated (The Amount of Tax Collected)
Number of full−time equivalent staff ……… (Formula 2.2) For over-time analyses of FTE productivity, the output ‘amount of tax collected’ should
be deflated by using specific price or GDP deflators. If, with Formula 2.2, an author used
‘gross labor cost’ (that is: ‘number of FTE’ X ‘average labor cost’) as the denominator,
Dunleavy and Carrera use ‘total number of passports issued’ as the key data series for outputs [3]. (P. 172 ff.) I thus asked our group of specialists to use this same output within the following formula:
TFP = Number of Passports Issued
Deflated (labor cost+ administration cost+capital consumption)………(Formula 3.1)
FTE productivity = Number of Passports Issued
Number of fulltime equivalent staff ……… (Formula 3.2)
REFERENCES
[1] The APO, founded in 1961, consists of 20 countries from the Asia-Pcific region.
http://www.apo-tokyo.org/about/history/, accessed on 15 January 2015.
[2] Asian Productivity Organization. APO Annual Report 2013, APO.
http://www.apo-tokyo.org/publications/wp-content/uploads/sites/5/2013_apoannual -report.pdf, accessed on 15 January 2015.
[3] OECD. Measuring Productivity OECD Manual: Measurement of Aggregate and Industry-Level Productivity Growth. 2001.
http://www.oecd.org/std/productivity-stats/2352458.pdf, accessed on 15 January 2015.
[4] Dunleavy P. and Carrera L. Growing the Productivity of Government Services. Cheltenham, UK: Edward Elgar; 2013.
[5] Barzelay, Michael. Breaking through bureaucracy: A new vision for managing in government. University of California Press. 1992.
[6] Niemi, M. Measuring government sector output and productivity in Finland - appli-cation of the output indicator method, agenda item 1, OECD meeting of national accounts experts, Statistics Directorate, STD/NA(98)4, 1-7r, Paris: OECD. 1998.
[7] Statistics Finland, Statistics on central government productivity 2012, Statistics
Finland. http://www.stat.fi/til/vatt/2012/vatt_2012_2013-10-11_tie_001_en.html,
[8] Australian Productivity Commission, 2014, Report on Government Services 2014: Volume A: Approach to performance reporting, Steering Committee for the Review of Government Service Provision, Australia (Australian) Productivity Commission. http://www.pc.gov.au/research/recurring/report-on-government-services/2014/
approach-to-performance-reporting/download-the-volume/rogs-2014-volumea-ap-proach-to-performance-reporting.pdf, accessed on 15 January 2015.
[9] New Zealand Treasury, 2009, Challenges and Choices: New Zealand’s long-term Fiscal Statement, New Zealand
http://tepataka.rethinking.org.nz/eserv/rcp:382/_Challenges_and_Choices.pdf,
accessed on 15 January 2015.
[10] Statistics New Zealand, 2010, Measuring Government Sector Productivity in New Zealand: a feasibility study, New Zealand.
http://www.stats.govt.nz/browse_for_stats/economic_indicators/productivity/
measuring-govt-productivity.aspx, accessed on 15 January 2015.
[11] Atkinson, T. Atkinson Review: Final report. Measurement of Government Output and Productivity for the National Accounts. London: Palgrave. 2005.
[12] Ab Iorwerth, A. How to Measure Government Productivity: A Review Article on “Measurement of Government Output and Productivity for the National Accounts” (The Atkinson Report), International Productivity Monitor, No. 13, pp. 57–74. 2006.
[13] Carrera L., Dunleavy P. and Bastow S. Understanding Productivity Trends in UK Tax Collection. London: LSE Public Policy Group Working Paper; June 2009.
[14] Pollitt, C. Book review: Patrick Dunleavy and Leandro Carrera. Growing the Productivity of Government Services, International Review of Administrative Sciences 79(3), pp. 582-583. 2013.
[15] Ab Iorwerth, A. Mastering Leviathan: A Review Article on Growing the
Dr. Md. Nazrul Islam
Director
National Productivity Organisation
INTRODUCTION
The importance of productivity for a higher standard of living doesn’t need to be over-emphasized. The history of human civilization is synonymous with the struggle for attaining higher productivity. Its importance has become more vital for the survival of nations, industry, enterprises, society and individuals. Productivity is often conceived in a narrow sense, but a broader interpretation is called for in its proper analysis. Since
the productivity of a given technology is defined as the ratio of outputs to inputs, it can
be increased by minimizing inputs and maximizing outputs. Viewed from this angle, the analysis of productivity should represent all major components of inputs and outputs including environmental concerns. From the side of inputs, industrial productivity can increase from tangible improvement in any one of its components such as manpower (labour/human productivity), machinery (system reliability) and raw materials (inventory). Hence, the analysis of industrial productivity should be extended beyond conventional
material efficiency to cover both human productivity and system reliability. Similarly,
from the side of outputs, productivity increases are not only due to higher production but also due to improved quality, lower costs, timely delivery, improved safety, higher morale and better social acceptability. Productivity, therefore, increases due to improvements in hardware technology and development of software technology such as know-how, management, marketing, technical, and other skills. Finally, productivity has an
environ-mental dimension as well; it involves environenviron-mental costs, benefits, and risks, which are technology specific.
It is to be noted that quality and productivity are not an accidental phenomena. It is always a result of intelligent effort and a will to produce a superior service. Quality encompasses safety performance, reliability, maintainability, durability and acceptability by the
consumers. Today the world has become more competitive based on quality of output and quality of services within the shortest possible time as per demand and utility of stake-holders. Quality and productivity never come without creativity. This highly depends on
The role of the public sector
To develop and keep up with the times for a country, it is necessary that it creates a working infrastructure. It is the country’s public services sector that is concerned with this. Public services in Bangladesh are services provided by the government to the community. They include police departments, military, public roads, public transit, primary education, healthcare
for the poor, fire departments, water supply, electricity, education, tax departments, passport
departments, waste disposal, and many more. The public sector might provide services that a
non-payer cannot be excluded from (such as street lighting) which benefit all of society rather
than just the individual who uses the services, (such as public education) and services that encourage equal opportunity.
The Bangladesh Public Service Commission plays a vital role in recruitment, promotion, discipline, posting, and transfer of government servants. This constitutional body ensures that decisions relating to the public services sector are made in line with equity and merit.
The Police Force in Bangladesh provides the people with internal security as well as acting to guard the nation’s assets from terrorists and criminal elements.
Water is a vital commodity for life on the planet. In Bangladesh, people know the impor-tance of water and how to access it. Many villages and small towns make use of wells and rivers as a water source. The water services sector is still developing at quite a slow rate and there are battles due to inadequate budgets.
Although Bangladesh’s road network has been greatly expanded, many roads are in poor condition. City streets are often congested and roadways are quite narrow. Several bridges have also been built, providing easy access to various regions in the country.
The public sector, sometimes referred to as the state sector or the government sector, is a part of the state that deals with either the production, ownership, sale, provision, delivery, or allocation of goods and services by and for the government or its citizens, whether national, regional, or local/municipal.
Examples of public sector activity range from delivering social security or administering urban planning to organizing national defense.
• Direct administration funded through taxation; the delivering organization generally has
no specific requirement to meet commercial success criteria, and production decisions
are determined by government;
• Publicly owned corporations (in some contexts, especially manufacturing, “state-owned enterprises”); which differ from direct administration in that they have greater commercial freedoms and are expected to operate according to commercial criteria, and production decisions are not generally taken by government (although goals may be set for them by government);
• Partial outsourcing (of the scale many businesses do, e.g., for IT services), is considered a public sector model.
TAX COLLECTION SERVICE
2.1. Introduction about the Agency
The name of the tax collection service authority is the department of the National Board of Revenue (NBR). The NBR is the central authority for tax administration in Bangladesh. It was established by President’s Order No. 76 of 1972. Administratively, it is under the Internal Resources Division (IRD) of the Ministry of Finance (MOF). The MOF has 4 divisions, headed by 4 permanent secretaries to the government, namely, the Finance Division, the IRD, the Banking Division, and the Economic Relations Division (ERD).
The secretary of the IRD is the ex-officio chairman of NBR. The NBR is responsible for
the formulation and continuous re-appraisal of tax-policies and tax-laws, negotiating tax treaties with foreign governments, and participating in inter-ministerial deliberations on
economic issues having a bearing on fiscal policies and tax administration.
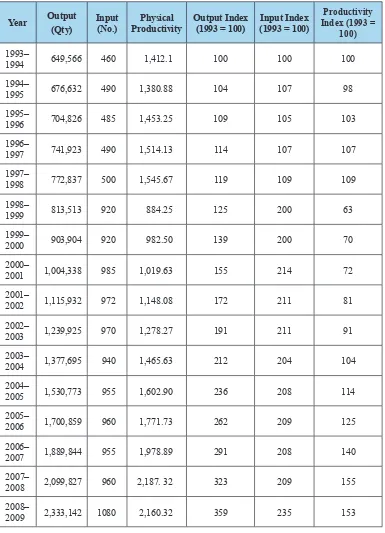
In Table 1 it is observed that the administrative structure of the tax circle and other offices
are increasing yearly from the entry period under study. It indicates that the number of taxpayers is also increasing.
Table 1. Tax Administrative Structure in Bangladesh
Serial
No. Name of the Office 2008–09 2009–10 2010–11 2011–12 2012–13
1 Circle 240 250 280 303 649
2 Supervisory Office Addl./Joint Tax
Commissioner 45 50 55 63 127
3 Tax Commissioner Administrative Office (Regional) 15 15 16 18 31
4 Tax Appellate Division 5 5 5 5 7
5 Divisional Representative
(appealed Tribunal) 5 5 5 6 7
6 Tax Inspection office 1 1 1 1 1
7 BCS Tax Academy 1 1 1 1 1
8 Central Tax Survey Region 1 1 1 1 1
9 Large Tax Payer Unit 1 1 1 1 1
Total 314 329 365 399 825
Source: National Board of Revenue Report, 2014 [3].
In Table 2 we can see that the manpower of the tax department is increasing yearly throughout the entry period under study. We can assume that the collected taxes are also increasing throughout the year under study.
Table 2. Manpower Structure in Tax Department in Bangladesh
Serial
No. Name of Post 2008–09 2008–09 2009–10 2010–11 2011–12 2012–13
1 Tax Commissioner/
Equivalent (Cadre) 15 18 20 22 25 40
2
Addl./Joint Commissioner/ Equivalent (Cadre)
Serial
No. Name of Post 2008–09 2008–09 2009–10 2010–11 2011–12 2012–13
3
Addl./Joint Commissioner/ Equivalent (Non Cadre)
0 0 0 0 0 1
4 Joint Commissioner
(Cadre) 35 45 48 50 54 106
5 Joint Commissioner
(Non Cadre) 0 0 0 0 0 1
6 Deputy Commissioner of
Taxes (Cadre) 120 125 135 140 149 264
7 Deputy Commissioner of
Taxes (Non Cadre) 0 0 0 0 0 3
8 Assistant Commissioner
of Taxes (Cadre) 150 160 170 180 216 369
9 Assistant Commissioner
of Taxes (Non Cadre) 15 15 18 25 30 41
10 Medical Officer
(Non Cadre) 0 0 0 0 0 1
11 2nd class staff 480 515 525 612 717 1,272
12 3rd class staff 1,500 1,750 1,800 2,012 2,209 3,908
13 4th class staff 1,480 1,500 1,650 1,700 1,908 2,837
14 Total 3,827 4,163 4,404 4,781 5,354 8,932
Source: National Board of Revenue Report, 2014 [3].
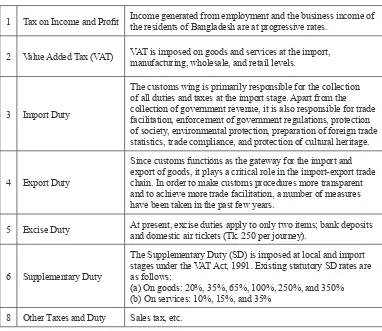
Value-added Tax
(i) VAT is imposed on goods and services at the import, manufacturing, wholesale, and retail levels.
(ii) A uniform VAT rate of 15% is applicable for both goods and services.
(iii) 15% VAT is applicable for all business or industrial units with an annual turnover of Taka 2 million and above.
(iv) Turnover tax at the rate of 4% is livable where annual turnover is less than Taka 2 million.
(v) VAT is applicable to all domestic products and services with some exemptions; (vi) VAT is payable at the time of supply of goods and services.
(viii) Export is exempt.
(ix) Cottage industries (defined as a unit with an annual turnover of less than Taka 2 million and with capital machinery valued up to more than Taka 2 million) are exempt from VAT.
(x) Tax returns are to be submitted on monthly, quarterly, or half yearly basis as notified by the government.
(xi) Supplementary Duty (SD) is imposed at the local and import stage under the VAT Act, 1991. Existing statutory SD rates are as follows: (a) On goods: 20%, 35%, 65%, 100%, 250%, and 350%; and (b) On services: 10%, 15%, and 35%.
Tax Base for VAT
Import Stage: Customs Assessable Value + Customs duty + Supplementary Duty Domestic/Local Stage
a) Goods (manufacturing): [Production cost + Profit and Commission (if any) + Supplementary duty (if any)]
b) Services: [total receipts excluding VAT but including supplementary duty (if any)]
Truncated Base/Fixed Value Addition:In some of the cases of goods and services,
producers and sellers face difficulties in availing VAT credit/adjustment facilities due to
non-availability of invoices from the sellers of input. In order to remove this operational
difficulty, fixed bases such as 10%, 25%, 30%, and 60% value addition is taken into
account for calculation of VAT for a number of goods and services. In such circumstances, the net VAT rate for different rates of value addition comes to 1.5%, 2.25%, 4.5%, and 9%.
VAT at the wholesale and retail stage:In the case of wholesalers and retailers, there is a special provision for a 1.5% VAT known as trade VAT on the total sale, provided that the wholesaler/retailer does not avail the facility of input credit/adjustment. Such a tax is also
collected at the import stage from importers of finished goods as an advanced trade VAT.
Tariff value for imposition of VAT: Under the VAT law, the government is empowered
to fix the tariff value for some items for the collection of VAT. For example, tariff value
for mild-steel products produced from imported/locally procured re-rollable scraps is Tk. 4,000.00 per MT. Normal VAT input credit is also not available under this system.