1
Beuth University of Applied Sciences Berlin – MBA Renewables
RE and EE Systems and Concepts
Grid
‐
Connected Zero
‐
Energy Home
Group #05
Lecturer Dr.‐Ing. Volkhard Scholz
Group Members Guillaume Gerard Gatoil
Guillermo Alberto Chacon Giron
Wolf-Dietrich Kindt
Martin Kreuzer
2
Table of contents
1. Introduction ... 3
2. Chosen house & Energy Consumption ... 3
3. Climate Data & Environmental Conditions ... 5
3.1. Solar Irradiation ... 5
3.2. Wind data ... 6
3.3. Hydrology data ... 6
3.4. Temperature ... 7
4. Zero Energy Home ... 8
4.1. Selected REN Technologies ... 8
4.2. REN Technology 1 – Photovoltaic Plant ... 9
4.3. REN Technology 2 – Solar Water Heater ... 14
4.4. REN Technology 3 – Wood Boiler ... 17
5. Discussion ... 20
5.1. Summary of technical choices ... 20
5.2. Pros & Cons ... 20
5.3. Conclusion & Recommendations ... 21
6. List of symbols / acronyms ... 22
7. List of figures ... 23
8. List of tables ... 23
9. Annexes ... 24
9.1. Annex #1: PV System Design Spreadsheet ... 24
9.2. Annex #2: PV Technology Selection ... 24
9.3. Annex #3: SunPower X-Series 21% Commercial Datasheet ... 25
9.4. Annex #4: PV Energy Yield Simulation from software PVSol ... 26
9.5. Annex #5: Storage Tank Viessmann Vitocell 300B ... 27
3
1. Introduction
The main objective of this assignment is to provide a solution with renewables sources
of energy for a chosen house in Germany in such a way that the balance of consumed
fossil energy and the generated renewable energy (REN) is zero over the year.
First, the chosen house will be introduced with its real energy consumption data. In
sequence, the environmental conditions will be analysed regarding the location of the
house.
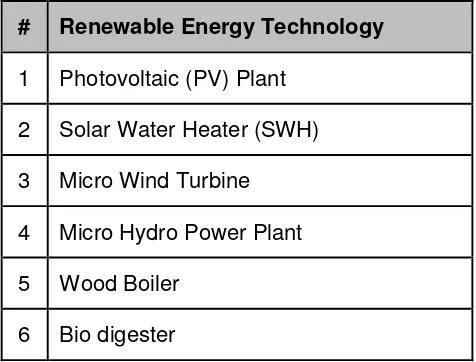
Based on these information of energy consumption and climate data, three renewable
technologies from Table 1 will be chosen in order to achieve this assignment objective.
All calculations will be made to size the systems.
# Renewable Energy Technology
1 Photovoltaic (PV) Plant
2 Solar Water Heater (SWH)
3 Micro Wind Turbine
4 Micro Hydro Power Plant
5 Wood Boiler
6 Bio digester
Table 1: Renewable Energy Technologies considered for this assignment
2. Chosen house & Energy Consumption
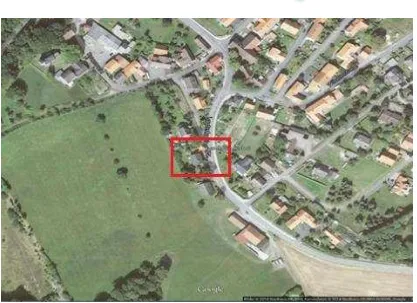
The chosen house for this study was built in the 70’s and is situated in a little village in
Germany. The exact location is Lauterbacher Straße, 34516 Vöhl Obernburg, Hessen –
Germany and the geographical coordinates are 51°13'55.5"N 8°54'18.2"E. Two
4
Figure 1: Google image from the chosen house
5 The electricity and oil consumption is read out only once a year. The energy consumption
in 2013 for 2 residents is shown in the table 2.
Consumption 2013
Electric Energy Wel 3,000 kWh
Fuel Oil for central Heating (water and house)
3,000 ltr = 30,000 KWh (1KWh = 0.1L of petrol)
Table 2: Energy consumption for the chosen house in 2013 for 2 residents
Nowadays, the heating for the central heating and the warm water system is done by an
oil fired water boiler connected to a hot water storage tank.
The tank “Viessmann Vitocell γ00 B” is a twin coil cylinder, the upper one for a boiler and
the lower one for a solar water heating system (datasheet in annex). Currently only the
boiler is used.
3. Climate Data & Environmental Conditions
3.1. Solar Irradiation
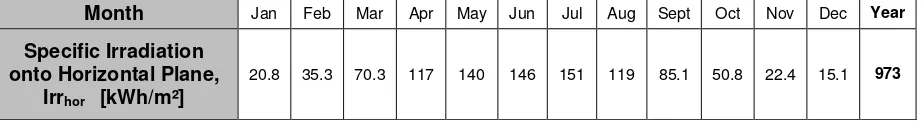
The meteorological database used was obtained from Meteonorm 7.1. Using the city of
Vöhl, which is about 5 km from the chosen house and considering that the modules are
facing to the South West with an angle of 255° (with 0° being North), we obtain the solar
irradiation data as listed in Table 3.
Month Jan Feb Mar Apr May Jun Jul Aug Sept Oct Nov Dec Year
Specific Irradiation onto Horizontal Plane,
Irrhor [kWh/m²]
20.8 35.3 70.3 117 140 146 151 119 85.1 50.8 22.4 15.1 973
6 3.2. Wind data
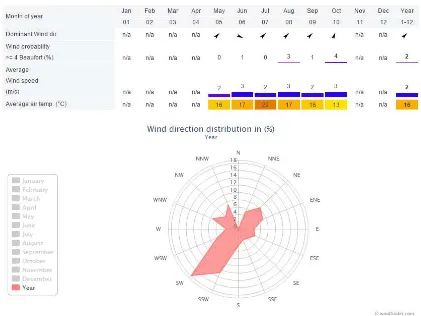
A wind station is located in Basdorf/Edersee, which is around 5 km from the house. For
this work we are assuming the same data for our chosen house. The wind data was
collected from the weather service of Windfinder and is shown in Figure 4 (access date:
31.11.2014). The data is accessible online at:
http://www.windfinder.com/windstatistics/basdorf_edersee.
Figure 3: Wind data of a wind station 5 km away from the house location
Average wind speed are null for 6 months of the year. For the other 06 months, wind
speed are between 2 to 3 m/s. Generally wind turbines start generating power from 3 to
4 m/s. Wind power is not appropriate for this site.
3.3. Hydrology data
A river is located around 350 m away from the house, as shown in Figure 5. No hydrology
7 distribution system crossing over neighbours properties, wood and a road. Hydropower
plant is not appropriate for this site.
Figure 4: Distance from the house to the closest river and surroundings analysis
3.4. Temperature
The temperature data were taken from the Photovoltaic Geographical Information
System (PVGIS) of the European commission (available on the website
http://re.jrc.ec.europa.eu/pvgis/apps4/pvest.php#, access date: 31.11.2014) using the
coordinates of the house provided in section 2.
Table 4 shows the temperatures for the given location, where:
● TD: Average daytime temperature (°C)
● T24h: 24 hour average of temperature (°C)
Month Jan Feb Mar Apr May Jun Jul Aug Sept Oct Nov Dec Year TD 1.1 2.1 5.6 10.4 14.2 17.1 18.9 18.9 15.2 10.9 6 1.8 10.2 T24h 0.2 0.7 3.9 8.7 12.7 15.8 17.6 17.3 13.4 9.2 5 0.9 8.8
8
4. Zero Energy Home
The objective of this assignment is to provide a solution with renewable sources of
energy for a chosen house in Germany in such a way that the balance of consumed
fossil energy and the generated renewable energy (REN) is zero over the year.
This section will show the selected REN technologies and explain the reasons for the
choices. Calculations for each REN solution will also be presented in order to
demonstrate technical feasibility of a sustainable domestic energy supply with renewable
sources. Concrete costs for installation, operation and maintenance will not be a part of
this study.
4.1. Selected REN Technologies
Section 3 identifies wind and water as unfavourable options as energy sources, while
solar irradiation shows to be an available source of energy.
Therefore, the two first solutions proposed focus on technologies that uses the sun as
primary source, as follows:
1. Photovoltaic Plant (PV Plant) as an electrical energy source.
2. Solar Water Heater (SWH) as a heating source for domestic use.
Section 2 indicates a higher energy consumption with heating than electricity. The SWH
alone will cover hot water demand consumed by the residents but it is not enough to
generate energy for space heating. Therefore, a third solution is necessary to cover
complementary the demand for heating during cold seasons.
3. The chosen technology to supply space heating energy is the Wood Boiler.
The bio digester technology was declined due to insufficient organic waste availability to
9
4.2. REN Technology 1 – Photovoltaic Plant
4.2.1. Position of the collectors and real solar irradiation
Due to the geographical location of the house on the northern hemisphere, the modules
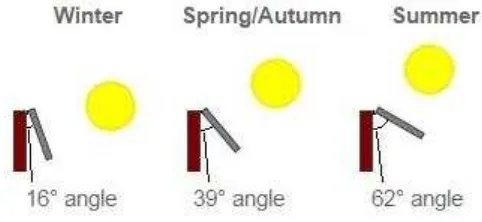
should be oriented to face south. The optimal inclination is approximately the latitude of the house, which in our case is 51°. In details:
● solar angle ( ) at solar noon, when the irradiance of the sun is at its highest, are:
- β1st Jun: = 6β.β° (best inclination of the module is = 90° - 62.2° = 27.8°)
- 21st Dec: = 15.4° (best inclination of the module is = 90° - 15.4° = 74.6 degrees)
● mean solar angle during the year ( m) = 38.8°, then, the best inclination angle of
the module would be 90° - 38.8° = 51.2°
Figure 5: Best solar angles illustrations according to seasons for the area of Düsseldorf.1
For the chosen house, the modules will be installed on the roof, whose inclination is 30° (Table 5). Therefore, the modules will not be on the optimal position.
Optimal Real
Azimuth α [°] 0 75 Inclination [°] 51.2 30.0
Table 5:Optimal conditions for the PV system and the real conditions at the house
10 For a module at an arbitrary tilt and orientation equation (1) 2 describes how much
irradiation the module receives:
Irrsol = Irrinc ·[cos( )· sin( ) · cos(α - ) + sin( ) ·cos( )] Equation (1)
where:
Irrsol: Irradiation at the surface of the module
Irrinc: Irradiation Incident to the module
: Solar Angle
: Inclination of the module (in our case, 30°) α: Azimuth of the module (in our case, 255°)
: Sun Azimuth = 180°
Knowing that:
Irrinc = Irrhor / sin( ) Equation (2)
where:
Irrhor: Irradiation on the horizontal plane (Table 3)
and replacing (2) in (1), we obtain:
Irrsol = Irrhor · [cos( ) · sin( ) · cos(α - ) + sin( ) · cos( )] /
sin( ) Equation (3)
Table 3, presented in section 3.1, gives the monthly irradiation on the horizontal plane
(Irrhor). Table 5 below shows the real solar irradiation on the surface of the module
considering the solar angle per month (Irrsol).
Month Jan Feb Mar Apr May Jun Jul Aug Sep Oct Nov Dec Year
Table 6: Real solar irradiation on the surface of the module considering the solar angle
per month Irrsol.
2
11 With the modules installed with = γ0° of inclination and α = βηη° (SW) direction,
the real solar irradiation on the module surface is Irrsol = 970.44 [kWh/m²] per year.
4.2.2. Efficiency and PV Module Area
For our calculations, we will use the following data for the modules3 and inverter:
● Module efficiency ηmod = 21.15 %
● Area of one module unit = 1.63 m2
● Rated power = 345 Wp
● Inverter efficiency ηinv = 96 %
The PV plant must produce an electric energy of at least Etot = 3,000 [kWh] to supply the
current electricity demand of the house. Using the equation:
WPV, demand = Irrsol· Apv· mod· inv· (1 - Losses) Equation (5)
where
WPV, demand: Total energy = 3,000 kWh
Irrsol: Irradiation at the surface of the module = 970.44 kWh/m²
Apv: PV Module Area
mod: Module efficiency = 21.15 % inv: Inverter Efficiency = 96 %
Losses = installation losses assumed to be 10% = 0.10 This results in a required total module area of Apv = 16.91 m2.
As one module has an area of 1.63 m2, a total of 11 modules is required to cover the
yearly electricity consumption of the house4.
The resulting PV system will have a total area of 17.93 m2 with a module
efficiency of mod = 21.15 %.
3 See Annex β “PV technological selection” & Annex γ “SunPower X-Series β1% commercial datasheet”.
4“ee A e PV ields si ulatio fro soft are PV“ol for alidatio of al ulated data a d e a ple
12
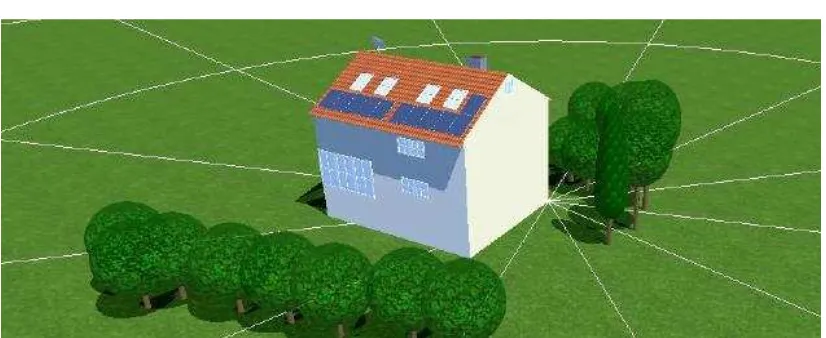
Figure 6: 3D simulation of the PV modules on the house with real slope and azimuth orientation. Source: PVSol
4.2.3. Performance ratio
To calculate the performance ratio we will use the following equation:
PR = (Yf / Yr) Equation (6)
where:
Yf: Energy delivered to the grid per year and KWp (specific Annual Yield) Yr: Theoretically available energy
Considering that the PV system will have 11 modules and each module produces 345
Wp, the PV plant produces a total nominal power of 3.795 KWp.
The energy delivered is calculated by equation (5):
WPV = 970.44 · 17.93 · 0.2115 · 0.96 · 0.90 = 3,179.60 kWh/y
The energy delivered to the grid per year and kWp (Yf) is then equal to:
Yf = 3,179.6 / 3.795 = 837.84 [h/year]
The theoretically available energy (Yr) is the total in-plane irradiance in kWh/m2 per year
divided by the reference irradiance G, which is 1 [kW/m2].
Yr = 970.44/1= 970.44 [h/year]
Performance ratio is then calculated by equation (6):
PR = Yf / Yr = 837.84 / 970.44 = 0.86
13 4.2.4. Power Generation and solar fraction
The total power generation WPV, as calculated in section 4.2.3, is 3,179.60 kWh per year.
The annual solar fraction fPV is calculated dividing this amount by the total demand of our
project, which is 3,000 kWh:
fPV = WPV / WPV, demand = 3,179.6 / 3,000 = 1.0599
fPV = 105.99%
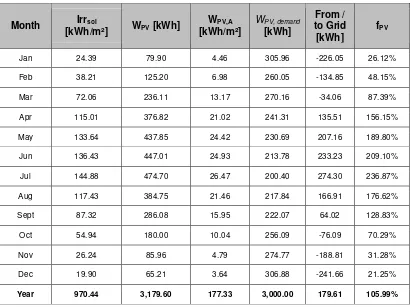
Table 65 shows the monthly electrical power generated by the PV system W
PV and per 1
m² module area WPV,A, as well as the monthly solar fraction fPV. The monthly demand of
electricity WPV, demand results from average proportions of consumption through the days
of the year in German households and is taken from the simulation software package
PVSol.
Jan 24.39 79.90 4.46 305.96 -226.05 26.12%
Feb 38.21 125.20 6.98 260.05 -134.85 48.15%
Mar 72.06 236.11 13.17 270.16 -34.06 87.39%
Apr 115.01 376.82 21.02 241.31 135.51 156.15%
May 133.64 437.85 24.42 230.69 207.16 189.80%
Jun 136.43 447.01 24.93 213.78 233.23 209.10%
Jul 144.88 474.70 26.47 200.40 274.30 236.87%
Aug 117.43 384.75 21.46 217.84 166.91 176.62%
Sept 87.32 286.08 15.95 222.07 64.02 128.83%
Oct 54.94 180.00 10.04 256.09 -76.09 70.29%
Nov 26.24 85.96 4.79 274.77 -188.81 31.28%
Dec 19.90 65.21 3.64 306.88 -241.66 21.25%
Year 970.44 3,179.60 177.33 3,000.00 179.61 105.99%
Table 7: Power Generation and solar fraction for the PV system
5“ee A e PV s ste desig spreadsheet a d origi al E el file for o er ie of the o plete
14 The proposed PV system is supplying the annual electricity demand of the house
and generating a surplus of 179.61 kWh to the grid, with an annual power
generation of WPV = 3,179.60 kWh and WPV, A = 177.33 kWh per m².
4.3. REN Technology 2 – Solar Water Heater
4.3.1. Heat demands for warm water
Solar Water Heater (SWH) is the second REN technology chosen to supply the energy
demand and the first one for heating purposes. The warm water consumption assumed
is 40 litres at 60°C per person a day. Considering 2 residents in the house and an
average of 30.5 days per month, the monthly average warm water consumption is: 40 x
2 x 30.5 = 2440 l/month or 2.44 m3/month.
The daily energy demand is calculated with the formula:
Equation (7)
c: Specific Heat Capacity of Water = 1,16Wh/kg∙K
ΔT: Temperature Difference Between Hot and Cold Water = 60°C - TCold Water
The temperatures of the cold water are the average 24h temperatures (T24h) listed in
Table 4. The resulting monthly energy demand for warm water QH2O is listed in Table 8.
The highlighted cells show the months with an average daily temperature above 10°C.
Month Jan Feb Mar Apr May Jun Jul Aug Sept Oct Nov Dec Year
T24h [°C] 0.2 0.7 3.9 8.7 12.7 15.8 17.6 17.3 13.4 9.2 5 0.9 8.8 QH2O [KWh] 170 168 159 146 134 126 121 121 132 144 156 168 1745
Table 8: Monthly energy demand for warm water.
4.3.2. Position of the collectors and real solar irradiation
The collector will be installed on the same roof as the PV modules. Thus, the best angle
15 for the PV plant in section 4.2.1. We can consider the optimal inclination of the solar
collectors ( ) of 51.β° and anazimuth angle (α) of 0° (True South). But the real conditions
of the house roof, where the collectors will be installed, are different, as shown in table
8 below.
Optimal Real
Azimuth (α°) 0 75
Inclination (tilt °) 51 30
Table 9: Optimal conditions for the SWH system and the real conditions for the house
The solar irradiation on the solar collectors Irrsol is the same as for the PV modules,
calculated using Equation 3. Resulting values are listed in Table 10.
Month Jan Feb Mar Apr May Jun Jul Aug Sep Oct Nov Dec Year
Irrsol
[kWh/m²] 24,39 38,21 72,06 115,01 133,64 136,43 144,88 117,43 87,32 54,94 26,24 19,90 970,44
Table 10: Solar irradiation on the solar collectors Irrsol, calculated by using Equation 3.
4.3.3. Collector area
In winter time, the SWH energy generation is low, due to poor solar irradiation. For this
reason the SWH system will be installed in parallel with a second heating technology
(section 4.4). The second system will be used when average daily temperature is below
10°C. Therefore, the SWH will be calculated for the summer months (May to September)
when the average daily temperature is above 10°C.
The SWH system will be sized with the worst case scenario in order to assure enough
hot water. The highest heat demand for the SWH system is in September with 132 kWh
(Table 8).
The required collector area for warm water supply ASWH in the summer month will be
calculate using the following equation:
Equation (8)
Using:
Average monthly consumption = monthly energy demand for September from Table
16 Solar fraction for the summer month = 120 % (considering 20% of losses in energy storage)
Average monthly solar irradiation = monthly real solar irradiation Irrsol of September
from Table 10 = 87.32 KWh/m2 per month
System Efficiency = 50% (assumption)
This results in a required collector area of ASWH = (132 x 120%) / (87.32 x 50%) = 3.62 m2.
According to the products available on the distribution market (module dimensions of 1m
x 2m = 2m2/unit), two modules will be required.
The chosen solar collector will have an area of ASWH = 4.0 m2.
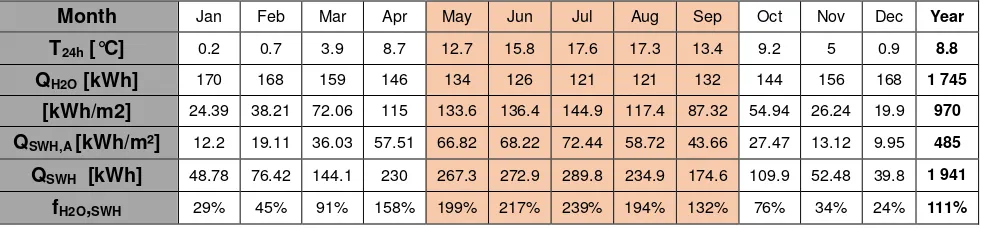
4.3.4. Heat yields and solar fraction
As the system efficiency is 50%, the monthly heat yields per m2 (Q
SWH,A) is always half
of the monthly real solar irradiation Irrsol of Table 10. The monthly heat yield of the
installed SWH system of the house (QSWH) is then given by multiplying the heat yield per
m2 by the collector area, which is 4.0 m2. The monthly solar fraction (f
H2O,SWH) is obtained
Table 11: Resulting heat yields QSWH and solar fraction fSWH of the SWH system.
6“ee A e “WH & Wood Boiler h rid s ste desig spreadsheet a d origi al E el file for a al sis
17
4.4. REN Technology 3 – Wood Boiler
The wood boiler will directly replace the current oil boiler. The system is connected to
the same water storage tank7 as the solar water heating systems. Since Space heating
and domestic hot water are interconnected in the same storage of heat energy, systems
can complement one another for space and water heating functions.
4.4.1. Heat demands for space The wood boiler will cover:
- Space heating (Qroom) during the month when it is necessary
o Heating is necessary in months with an average temperature of <10°C,
as in the assumptions for the SWH. Hence heating is necessary in Oct,
Nov, Dec, Jan, Feb, Mar and Apr.
o Monthly Qroom are calculated according to the formula with the
assumption that the house is well insulated:
Qroom = 1.2 kWh * (15°C – Tair)/°C per m². Equation 9
- Warm water supply (QH2O), complementally to the SWH when needed
o In the month of April the SWH will provide extra heat for the space
heating.
o During colder season the wood boiler will support the SWH because sun
irradiation is poor at those times.
Months Jan Feb Mar Apr May Jun Jul Aug Sep Oct Nov Dec Year
Table 12: Monthly balance heat demands of wood boiler Qwood for water QH2O,WB and space Qroom.
7“ee A e “torage ta k Viess a Vito ell B for te h i al u dersta di g of ho “WH a d
18 4.4.2. Wood Specifications
The wood boiler will be fired by wood pellets according to the standard EN 14961-2.
According to this standard, water content w in wood pellets has to be less than 10% with
a pellet bulk density of ≥ 600kg/m³. The lower energy content LHWFMhas to be ≥ 16.5
MJ/kg (for the A1 quality defined by EN 14961-2). For the calculation we assume LWHFM
= 16,5 MJ/kg (4.44kWh/kg).
4.4.3. Consumption of wood and storage
We consider the efficiency of the wood boiler at 80% to convert wood energy from
pellets to heat energy in the water storage tank. The wood consumption per month is
calculated from the heat demand for the wood boiler according to the formula:
Qwood = (Qroom + QH2O,WB) Equation 10
The resulting amount of wood pellets mFM is calculated using the energy content of
LWHFM = 4.44 kWh per kg:
mFM = Qwood /( • LWHFM) Equation 11
We can calculate storage volume Vstore accordingly:
Vstore = mFM / pellets density Equation 12
Resulting data are listed in Table 13.
Month Jan Feb Mar Apr May Jun Jul Aug Sep Oct Nov Dec Year
19 the winter months (QH2O, WB), when the SWH system is not sufficient, and cover to 100%
the space heating demands (Qroom). Therefore, the annual heat fraction for space heating
supplied by the wood boiler results to froom,wood = 100%. The heat fractions of the wood
boiler for water heating fH2O, WB are listed in Table 148. Furthermore, the total energy
needed for heating (Qtotal = QH2O, total + Qroom), the total energy supplied by the wood boiler
Qwood and the total heating fraction of the wood boiler ftotal wood are listed.
In addition, the total heat fraction of the SWH system is given in the table, taking the
fraction of the SWH for the total heat energy demand into account.
Month QH2O,tot
Table 14: Listed are the total heat demand Qtotal, the heat demand covered by wood boiler Qwood and the heat fractions of the wood boiler fwood.
The annual heat fraction of the wood boiler for warm water supply results in an
average of fH2O,WB = 23 % and the annual heat fraction for the wood boiler for the
total heat demand results to an average of ftotal wood = 94%.
8“ee A e “WH & Wood Boiler h rid s ste desig spreadsheet a d origi al E el file for a al se
20
5. Discussion
5.1. Summary of technical choices
Renewable energy technologies were investigated (Table 1), in order to identify three
convincing technologies for the renovation of a chosen 40 years old house. The house
was built in the 70’s and depends until now exclusively on fossil energy sources and
electricity from the national grid system. The addressed task was to find a site specific
concept for providing all consumed energy by renewable energy sources.
Considering the location of the analysed house, a wind turbine and hydro power plant
are not applicable as renewable energy sources. The average wind speed is not
sufficient to provide energy from wind turbines. A hydropower plant cannot be installed
as a river is not accessible from the premises of the house. Concerning a bio-digester,
not enough organic waste is available on the premises.
Despite low average sun radiation and the inadequate orientation of the roof, the energy
demand can partly be meet by a photovoltaic plant and a solar water heater system. The
roof space available allows for the installation of the required 17.93 m2 photovoltaic
modules, producing 3180 kWh year which exceeds slightly the annual electricity usage
of 3000 kWh.
Solar water heater collectors can be installed with an area of 4 m² to provide 1941 kWh
per year for warm water heating. The energy conversion from solar energy to heat energy
works well during the summer months (April – September) at the house location. In order to provide enough energy for warm water and space heat during the winter
months (October – March) a wood boiler needs to be installed. The wood boiler works in perfect symbiosis with the solar water heater system.
21 5.2.1. Pros
Electricity and Petrol prices are increasing consequently and the world realises that
energy becomes valuable. The homeowner will see his electricity bill balance very small
(connection fees only) and wood pellets more affordable than petrol.
The house increases its degree of energy self-sufficiency and limits impact on the
environment.
5.2.2. Cons
The usage of wood is very convenient as it is easily storable. However burning wood,
even in a high efficient manner, is still emitting CO2. The supply of raw material is also
controversial: cutting trees and using fields that could serve food supply. Some
ecologists do not consider wood a sustainable source of energy.
The photovoltaic plant is providing energy generated during the day to the grid and
consumes energy from the grid during the night. Therefore, the PV plant does not
constantly self-consume electricity and the homeowners depend on the grid.
Using only solar power would require storing the electricity generated during the day in
some type of battery bank in order to become autonomous. However the cost of such
energy back-up system is doubling the investment from the original solar plant.
5.3. Conclusion & Recommendations
With the described renewable energy technologies photovoltaic, solar water heater and
wood boiler, the energy demand for the specified client can be met completely. In a next
step the installation cost for the suggested systems should be calculated, in order to
provide a conclusive picture of the profitability and feasibility of the proposed systems.
In addition, the reduction of energy can be achieved by reducing the energy
consumption. It is recommended to consider investing in low consumption items first, as
LED lights or insulation of the walls. Ultimately the REN systems can be designed smaller
22
6. List of symbols / acronyms
α Azimuth
Inclination
mod Module efficiency
Apv Photovoltaic module area
ASWH Solar water heater area
fPV Solar fraction
fSWH Heat fraction produced of solar water heater
fwood Heat fraction produced of wood boiler
Irrinc Irradiation Incident to the module
Irrhor Irradiation on the horizontal plane
Irrsol Irradiation at the surface of the module
mFM Total mass of wood pellets
Qroom Heat demand for space heating
QH2O Total heat demand for warm water
QH2O,WB
Heat demand for warm water, covered by wood boiler
QSWH Heat produced by solar water heater
QSWH,A Heat produced by solar water heater per m²
Qtotal Total Heat demand
Qwood Total heat produced by wood boiler
REN renewable energy PV Photovoltaic PR Performance ratio SWH Solar water heater
TD Average daytime temperature
T24h 24 hour average of temperature
Vstore Wood pellet storage volume
WPV, demand
Electricity demand
WPV Electricity generated by Photovoltaics
WPV,A Electricity generated by m²
23
7. List of figures
Figure 1: Google image from the chosen house
Figure 2: Front view from the chosen house
Figure 3: Wind data of a wind station 5 km away from the house location
Figure 4: Distance from the house to the closest river and surroundings analysis
Figure 5: Best solar angles illustrations according to seasons for the area of Dusseldorf.
Figure 6: 3D simulation of the PV modules on the house with real slope and azimuth
orientation. Source: PVSol
8. List of tables
Table 1: Renewable Energy Technologies considered for this assignment
Table 2: Energy consumption for the chosen house in 2013 for 2 residents
Table 3: Solar Irradiation Irrhor data of the city of Vöhl used for the calculations for the
chosen house. Source: Meteonorm 7.1
Table 4: Temperatures for the house location
Table 5:Optimal conditions for the PV system and the real conditions at the house
Table 6: Real solar irradiation on the surface of the module considering the solar angle
per month Irrsol.
Table 7: Power Generation and solar fraction for the PV system
Table 8: Monthly energy demand for warm water.
Table 9: Optimal conditions for the SWH system and the real conditions for the house
Table 10: Solar irradiation on the solar collectors Irrsol, calculated by using Equation 3.
Table 11: Resulting heat yields QSWH and solar fraction fSWH of the SWH system.
Table 12: Monthly balance heat demands of wood boiler Qwood for water QH2O,WB and
space Qroom.
Table 13: Wood pellet consumption
Table 14: Listed are the total heat demand Qtotal, the heat demand covered by wood
24
9. Annexes
9.1. Annex #1: PV System Design Spreadsheet
* Original version file attached “ZeroEnergyHome
-Group05_CalculationTables_Rev0β.0.xls”, Sheet “PV System”.
9.2. Annex #2: PV Technology Selection
Different PV technologies exists. The most common PV modules are made from crystalline solar cells. They are efficient under direct sunlight but their performance dramatically decreases when thick clouds are passing by. In the present location, irradiation under 1000 KWh/m2/year is sign of recurrent overcast weather.
CdTe or commonly called thin-film modules keeps sun efficient energy conversion into diffuse exposure. That is a good option but they take more space for the same nominal power installed. We must consider the roof space limitation and physical installation. Roof already integrate skylights where it will be difficult to work around. We must also keep some space for the SWH system.
26 9.4. Annex #4: PV Energy Yield Simulation from software PVSol
27 9.5. Annex #5: Storage Tank Viessmann Vitocell 300B
28 9.6. Annex #6: SWH & Wood boiler Hybrid System Design Spreadsheet
* Original version file attached “ZeroEnergyHome-Group05_CalculationTables_Rev0β.0.xls”,