This article is from the
February 2011 issue of
published by
The American Phytopathological Society
For more information on this and other topics
related to plant pathology,
Quantifying the Within-Field Temporal and Spatial Dynamics
of
Bean pod mottle virus
in Soybean
E. Byamukama, A. E. Robertson, and F. W. Nutter, Jr., Department of Plant Pathology, Iowa State University, Ames 50011
Abstract
Byamukama, E., Robertson, A. E., and Nutter, F. W., Jr. 2011. Quantifying the within-field temporal and spatial dynamics of Bean pod mottle virus
in soybean. Plant Dis. 95:126-136.
The prevalence and incidence of Bean pod mottle virus (BPMV) have been reported to be on the increase in the United States but little is known about the temporal and spatial dynamics of this virus within soybean (Glycine max) fields. A quadrat-based sampling method was developed to quantify the within-field spread of BPMV in soybean in 2006 and 2007. Twenty-five 30-cm-long quadrats were established within each row of soybean in field plots consisting of six rows, each 7.6 m long and spaced 0.76 m apart. Four treatments were used to influence the temporal and spatial dynamics of BPMV epidemics. Treatments were: (i) establishment of a point source of BPMV inoculum within soybean plots; (ii) lambda-cyhalothrin insecticide applied at the V1 and R2 growth stages; (iii) establishment of a BPMV inoculum point source, plus the application of foliar insecticide sprays at the V1 and R2 growth stages; and (iv) a nontreated, noninoculated control. All quadrats (census) were sampled beginning 25 days after planting; sampling continued every 8 to 11 days until plants were senescent. Sap from leaf samples was extracted and tested for BPMV by enzyme-linked immunosorbent assay. The incidence of BPMV per treatment was plotted against time to produce BPMV incidence curves
for temporal analyses. In addition, positions of BPMV-positive quad-rats were mapped for spatial analyses. BPMV was detected within soybean plots on the first sampling date in 2006 (30 May) and on the second sampling date in 2007 (21 June). The rate of BPMV temporal spread within treatments ranged from 0.11 to 0.13 logits/day in 2006 and from 0.05 to 0.07 logits/day in 2007. Doubling times for BPMV incidence among treatments ranged from 5.4 to 6.4 days in 2006 and from 10.0 to 14.1 days in 2007. Soybean plots that had the earliest dates of BPMV detection within quadrats (x) also had the highest BPMV incidence (y) at the end of the growing season (R2 = 66.5 and 70.4% for 2006 and 2007, respectively). Spatial analyses using ordi-nary runs, black-white join-counts, and spatial autocorrelation revealed highly aggregated spatial patterns of BPMV-infected quadrats over time. Bean leaf beetle population densities were linearly related to BPMV incidence (P < 0.0001) in both years, indicating that BPMV epidemics were greatly influenced by bean leaf beetle population den-sity. To our knowledge, this is the first study to quantify the seasonal temporal and spatial dynamics of BPMV spread within soybean.
Bean pod mottle virus (BPMV; Comoviridae) in soybean has
been reported to be increasing in prevalence throughout the north-central region of the United States, with disease intensities ap-proaching epidemic levels (7). The first report of BPMV in the region occurred in Iowa in 1968 (33). Since then, a number of other states in the north-central region have reported an increase in the prevalence and incidence of BPMV in soybean fields (4,7,13,24,25,36,46). Soybean yield losses due to BPMV have been reported to range from 3 to 60% (14,19,36,41,46). In addition to causing direct yield losses, BPMV causes seed discoloration in soybean, resulting in reduced quality and a lower price per bushel (10,12,46). Soybean plants infected with BPMV in the field have also been reported to have an increased risk of seed infection by
Phomopsis spp. (1,41).
Three primary sources of BPMV initial inoculum have been re-ported: (i) BPMV-infected seed, which results in a random distri-bution of BPMV-infected seedlings (estimated to be <0.1%); (ii) BPMV-infested bean leaf beetles (Cerotoma trifurcata Foster [
Col-eoptera: Chrysomelidae]) that survive the winter (estimated to be
responsible for <0.5% incidence in seedlings); and (iii) intercrop survival of BPMV within alternative perennial weed hosts (mostly plant species in the genus Desmodium) (13,15,17, 18,21,24,29). Individually, each of these sources appears to represent a fairly low risk as a source of BPMV initial inoculum; however, transmission via insect vectors may result in a high rate of plant-to-plant spread of BPMV and a substantial increase in
end-of-season BPMV incidence, as has been reported in soybean (3,7,17–19,46).
BPMV is disseminated primarily by insect vectors, of which the bean leaf beetle is the predominant vector. Bean leaf beetle popula-tion densities within soybean crops can be extremely high, espe-cially following mild winters (5,18,22,39). The observed increase in BPMV prevalence and incidence in the north-central United States has been attributed to increased winter survival of bean leaf beetles (15,21,39). To date, the highest population density of bean leaf beetles recorded in Iowa occurred in 2002 (201 bean leaf bee-tles per 50 sweeps) (7,19,35); however, no information regarding BPMV incidence is available for that year.
A few studies have reported an association between bean leaf beetle population density and BPMV incidence; however, these studies were largely based on a single sampling time or relatively few plant samples (5,13). To date, there is limited quantitative in-formation concerning the within-season rate of BPMV spread within soybean fields. Such information could lead to the develop-ment (and deploydevelop-ment) of more timely managedevelop-ment practices that could substantially reduce disease risk. Quantification of the within-field spread of BPMV may help to determine whether man-agement tactics should be aimed at reducing initial inoculum, the rate of spread, or both, in order to reduce disease risk. For exam-ple, quantification of the temporal spread of BPMV might indicate the growth stages at which foliar applications of insecticides would be most effective (31).
Dispersal pattern and virus retention characteristics of bean leaf beetles suggest that the spatial pattern of BPMV-infected plants would be mostly aggregated (2,16,23). Bean leaf beetles have been reported to have limited dispersal within the crop canopy (2,44), and may become nonviruliferous if they continually feed on healthy host tissue (43). Moreover, bean leaf beetles transmit BPMV in a noncirculative manner (i.e., the virus does not multiply inside the insect; 43), and overwintering beetle populations have
Corresponding author: F. W. Nutter, Jr., E-mail: [email protected]
Accepted for publication 7 October 2010.
doi:10.1094 / PDIS-07-09-0469
been found to be aggregated within both soybean fields and over-wintering sites (16,23).
At present, little information is available concerning the spatial pattern of BPMV-infected plants at the field scale, and no report has described BPMV spatial patterns over the course of an entire growing season. Recently, Redinbaugh et al. (34) reported that the spatial pattern of BPMV in field plots was aggregated in 98 of 160 plots (62%). However, only two sampling times were analyzed, and sampling dates when BPMV spatial patterns within plots were aggregated versus random were not reported. Information concern-ing changes in the seasonal dynamics of the spatial patterns of BPMV epidemics (aggregated versus random) is needed to develop appropriate sampling designs. For example, based upon spatial patterns and time of sampling, different sampling protocols may be needed to: (i) evaluate BPMV management tactics and integrated management programs, (ii) quantify the temporal rates of plant-to-plant spread of BPMV within soybean fields, or (iii) quantify the impact of the spatiotemporal dynamics of BPMV on soybean yield (26,30,32,37,40).
The above information is important because, in theory, random spatiotemporal patterns of pathogen spread will result in less yield loss than aggregated spatiotemporal patterns will, given the same levels of virus incidence (30–32,37,45). For example, when the spatial pattern of diseased plants is random, diseased plants will likely be neighbored by healthy (noninfected) plants, thereby allowing healthy plants to compensate for the yield loss that would occur in infected plants. With regards to aggregated spatial pat-terns, diseased plants are more likely to be neighbored by other diseased plants, thereby limiting the potential for yield compensa-tion to occur (32,40,45). In addicompensa-tion, quantitative data concerning the spatial patterns of disease epidemics obtained early in the growing season may provide valuable information concerning the epidemiological importance and probable primary source(s) of initial inoculum. For example, a random spatial pattern of diseased seedlings detected soon after crop emergence would implicate seed as a likely source of initial inoculum. Conversely, the presence of aggregated spatial patterns early in the growing season would more likely implicate the presence of BPMV-infested insect vectors (such as the bean leaf beetle) as the primary source of initial inoculum (22,23).
The objectives of this study were to: (i) quantify the temporal rates of within-field spread of BPMV, (ii) determine the spatial pattern dynamics of BPMV within soybean field from crop emer-gence to crop senescence, (iii) determine the impact of BPMV-inoculated and insecticide-treated soybean on the spatial and tem-poral dynamics of BPMV, and (iv) quantify the relationship be-tween bean leaf beetle population densities and BPMV spread within soybean.
Materials and Methods
Field plots. Field plots were established at the Iowa State Uni-versity Curtiss Research Farm in Ames. Soybean cv. NE3001 was planted on 5 May 2006 and 18 May 2007. This semideterminate, maturity group 3 cultivar is susceptible to BPMV, but has some resistance to Soybean mosaic virus (SMV) (11). Each soybean plot consisted of eight rows that were 7.6 m long and spaced 0.76 m apart. The two outermost rows and an additional 1.5 m of row on both ends of each plot served as borders to minimize edge effects. Each soybean plot was located at least 15.2 m from other experi-mental plots. Areas between plots were also planted to soybean (cv. NE3001). Using 30-cm wooden stakes, the six center rows of each soybean plot were partitioned into 25 30-cm-long quadrats (6 rows × 25 quadrats/row = 150 quadrats/plot). Quadrats were thinned to four evenly spaced plants per quadrat on 24 May 2006 and 12 June 2007.
Treatments. In order to obtain BPMV epidemics with differen-tial temporal and spadifferen-tial dynamics, four treatments were used: (i) the establishment of a point source of BPMV-infected soybean quadrats within plots; (ii) two foliar applications of lambda-cyhalothrin insecticide (Warrior 1.0 EC; Syngenta Crop Protection,
Greenville, NC), made at the V1 (first true leaf) and R2 (early reproductive) growth stages; (iii) the establishment of a BPMV-inoculated point source, plus two foliar sprays of Warrior at growth stages V1 and R2; and (iv) a nontreated, noninoculated control. Treatments were replicated three times using a randomized com-plete block design. For treatments that included a BPMV-inocu-lated point source (treatments i and iii), soybean plants located in the 13th quadrat positions of the center two rows (third and fourth rows) were mechanically inoculated on 30 June 2006 (56 days after planting, day of year [DOY] 181) and 13 June 2007 (26 days after planting, DOY 164). Inoculation was done using sap extracted from BPMV-infected soybean plants (1 g of leaf tissue per 3 ml of extraction buffer; Agdia, Inc., Elkhart, IN) that were maintained in the greenhouse. The BPMV isolate used in this study originated from a naturally infected soybean plant collected in 2006 from Ames, IA. Mechanical inoculations were performed by lightly dusting Carborundum (600-mesh) on the topmost, fully expanded leaf and then lightly rubbing the leaf surface with an index finger that had been dipped into BPMV-positive soybean leaf sap. For treatments receiving two foliar insecticide applications (treatments ii and iii), insecticide was applied at the rate of 204 ml a.i./ha using a CO2-powered sprayer at 40 Pa (18).
Data collection. To test quadrats for the presence or absence of BPMV, all four soybean plants within each quadrat were sampled every 8 to 11 days, beginning 25 days after planting. Sampling continued in both years until crop senescence. Each soybean plot (6 rows × 25 quadrats = 150 quadrats/plot) was sampled by removing a single leaflet from the youngest, fully expanded trifoliolate leaf from each of the four soybean plants within a quadrat. In greenhouse experiments, BPMV was first detected by enzyme-linked immunosorbent assay (ELISA) in apical soybean leaves, before lower (older) leaves tested positive (data not shown). All four leaflets from a quadrat were bulked and sealed in a prelabeled (plot, row, quadrat number) plastic bag (bulked sample). Samples were then stored at 4°C until sap extraction (a maximum of 3 days).
Sap extraction. Sap was extracted from each four-leaflet quad-rat sample using a leaf press (Ravenel Specialties Corp., Seneca, SC). Approximately 1 ml of general extraction buffer (Agdia, Inc.) was added between the metal rollers as leaflets were fed into the extractor rollers. Leaf sap from each sample was collected in a 5-ml wax paper portion cup and then immediately dispensed into prelabeled, 1.5-ml Eppendorf tubes. Tubes were stored at –20°C until testing for the presence of BPMV by ELISA (3). Between samples, mechanical rollers were thoroughly flushed with pressur-ized tap water and then with approximately 3 ml of extraction buffer.
ELISA assay for BPMV. A commercially available, double-antibody sandwich (DAS)-ELISA was used to test for the presence of BPMV in each soybean quadrat sap sample (Agdia, Inc.). All ELISA steps were followed as recommended by the manufacturer. Four known BPMV-positive and -negative samples were loaded into each plate as controls. Controls were obtained from green-house-grown soybean plants that had been tested previously and confirmed positive for BPMV by ELISA. After the second anti-body (BPMV alkaline phosphatase enzyme diluted 1:200 in en-zyme conjugate immunoassay buffer) was added, plates were incu-bated at room temperature for 2 h. Between each step, plates were thoroughly washed with phosphate-buffered saline + Tween 20 (PBST; Agdia, Inc.) using a microplate washer (Model ELx405; Biotec Inc., Winooski, VT). Color development substrate (p -nitro-phenol) was added after final washing, and plates were kept in the dark for 30 min before obtaining absorbance readings (at 405 nm) using a plate reader (Model Elx800; Biotek Inc.). Plates that did not result in four positive control wells were retested. A sample was considered BPMV positive if the absorbance value of the sam-ple was greater than twice the value of the mean absorbance for the negative controls (3,40).
each soybean plot was determined for each sampling date (30). Time to first detection for noninoculated plots was defined as the sampling date (DOY) at which one or more quadrats within a plot first tested positive for BPMV by ELISA. For BPMV-inoculated plots, date of first detection was defined as the sampling date when quadrats other than the two inoculated quadrats first tested positive for BPMV.
Temporal data analyses. To obtain BPMV incidence progress curves for each treatment, the percentage of BPMV-positive soy-bean quadrat samples within each soysoy-bean plot was plotted with respect to date of sampling (DOY) (30,31,40). To select the most appropriate population growth model to use for generating parame-ter estimates for slopes (rate of BPMV temporal spread) and inparame-ter- inter-cepts, rate curves for the change in BPMV incidence versus time (dy/dt versus t) were also plotted for each plot (30,32,40). Based on the shapes of the BPMV incidence progress and rate curves, three population growth models were selected and evaluated for model fit: the exponential model (lny), the logistic model [ln (y/1 – y)], and the Gompertz model [–ln(–lny)] (30,32,40). Incidence data were converted to proportions and transformed using these three population growth models. Transformed BPMV incidence data were regressed against time using linear regression (26,30,32,40). Model selection for the best fit to transformed BPMV incidence data over time was based upon the following criteria: a significant
F statistic (P ≤ 0.05), the coefficient of determination (R2), the
standard error of the estimate for transformed BPMV incidence (SEEy), and the subjective evaluation of standardized residuals versus predicted values of y (30,32,40). The model that best fit the data for all treatments and years was then used to obtain parameter estimates. The slope parameter obtained from the regression equa-tion for each plot was taken as a quantitative measure of the
tempo-ral rate of BPMV spread within a soybean plot. In order to quantify and compare treatment effects on BPMV epidemics, mean separa-tions for intercepts, slopes, areas under BPMV incidence progress curves (AUIPC), time to BPMV epidemic onset (5% incidence), time to 50% BPMV incidence, and doubling times were performed for each treatment, using PROC GLM with a Tukey test (P≤ 0.05; Statistical Analysis System 9.1; SAS Institute, Cary NC). Linear regression was used to quantify relationships between time of first detection within a soybean plot (DOY) and: (i) date of epidemic onset (i.e., when BPMV incidence = 5%), (ii) time to 50% BPMV incidence (T50), (iii) final BPMV incidence, and (iv) AUIPC
(30,31,43). Time to 50% incidence is often taken as a measure that best represents the entire pathogen population, as opposed to time estimates for initial incidences or final incidences (26,30,45). Time to 50% BPMV incidence (T50) was calculated based on
rearrange-ment of the logistic model T50 = 1/r[(logity2 – logity1)], where r is
the rate of BPMV spread within a soybean plot, y2 is the proportion
for BPMV incidence = 50%, (i.e., when y2 = 0.5), and y1 is the
proportion of BPMV incidence at time of first detection. Time to epidemic onset (5% BPMV incidence) was also calculated by sub-stituting 0.05 for y2.
In order to detect seasonal differences in BPMV epidemics, the effects of treatment–year interactions on time to epidemic onset (5% BPMV incidence), time to 50% BPMV incidence, rate of BPMV infection, final BPMV incidence, and bean leaf beetle population density data were analyzed using PROC GLM with the CONTRAST option.
Spatial analyses. To determine whether BPMV spatial patterns within soybean plots were random or aggregated over time, individual BPMV-positive quadrats within each soybean plot were mapped. The resulting spatial patterns were analyzed using
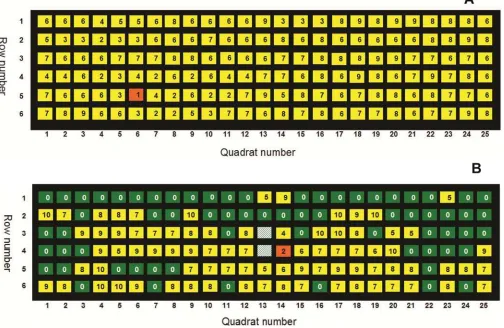
ordi-Fig. 1. Examples of spatial pattern maps depicting the positions of Bean pod mottle virus (BPMV)-infected soybean quadrats over time in A, a noninoculated plot in 2006 and
nary runs analysis (28,32,40), black-white join-count analysis (26), and spatial autocorrelation (9).
Ordinary runs. A “run” is defined as a sequence of like events
(28). In this case, a run is a consecutive sequence of healthy quad-rats or a consecutive sequence of BPMV-infected quadquad-rats. To test for aggregation either within rows or across rows, the number of observed runs was compared statistically to the number of runs that would be expected to occur by random chance for a given level of BPMV incidence (28,32,40). Under the null hypothesis, BPMV-infected quadrats occur in a random spatial pattern within soybean plots if the z-statistic (P = 0.05) is less than 1.64. Therefore, a spatial pattern with a z-statistic greater than 1.64 indicates the pres-ence of an aggregated spatial pattern (i.e., rejection of the null hypothesis for randomness, in favor of the alternative hypothesis for aggregation; 28).
Black-white join-count analysis. Black-white join-count analysis
is similar to ordinary runs analysis, except that this analysis tests for aggregated or random spatial patterns in two dimensions simul-taneously (both within and across the rows; 26). A quadrat was considered “white” if it was positive for BPMV and “black” if negative for BPMV. A black-white join was defined as the occur-rence of a positive quadrat that is neighbored by a BPMV-negative (healthy) quadrat (B-W) in the immediate four cardinal directions (rook case; 26). A macro written for MS Excel (38) was used to perform Monte-Carlo simulation of 1,000 permutations to determine the number of B-W (positive-negative) join-counts that would be expected to occur by random chance for a given level of BPMV incidence in each soybean plot on a given sampling date. Under the null hypothesis for spatial randomness, the number of expected B-W join-counts is ≥ the number of observed B-W join-counts. An advantage of this analysis over ordinary runs is that it can test for aggregation within and across plant rows with a single operation, whereas ordinary runs would require separate tests to evaluate aggregation both within and across rows.
Spatial autocorrelation analysis. Spatial autocorrelation analysis was performed to provide additional information concerning not only the direction, but also the distance of spatial autocorrelation (aggregation; 9,26). Spatial autocorrelation within and across soy-bean rows was tested using distance units known as lags. A lag is defined as a fixed distance from one marked point (i.e., a quadrat) to one quadrat distance away (i.e., one quadrat unit of distance = 1 lag, 2 quadrat units = 2 lags, and so on). Spatial autocorrelation analyses were performed using LCOR2 software (9). Results from spatial autocorrelation analyses were summarized by determining the proportion of soybean plots with aggregated spatial patterns for each sampling date.
Monitoring of bean leaf beetle population densities. Bean leaf beetle population densities were counted weekly in 16 randomly selected (for each sampling date) quadrats within each soybean plot. Total numbers of bean leaf beetles per plot were then plotted versus DOY. Treatment effects on bean leaf beetle population densities were tested using the GLM procedure with a Tukey test for means separation (SAS Institute). To test for the relationship
between bean leaf beetle population density and BPMV incidence, cumulative BPMV incidence for each treatment (averaged over replicates) was regressed against the cumulative number of bean leaf beetles (averaged over replicates) for each treatment.
Results
Temporal dynamics of BPMV epidemics. BPMV was first de-tected within a single nontreated control plot on DOY 150 (30 May) in 2006 (Fig. 1A). Detection of BPMV in this plot occurred 30 days before point sources of BPMV inoculum were established via mechanical inoculation. Although BPMV was first detected earlier in some plots than in others, the mean dates of first BPMV detection were not significantly different among treatments in 2006 (Table 1). In 2007, the first BPMV-infected quadrat was detected in a BPMV-point-source-treated plot (the first BPMV-positive quadrat beyond BPMV point sources) on the second sampling date (DOY 172, 21 June; Fig. 1B). In 2007, treatments did affect the mean date of first detection, because BPMV was first detected in quad-rats (beyond initial BPMV point sources) 29 to 37 days earlier (P ≤
0.05) in soybean plots with BPMV point sources compared with soybean treatments that did not include a BPMV point source (Ta-ble 1).
Initial BPMV incidence at the time of first detection did not dif-fer among treatments in either year (P > 0.05), with BPMV incidence within treatments ranging from 1.33 to 2.20% at the time of first detection in 2006 and from 0.67 to 3.67% in 2007 (Table 1). There was no statistical correlation between time of first detection and initial BPMV incidence in either year (r = 0.50, P = 0.10 for 2006 and r = 0.53, P = 0.09 for 2007).
The date of BPMV epidemic onset, defined as the DOY when BPMV incidence reached 5% (31,45), occurred as early as 29 June in 2006 (DOY 180) in the treatment that received two foliar insec-ticide applications, and as late as 18 July in 2007 (DOY 199) in the BPMV point source treatments (Table 1; Fig. 2). There were no significant differences among treatments (P = 0.401) for DOY of epidemic onset in 2006. However, date of epidemic onset was sig-nificantly affected by treatments in 2007 (P = 0.011), with epidemic onset occurring 30 to 36 days earlier in the two BPMV point source treatments than in treatments without BPMV point sources (Table 1).
Incidence of BPMV in soybean plots was relatively low (below 15%) in all treatments over the first four sampling dates in 2006, after which BPMV incidence increased exponentially (Fig. 2). Treatment means for end-of-season BPMV incidence levels ranged from 85.8 to 94.4% in 2006 (Fig. 2A). In 2007, BPMV incidence was less than 15% until the sixth sampling date (DOY 207), after which BPMV incidence began to increase exponentially. Final BPMV incidence did not exceed 37% in any of the four treatments in 2007 (Fig. 2B).
The logistic model best described the change in BPMV inci-dence over time for both years, with F statistics ranging from 97.8 to 263.7 (P < 0.0001), indicating that there was a strong linear relationship between logit BPMV incidence and time (DOY). Coefficients of determination (R2) were highest for the logistic
Table1. Treatment effects on the day of year (DOY) when Bean pod mottle virus(BPMV) was first detected, BPMV incidence at first detection, and DOY of epidemic onset in soybean cv. NE3001 planted at the Iowa State University Curtiss Research Farm, Ames, in 2006 and 2007v
First detected (DOY)w BPMV incidence (%)x Epidemic onset (DOY)y
Treatment 2006 2007 2006 2007 2006 2007
BPMV point source (PS) 177 a 172 b 1.33 a 0.67 a 193 a 200 b
Two foliar sprays (spray)z 163 a 216 a 1.78 a 3.67 a 180 a 229 ab
PS + spray 184 a 180 b 2.20 a 0.89 a 191 a 199 b
Nontreated control 170 a 209 a 2.00 a 1.78 a 181 a 235 a
v Time of first detection and BPMV incidence did not include two BPMV-inoculated quadrats (point sources), which were established in plots by mechanical
inoculation of the middle two quadrats in the center two soybean rows on 30 June 2006 and on 13 June 2007. Treatments followed by the same letter within the same column are not significantly different (P < 0.05) using PROC GLM with aTukey test for mean separations. Means were pooled across replicates.
w Date BPMV was first detected in treatments. x BPMV incidence at first detection.
y Date of epidemic onset, operationally defined as DOY when BPMV incidence = 5%. z Warriorinsecticide was applied at the V1 and at R2 soybean growth stages using a CO
model, with DOY explaining 96.5 to 98.3% (2006) and 92.5 to 97.6% (2007) of the variation in logit BPMV incidence (Fig. 2C and D). The logistic model also had lower standard errors of the estimates for y (SEEy), with SEEy values ranging from 0.005 to 0.012 logits in 2006 and from 0.004 to 0.014 logits in 2007 (Table 2). In comparison, SEEy values for the exponential model ranged from 0.004 to 0.097 ln units in 2006 and from 0.006 to 0.054 ln units in 2007; values for the Gompertz model ranged from 0.007 to 0.078
gompits in 2006 and 0.005 to 0.064 gompits in 2007. The higher SEEy values for the exponential and Gompertz models indicated that these models had lower precision for predicted values of transformed BPMV incidence (30). Inspection of residual plots also indicated that unexplained error terms (residuals) from the logistic model were more random when compared with the other models evaluated. Therefore, the logistic model was selected as the best model to obtain parameter estimates for the temporal rates of BPMV spread.
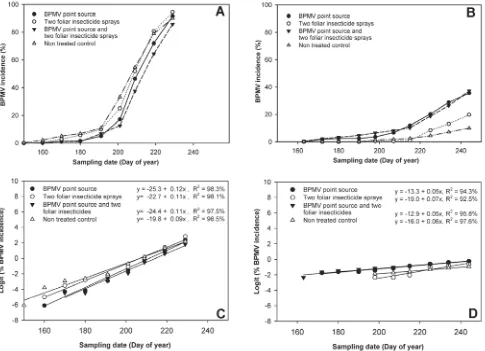
Fig. 2. Change over time in the mean incidence of Bean pod mottle virus (BPMV) in soybean quadrats (based on enzyme-linked immunosorbent assay) in A, 2006 and B,2007, and relationship between logit BPMV incidence and day of year (DOY) quadrats were sampled in C, 2006 and D,2007 in soybean cv. NE3001 planted at the Iowa State University Curtiss Research Farm, Ames. BPMV incidence for each data point is an average across replicates. In inoculated treatments, the two center quadrats (quadrat 13 in rows 3 and 4) were mechanically inoculated with BPMV. Foliar insecticide sprays (Warrior) were applied at the V1 and R2 soybean growth stages using a CO2-powered sprayer at 40 Pa.
Table 2. Logistic model parameters and statistics describing the temporal progress of Bean pod mottle virus (BPMV) epidemics within soybean cv. NE3001 plots planted at the Iowa State University Curtiss Research Farm, Ames, in 2006 and 2007
Logistic model parameters and statisticsx
Treatment Intercept Slope (logits/day) SEEy R2 DT (days)
2006
BPMV point source (PS)y –28.7 a 0.13 a 0.005 a 97.7 5.4 a
Two foliar sprays (spray)z –22.7 a 0.11 a 0.010 a 94.3 6.4 a
PS + spray –28.8 a 0.13 a 0.012 a 97.5 5.4 a
Nontreated control –20.0 a 0.12 a 0.009 a 96.5 5.9 a
2007
PS –13.3 a 0.05 a 0.005 a 94.3 14.1 a
Spray –19.0 a 0.07 a 0.004 a 92.5 10.0 a
PS + spray –12.9 a 0.05 a 0.014 a 95.8 14.1 a
Nontreated control –16.0 a 0.06 a 0.007 a 97.6 11.7 a
x Treatments followed by same letter within the same column and year are not significantly different (P < 0.05) using PROC GLM with a Tukey test for
mean separations. SEEy is the standard error of the estimate for y, R2 is the coefficient of determination, and doubling time (DT) is the time for BPMV
disease incidence to double (i.e., to increase from 1 to 2, 2 to 4, 4 to 8%, and so on.
y BPMV initial inoculum point sources were established by mechanical inoculation of the middle two quadrats of the center two soybean rows/plot on 30
June 2006 and on 13 June 2007.
z Warriorinsecticide was applied at the V1 and R2 growth stages using a CO
Rates of BPMV temporal spread within treatments, averaged over replicates, ranged from 0.11 to 0.13 logits/day in 2006 and from 0.05 to 0.07 logits/day in 2007 (Table 2). Although treatment effects on the rate of BPMV temporal spread over time (slopes) were not significantly different in either year (Table 2), BPMV spread was significantly faster in 2006 (orthogonal contrasts F value = 54.02, P < 0.0001) compared with 2007. Averaged over treatments, the temporal rate of BPMV spread within soybean plots in 2006 was 0.120 logits/day (95% confidence interval 0.109 to 0.134), and 0.06 logits/day (95% confidence interval 0.040 to 0.071) in 2007. Based upon these
temporal rates of BPMV spread in these two years, BPMV incidence was doubling every 5.4 to 6.4 days in 2006 and every 10.0 to 14.1 days in 2007.
In 2006, treatments did not affect the date when BPMV inci-dence reached 50% (P = 0.520), which ranged from DOY 207 (26 July) to DOY 215 (3 August) (Table 3). In 2007, BPMV incidence did not reach 50% in any of the four treatments prior to crop senes-cence (Table 3). The contrast in time to reach 50% BPMV inci-dence in 2006 versus predicted T50 for 2007, which occurred well
after crop senescence, has important implications with regards to BPMV disease management (31,45).
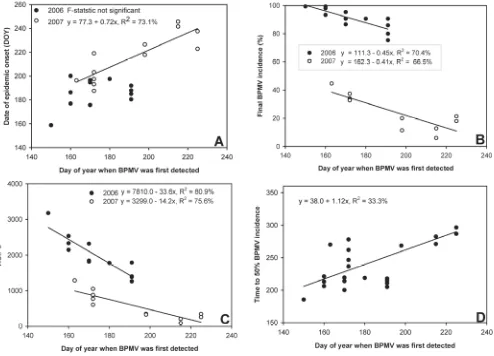
Fig. 3. Relationship between day of year (DOY) when Bean pod mottle virus (BPMV) was first detected in a soybean plot versus A, date of BPMV epidemic onset (defined as the DOY when BPMV incidence = 5%); B, final BPMV incidence; C, area under the BPMV incidence progress curve (AUIPC); and D, DOY when BPMV incidence reached 50% for soybean plots (cv. NE3001) planted at the Iowa State University Curtiss Research Farm, Ames, in 2006 and 2007. Each data point represents an individual soybean plot (four treatments x three replicates = 12 data points for each graph).
Table3. Effects of treatments on time to 50% Bean pod mottle virus (BPMV) incidence, final BPMVincidence, and area under the BPMV incidence progress curve (AUIPC) in soybean cv. NE3001 plots planted at the Iowa State University Curtiss Research Farm, Ames, in 2006 and 2007u
T50 (DOY)v Final incidence (%)w AUIPC
Treatment 2006 2007x 2006 2007 2006 2007
BPMV point source (PS)y 215 a 256 a 91.6 a 36.0 a 1,835 a 898 a
Two foliar sprays (spray)z 207 a 284 a 94.4 a 19.8 b 2,174 a 319 b
PS + spray 215 a 260 a 90.0 a 37.1 a 1,620 a 924 a
Nontreated control 206 a 306 a 85.8 a 10.0 b 2,292 a 208 b
u Treatments followed by the same letter within the same column are not significantly different (P< 0.05), using PROC GLM with a Tukey test for mean
separations.
v T
50 = day of year (DOY) when BPMV incidence = 50%, estimated using the logistic model (45).
w Final BPMV assessments were performed on 17 August 2006 (DOY 229) and 1 September 2007 (DOY 244). x In 2007, predicted time to 50% BPMV incidence occurred after crop senescence.
y BPMV initial inoculum point sources were established by mechanical inoculation of the middle two quadrats of the center two soybean rows/plot on 30
June 2006 and on 13 June 2007.
z Warriorinsecticide was applied at the V1 and R2 growth stages using a CO
There were no significant differences among treatments for end-of-season (final) BPMV incidence in 2006 (P = 0.618), because two foliar applications of Warrior insecticide did not significantly reduce final BPMV incidence (90.0 and 94.4%) compared with the two noninsecticide-treated plots (85.8 and 91.6%) (Table 3). The presence of BPMV inoculum point sources did not significantly influence final BPMV incidence in 2006 (Table 3). In 2007, how-ever, there were significant treatment differences in final BPMV incidence levels, because end-of-season incidence in soybean plots with BPMV point sources were two to three times higher than in noninoculated plots (P < 0.0001; Table 3). The incidence of BPMV-infected quadrats at the end of the 2006 growing season (85.8 to 94.4%) was significantly higher than end-of-season inci-dence in 2007 (10.0 to 37.1%; orthogonal contrasts F value = 291.15, P < 0.0001; Table 3; Fig. 2A and B).
There were no significant differences in AUIPC values among treatments in 2006 (P = 0.475). In 2007, however, BPMV point source treatments had significantly higher AUIPC values (AUIPC = 898 and 924, P = 0.003), compared with treatments without BPMV point sources (AUIPC = 208 and 319) (Table 3). Areas under BPMV incidence progress curves differed significantly be-tween years, with AUIPC values being significantly higher in 2006 (orthogonal contrasts F value = 45.38, P < 0.0001). This indicates that BPMV epidemics exerted greater disease stress on soybean in 2006 than in 2007 (Table 3).
A significant, positive, linear relationship between DOY when BPMV was first detected within soybean plots and DOY when BPMV incidence reached epidemic onset (R2= 58.2%, P = 0.009)
occurred in 2007 but not in 2006 (F statistic not significant; Fig.
3A). The DOY when BPMV was first detected in soybean plots and time to 50% BPMV incidence were not linearly related when years were analyzed separately, but a significant linear relationship (R2 = 33.3%) was evident when years were combined (i.e., the
earlier BPMV was first detected in a plot, the earlier BPMV incidence reached 50%; Fig. 3D). In both years, there was a significant linear relationship between DOY when BPMV was first detected and final BPMV incidence (R2 = 66.5%, slope = –0.45 in
2006; R2 = 70.4%, slope = –0.41 in 2007; Fig. 3B). Date of first
detection, therefore, explained 66.5 to 70.4% of the variation in final BPMV incidence in 2006 and 2007, respectively. Slope values indicate that, for each day BPMV first detection was delayed, final BPMV incidence declined by 0.45 and 0.41% in 2006 and 2007, respectively. Time of first detection was also linearly related to AUIPC (R2 = 80.9% in 2006 and 75.6% in 2007; Fig. 3C), with
slopes of –33.6 and –14.2, respectively. These slope values indicate that early BPMV first detection dates led to higher AUIPC values.
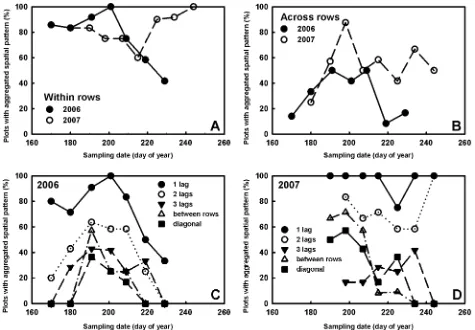
Spatial analyses of BPMV epidemics. Generally, the three methods of spatial analyses (ordinary runs analysis, black-white join-counts, and spatial autocorrelation) all indicated that BPMV epidemics were highly aggregated throughout the 2006 and 2007 soybean growing seasons (Figs. 4 and 5).
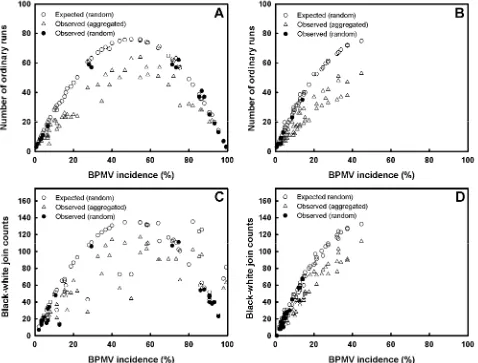
Ordinary runs analysis. The number of actual runs for all
treat-ments and replications within soybean rows was less than the ex-pected number of runs that would occur by random chance in 62 of 78 cases over time in 2006 and in 57 out of 77 cases over time in 2007 (Fig. 4A and B). This analysis indicated that the spatial pat-terns of BPMV-infected quadrats throughout both growing seasons were highly aggregated. The proportion of soybean plots with
aggregated spatial patterns within soybean rows in 2006 was high-est at DOY 201 (20 July) and ranged from 41 to 100%. In 2007, the proportion of soybean plots with aggregated spatial patterns ranged between 60 and 100% and was highest on the final assess-ment date (Fig. 5A). In general, random spatial patterns were de-tected only when BPMV incidence was very low (y < 3%) or very high (y > 90%). Soybean plots with aggregated spatial patterns across rows occurred primarily between DOY 170 (19 June 2006) and DOY 209 (28 July 2007) (the fifth and seventh sampling dates, respectively), which corresponded with the growth periods when soybean rows were beginning to close (Fig. 5B).
Black-white join-count analysis. Black-white join-count analysis
gave results similar to ordinary runs, with 58 of 78 cases (2006) and 56 of 77 cases (2007) having aggregated spatial patterns (Fig. 4C and D). In 2006, when BPMV incidence was greater than 10% but less than 90%, only 4 of 36 cases (11%) were classified as having nonaggregated (i.e., random) spatial patterns across and within soybean rows. In 2007, only 3 of 33 cases (9%) were classi-fied as nonaggregated when BPMV incidence was greater than 10% (Fig. 4D).
Spatial autocorrelation analysis. Spatial autocorrelation analysis indicated that there was significant spatial autocorrelation (aggre-gation) up to the third lag (a distance of three quadrats) within soybean rows (Fig. 5C and D). Spatial autocorrelation across soy-bean rows, however, was limited to just 1 lag (one row) in both years. Also, the proportion of plots with aggregated spatial patterns was highest for the first spatial lag within soybean rows in both years. This indicates that BPMV-infected quadrats were impacting the health status of neighboring quadrats up to the third quadrat within rows but only to a distance of one lag across soybean rows. In 2006, this analysis indicated that all plots had aggregated spatial patterns for one lag within a row on DOY 199 (18 July; Fig. 5C). In 2007, the proportion of plots with aggregated spatial patterns for
one lag within a row remained high throughout the growing season (Fig. 5D). The highest proportion of plots with significant spatial autocorrelation across rows occurred on DOY 191 (9 July) in 2006 and DOY 198 (17 July) in 2007, which was after the fifth sampling date and coincided with the period when soybean rows began to close.
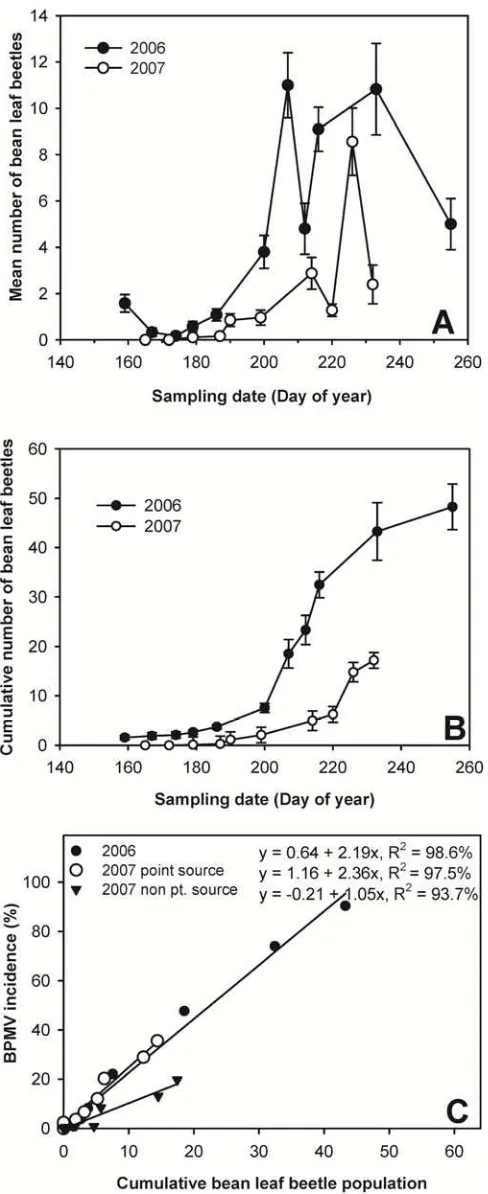
Bean leaf beetle monitoring. The mean number of bean leaf beetles (per 16 quadrats per plot) did not differ significantly among treatments in either year (Fig. 6A). However, the cumulative num-ber of bean leaf beetles (per 16 quadrats per plot) was significantly higher in 2006 than in 2007 (orthogonal contrasts F value = 36.63,
P = 0.040). In 2006, overwintering adult bean leaf beetles were present on the first sampling date (DOY 159, 8 June) at low population densities (approximately 1.6 beetles per 16 quadrats per plot), and then the adult overwintering generation declined to near zero on DOY 174 (23 June). The first summer bean leaf beetle generation began to emerge on the fourth assessment date (DOY 179, 28 June) and reached peak population density (11.0 bean leaf beetles per 16 quadrats per plot) on DOY 207 (26 July). The sec-ond summer bean leaf beetle generation peaked on DOY 233 (21 August), with 10.8 beetles per 16 quadrats per plot. In contrast, the 2007 overwintering bean leaf beetle population was not detected in our soybean plots, and the first summer bean leaf beetle generation was not detected until the fourth assessment date (DOY 179, 28 June). This generation peaked on DOY 214 (2 August), with 2.8 bean leaf beetles per 16 quadrats per plot. The second summer generation of bean leaf beetles peaked on DOY 226 (14 August), with 8.6 bean leaf beetles per 16 quadrats per plot (Fig. 6B).
In either year, insecticide applications did not significantly re-duce the number of bean leaf beetles within soybean plots. Due to the lack of significant treatment effects, numbers of bean leaf bee-tles (per 16 quadrats per plot) were pooled across all replications and treatments within each growing season. A graph of the cumula-
Fig. 5. Percentage of soybean plots (cv. NE3001) planted at the Iowa State University Curtiss Research Farm, Ames, with aggregated spatial patterns of Bean pod mottle
virus, detected using ordinary runs analysis A, within soybean rows and B, across soybean rows. The percentage of soybean plots in C, 2006 and D,2007 exhibiting
tive mean number of bean leaf beetles (per 16 quadrats per plot) versus DOY revealed that bean leaf beetle populations were much lower during the 2007 growing season than during 2006 (Fig. 6 B). Emergence of the first summer generation of bean leaf beetles began approximately 10 days later in 2007 compared with 2006. Cumulative bean leaf beetle populations increased exponentially after DOY 186 in 2006 and DOY 199 in 2007. This coincided with the beginning of the emergence of the first summer bean leaf beetle generation, which was delayed approximately 10 days in 2007 (Fig. 6A).
Bean leaf beetle population densities and BPMV incidence did not differ among treatments in 2006; therefore, bean leaf beetle population and BPMV incidence data were pooled across treat-ments and replications over time. In 2007, however, BPMV inci-dence differed among treatments with and without BPMV point sources (Table 3). Therefore, the relationship between BPMV inci-dence and bean leaf beetle population density was analyzed sepa-rately for BPMV point source and non-BPMV point source treat-ments. Cumulative bean leaf beetle populations within soybean plots were linearly related to BPMV incidence in both 2006 and 2007 (P < 0.0001; Fig. 6C). In 2006, BPMV incidence increased 2.19% for each one unit increase in cumulative bean leaf beetle population. In 2007, for treatments with BPMV inoculum point sources, BPMV incidence increased 2.36% for each unit increase in cumulative bean leaf beetle population density, compared with a 1.05% per unit increase for treatments without BPMV point sources. Thus, in both years, as cumulative bean leaf beetle popula-tion density increased, BPMV incidence increased (Fig. 6C).
Discussion
This study provides the first comprehensive, quantitative analy-sis concerning the temporal and spatial dynamics of BPMV epi-demics over the course of two full soybean growing seasons. We found that the temporal spread of BPMV in all soybean plots was best described by the logistic model. This population growth model has been reported to best explain the rate of pathogen spread for many other plant virus pathosystems in which there is plant-to-plant (or in this case, quadrat-to-quadrat) spread (26,30,45). The temporal progress of BPMV during the two soybean growing sea-sons followed similar trends, in that BPMV epidemics were driven (i) by the time when BPMV was first detected within soybean plots (i.e., when initial inoculum was first present) and (ii) by the sea-sonal population densities of the primary vector for BPMV, the bean leaf beetle (C. trifurcata).
This is the first report to quantify the potential doubling times for BPMV epidemics. The translation of logistic temporal rates into doubling times offers a more intuitive way to express disease risk to disease managers and growers (31,45). The two soybean growing seasons in our study likely represent two different scenarios: a high-risk scenario (doubling times from 5.4 to 6.4 days in 2006) and a moderate risk scenario (doubling times ranging from 10.0 to 14.1 days in 2007). The lowest BPMV risk would occur if bean leaf beetle populations remain at or near zero. This scenario actually occurred in a follow-up study in 2008. In that study, there was no spread of BPMV over time or space beyond the initial inoculated point sources (i.e., doubling times were indefinite) (data not shown).
An important finding in this study was that the date when BPMV was first detected within soybean field plots had a good predictive relationship with subsequent measures of epidemic development, such as time to epidemic onset, time to 50% BPMV incidence, final (end-of-season) BPMV incidence, and AUIPC. We also observed that plots with the earliest BPMV detection dates had higher final BPMV incidence levels and higher AUIPC values. Thus, the BPMV pathosystem appears to follow classic van der Plank theory, in that management tactics that reduce initial inci-dence will become more effective in delaying (BPMV) epidemics as the temporal rate (of BPMV) is reduced (31,45). This was evi-denced in our study by the higher rates of BPMV temporal spread in 2006, which were approximately twice as fast as the logistic rates for 2007. For example, attempts to add initial inoculum (treat-ments with BPMV inoculum point sources) or subtract (reduce)
initial inoculum (via the application of foliar insecticide at growth stage V2) had no significant impact on end-of-season (final) BPMV incidence, or AUIPC, in 2006. In 2007, however, the addi-tion of initial inoculum (treatments with BPMV point sources) resulted in a shift in BPMV disease progress curves to the left. Thus, BPMV point source treatments reached a given level of dis-ease incidence approximately 30 to 36 days earlier than treatments without point sources in 2007. This indicates that, in 2007, logistic growth was limited by initial inoculum (in the form of BPMV-infested bean leaf beetles). Moreover, the slower logistic rates in 2007 increased the number of days required to reach a given level of BPMV incidence (e.g., T50). In 2007, for example, there was a
36- to 44-day delay in epidemic onset (5% BPMV incidence) in plots without BPMV point sources compared with plots with initial inoculum point sources. This finding strongly points to the effec-tiveness of reducing local (within-field) sources of initial inoculum to delay BPMV epidemic development, if logistic growth can also be effectively reduced. Management tactics that effectively target and reduce BPMV initial inoculum include insecticide seed treatments, seed lot testing to exclude lots with BPMV-infected seed, production of certified soybean seed in areas predicted to have zero-to-low BPMV disease risk, and delayed planting (17,19,21,22,30,31,39).
Our study revealed that quadrat-to-quadrat spread of BPMV early to midseason originated from BPMV-infected quadrats within soybean plots and not from BPMV-infected seed. This is evidenced by the highly aggregated (not random) and more extensive spread of BPMV within soybean rows (significant aggregation up to three spatial lags). Moreover, soybean plots with BPMV inoculum point sources tended to have other BPMV-positive quadrats located in close proximity to the initial point sources. Thus, soybean quadrats in close proximity to BPMV-positive quadrats had a higher prob-ability of being infected with BPMV than did quadrats that were located beyond three spatial lags within soybean rows or one spa-tial lag across rows. We conclude that individual quadrats within each soybean plot did not have equal (random) chances of becom-ing infected with BPMV. Gibson and Austin (6) referred to this as “local transmission”, where the infection of one plant leads to infection of neighboring plants.
In 2007, soybean plots without BPMV point sources remained (BPMV) disease free 36 to 40 days longer than plots with BPMV point sources. The concept of a “disease-free period” has important implications with regards to yield loss and disease management (45). This is because, for many pathosystems, there is a strong relationship between time of infection and yield loss (i.e., the ear-lier plant infection occurs, the greater the yield loss; 37).
The aggregated nature of BPMV-infected quadrats suggests that a systematic sampling design should be employed to estimate BPMV prevalence or incidence within and among soybean fields (27,31). To further reduce sampling bias and to improve BPMV detection, researchers should use a systematic sampling design that employs as many sampling arms (transects) as resources will allow (26,30,32,40). Using a similar quadrat-based experimental design, Nutter et al. (32) found that, in contrast to BPMV, the spatial dy-namics of SMV epidemics were mostly random over time, indicat-ing that a random samplindicat-ing design could be employed to estimate SMV prevalence and incidence in soybean. However, for special cases, such as surveys or experiments that require assessments for both BPMV (aggregated) and SMV (random) incidence (e.g., the Legume Pest Information Platform for Extension and Education program), we recommend using a systematic sampling design for both viruses. Based on the seasonal periodicities of BPMV epi-demics, soybean fields should be sampled between the V2 and R3 growth stages to quantify temporal and spatial spread.
Our study suggests that the population density of bean leaf bee-tles during the growing season is an important risk factor that drives whether BPMV risk will be low, moderate, or high. This is evidenced by the fact that, in all treatments, the fastest rate of change in BPMV incidence strongly coincided with periods of high bean leaf beetle population densities in soybean. Moreover,
the exponential upturn in the temporal rate of BPMV spread coin-cided with the emergence of the first summer generation of bean leaf beetles. Two facts—(i) only 1 of 3,600 quadrats tested positive for BPMV prior to the establishment of BPMV inoculum sources (1,800 quadrats were sampled each year during the first sampling date) and (ii) BPMV-infected quadrats were highly aggregated throughout both soybean growing seasons—constitute strong evi-dence that bean leaf beetle population density is an important driver of BPMV epidemics. Moreover, the rare event (1 in 3,600) in which soybean quadrats tested positive for BPMV on the first sampling date indicated that, in our study, BPMV-infected seed played little or no role in BPMV disease risk (relative to the role of overwintering BPMV-infested bean leaf beetles). The significant linear relationship between DOY when BPMV was first detected in soybean plots and DOY when epidemic onset occurred further supports the critical role that the overwintering generation of viruliferous bean leaf beetles plays in facilitating the within-field spread of BPMV early in the growing season.
The aggregated patterns of BPMV-positive quadrats may be at-tributed, in part, to the limited movement of bean leaf beetles within soybean fields, which has been reported to be restricted (primarily) to crawling or short, trivial flights (2,20). Boiteau et al. (2) reported flight distances of bean leaf beetles to be less than 30 m. In another study, Krell et al. (20), using a computer-tethered flight mill, determined potential flight distances to be less than 51 m. Trivial flights by the Colorado potato beetle (Leptinotarsa
de-cemlineata (Say) (Coleoptera, Chrysomelidae) have been reported
to be less than 10 m (44). Generally, dispersal gradients of
Chry-somelidae beetles within crops are quite steep, unless beetles are
migrating to or from overwintering sites (42,44). Thus, the aggre-gated distribution of BPMV in soybean is consistent with beetle behavior. Similar spatial patterns have been reported for the Citrus
tristeza virus–aphid vector pathosystem, where within-row
trans-mission was attributed largely to the dispersal behavior of the pre-dominant vector Toxoptera citricida (brown citrus aphid) that colo-nizes citrus (8).
The economic injury threshold currently recommended to pre-vent yield losses caused by the direct feeding of bean leaf beetles does not consider the risk for additional losses that might occur from the dissemination of BPMV by bean leaf beetles (35). Whereas yield losses caused by direct feeding of bean leaf beetles have been reported to be as high as 50% (35), loss due to BPMV alone has been reported to be as high as 60% (14,19). Thus, there is a need to develop new economic thresholds that incorporate the added risk for yield losses caused by BPMV epidemics.
In our study, two foliar insecticide applications had no signifi-cant effect on reducing BPMV incidence in either year. These re-sults support previous studies, which found that benefits derived from the application of foliar insecticides to reduce BPMV inci-dence were inconsistent. For example, Krell et al. (18) reported that the application of foliar insecticides successfully reduced BPMV incidence in just 1 of 2 years of testing, and recent studies by Bradshaw et al. (3) found that applications of foliar insecticides had little or no impact on reducing BPMV incidence. This was in spite of the fact that foliar insecticides significantly reduced bean leaf beetle population densities. Thus, additional research is needed to develop economic injury thresholds that account for the risk of potential yield losses from both the insect vector and the virus. Additional research is also needed to develop reliable action thresholds to better time the deployment of foliar insecticides.
This study has provided new, quantitative information concern-ing the temporal and spatial dynamics of BPMV epidemics in soy-bean. Such information provides the methods and sampling de-signs needed to quantify and compare the impact of climate, new management tactics, and wholly integrated BPMV management programs on reducing BPMV disease risk (30,45).
Acknowledgments
Pro-gram, and the Iowa State University Institute for Food Safety and Security. We thank graduate students L. Liu and X. Lu and undergraduate summer interns for their assistance in sampling and testing soybean samples during the course of this study.
Literature Cited
1. Abney, T. S., and Plopper, L. D. 1994. Effects of Bean pod mottle virus on soybean seed maturation and seedborne Phomopsis spp. Plant Dis. 78:33-37. 2. Boiteau, G., Bradley, J. R., and van Duyn, J. W. 1980. Bean leaf beetle:
temporal and macro-spatial distribution in North Carolina. J. Ga. Entomol. Soc. 15:151-163.
3. Bradshaw, D. J., Rice, M., and Hill, J. H. 2008. Evaluation of management strategies for bean leaf beetles (Coleoptera: Chrysomelidae) and Bean pod mottle virus (Comoviridae) in soybean. J. Econ. Entomol. 101:1211-1227. 4. Dorrance, A. E., Schmitthenner, A. F., and Grau, C. R. 2001. First report of
Bean pod mottle virus in soybean in Ohio. Plant Dis. 85:1029.
5. Ghabrial, S. A., Hershman, D. E., Johnson, D. W., and Yan, D. 1990. Distri-bution of Bean pod mottle virus in soybeans in Kentucky. Plant Dis. 74:132-134.
6. Gibson, G. J., and Austin, E. J. 1996. Fitting and testing spatiotemporal stochastic models with applications in plant pathology. Plant Pathol. 45:172-184.
7. Giesler, L. J., Ghabrial, S. A., Hunt, T. E., and Hill, J. H. 2002. Bean pod mottle virus: a threat to U. S. soybean production. Plant Dis. 86:1280-1289. 8. Gottwald, T. R., Gibson, G. J., Garnsey, S. M., and Irey, M. 1999. Examina-tion of the effect of aphid vector populaExamina-tion composiExamina-tion on the spatial dy-namics of Citrus tristeza virus spread by stochastic modeling. Phytopathol-ogy 89:603-608.
9. Gottwald, T. R., Richie, S. M., and Campbell, C. L. 1992. LCOR2-Spatial correlation analysis software for the personal computer. Plant Dis. 76:213-215.
10. Hill, J. H. 2001. Virus-induced soybean seed problems. Pages 179-180 in: Integrated Crop Management. Iowa State University Extension, Ames. 11. Hill, J. H., Koval, N. C., Gaska, J. M., and Grau, C. R. 2007. Identification
of field tolerance to Bean pod mottle and Soybean mosaic viruses in soy-bean. Crop Sci. 47:212.
12. Hobbs, H. A., Hartman, G. L., Wang, Y., Hill, C. B., Bernard, R. L., Peder-sen, W. L., and Domier, L. L. 2003. Occurrence of seed coat mottling in soybean plants inoculated with Bean pod mottle virus and Soybean mosaic virus. Plant Dis. 87:1333-1336.
13. Hopkins, J. D., and Mueller, A. J. 1983. Distribution of Bean pod mottle virus in Arkansas soybean as related to the bean leaf beetle, Cerotoma trifurcata, (Coleoptera: Chrysomelidae) population. Environ. Entomol. 12:1564-1567.
14. Hopkins, J. M., and Mueller, A. J. 1984. Effect of Bean pod mottle virus on soybean yield. J. Econ. Entomol. 77:943-947.
15. Jeffords, M. R., Helm, C. G., and Kogan, M. 1983. Overwintering behavior and spring colonization of soybean by the bean leaf beetle (Coleoptera: Chrysomelidae) in Illinois. Environ. Entomol. 12:1459-1463.
16. Kogan, M., Ruesink, W. G., and McDowell, K. 1974. Spatial and temporal distribution pattern of bean leaf beetle, Cerotoma trifurcata (Forster) on soybeans in Illinois. Environ. Entomol. 2:607-617.
17. Krell, R. K., Pedigo, L. P., Hill, J. H., and Rice, M. E. 2003. Potential pri-mary inoculum sources of Bean pod mottle virus in Iowa. Plant Dis. 87:1416-1422.
18. Krell, R. K., Pedigo, L. P., Hill, J. H., and Rice, M. E. 2004. Bean leaf beetle (Coleoptera: Chrysomelidae): management for reduction of Bean pod mottle virus. J. Econ. Entomol. 97:192-202.
19. Krell, R. K., Pedigo, L. P., Rice, M. E., Westgate, M. E., and Hill, J. H. 2005. Using planting date to manage Bean pod mottle virus in soybean. Crop Prot. 24:909-914.
20. Krell, R. K., Wilson, T. A., Pedigo, L. P., and Rice, M. E. 2003. Charac-terization of bean leaf beetle (Coleoptera: Chrysomelidae) flight capacity. J. Kans. Entomol. Soc. 76:406-416.
21. Lam, W. K. F., and Pedigo, L. P. 2000. A predictive model for the survival of overwintering bean leaf beetles (Coleoptera: Chrysomelidae). Environ. Entomol. 29:800-806.
22. Lam, W. K. F., Pedigo, L. P., and Hinz, P. N. 2001. Population dynamics of bean leaf beetles (Coleoptera: Chrysomelidae) in central Iowa. Environ.
Entomol. 30:562-567.
23. Levinson, G. A., Waldbauer, G. P., and Kogan, M. 1979. Distribution of bean leaf beetle eggs, larvae, and pupae in relation to soybean plants: determination by emergence cages and soil sampling techniques. Environ. Entomol. 8:1055-1058.
24. Lin, M. T., and Hill, J. H. 1982. Bean pod mottle virus: occurrence in Ne-braska and seed transmission in soybeans. Plant Dis. 67:230-232. 25. Mabry, T. R., Hobbs, H. A., Steinlage, T. A., Johnson, B. B., Pedersen, W.
L., Spencer, J. L., Levine, E., Isard, S. A., Domier, L. L., and Hartman, G. L. 2003. Distribution of leaf-feeding beetles and Bean pod mottle virus (BPMV) in Illinois and transmission of BPMV in soybean. Plant Dis. 87:1221-1225.
26. Madden, L. V., Hughes, G., and Bosch, F. V. D. 2006. The Study of Plant Disease Epidemics. American Phytopathological Society, St. Paul, MN. 27. Madden, L. V., Hughes, G., and Irwin, M. E. 2000. Coupling
disease-pro-gress-curve and time-of-infection functions for predicting yield loss of crops. Phytopathology 90:788-800.
28. Madden, L. V., Louie, R., Abt, J. J., and Knobe, J. K. 1982. Evaluation of tests for randomness of infected plants. Phytopathology 72:195-198. 29. Moore, B. J., Scott, H. A., and Walters, H. J. 1969. Desmodium
panicula-tum, a perennial host of Bean pod mottle virus in nature. Plant Dis. Rep. 62:1069-1073
30. Nutter, F. W., Jr. 1997. Quantifying the temporal dynamics of plant virus epidemics: a review. Crop Prot. 16:603-618.
31. Nutter, F. W., Jr. 2007. The role of plant disease epidemiology in developing successful integrated disease management programs. Pages 43-77 in: Gen-eral Concepts in Integrated Pest and Disease Management. A. Ciancio and K. G. Mukerji, eds. Springer, Dordrecht, The Netherlands.
32. Nutter F. W., Jr., Schultz, P. M., and Hill, J. H. 1998. Quantification of within-field spread of Soybean mosaic virus in soybean using strain-specific monoclonal antibodies. Phytopathology 88:895-901.
33. Quiniones, S. S., and Dunleavy, J. M. 1971. Filiform enations in virus-infected soybeans. Phytopathology 61:763-766.
34. Redinbaugh, M. G., Molineros, J. E., Vacha, J., Berry, S. A., Hammond, R. B., Madden, L. V., and Dorrance, A. E. 2010. Bean pod mottle virus spread in insect-feeding-resistant soybean. Plant Dis. 94:265-270.
35. Rice, M. 2000. Bean leaf beetle thresholds. In: Integrated Crop Manage-ment Newsletter IC-484 (19) 143. Iowa State University, Ames.
36. Ross, J. P. 1969. Effect of time and sequence of inoculation of soybeans with Soybean mosaic and Bean pod mottle viruses on yields and seed characters. Phytopathology 59:1404-1408.
37. Savary, S., Teng, P. S., Willocquet, L., and Nutter, F. W., Jr. 2006. Quantifi-cation and modeling of crop losses: a review of purposes. Annu. Rev. Phytopathol. 44:89-112.
38. Sawada, M. 1999. Rookcase: an Excel 97/2000 visual basic (VB) add-in for exploring global and local spatial autocorrelation. Bull. Ecol. Soc. Am. 80:231-234.
39. Steadman J., Robertson A., Byamukama E., and Nutter, F. W., Jr. 2007. Relationship between percent mortality predictions for bean leaf beetle overwintering populations and incidence of Bean pod mottle virus. (Abstr.) Phytopathology 97:S110.
40. Steinlage, T. A., Hill, J. H., and Nutter, F. W., Jr. 2002. Temporal and spatial spread of Soybean mosaic virus (SMV) in soybeans transformed with the coat protein gene of SMV. Phytopathology 92:478-486.
41. Stuckey, R. E., Ghabrial, S. A., and Reicosky, D. A. 1982. Increased inci-dence of Phomopsis spp. in seeds from soybean infected with Bean pod mottle virus. Plant Dis. 66:826-829.
42. Turchin, P. B. 1986. Modeling the effect of host patch size on Mexican bean beetle emigration. Ecology 67:124-132.
43. Wang, R. Y., Gergerich, R. C., and Kim, K. S. 1992. Non-circulative trans-mission of plant viruses by leaf-feeding beetles. Phytopathology 82:946-950.
44. Weber, D. C., Ferro, D. N., and Stoffolano, J. G. 1993. Quantifying flight of Colorado potato beetles (Coleoptera: Chrysomelidae) with a microcom-puter-based flight mill system. Ann. Entomol. Soc. Am. 86:366-371. 45. Zadoks, J. C, and R.D. Schein, R. D. 1979. Epidemiology and Plant Disease
Management. Oxford University Press, New York.