Complex Hexasaccharide
ARTICLE in BIOPOLYMERS · JANUARY 2011
Impact Factor: 2.39 · DOI: 10.1002/bip.21532 · Source: PubMed
Measuring the Magnitude of Internal Motion in a Complex
Hexasaccharide
Soumya Ganguly#, Junchao Xia$, Claudio Margulis$, Liz Stanwyck& and C. Allen Bush.*
Department of Chemistry and Biochemistry and Department of Mathematics and Statistics, University of Maryland Baltimore County Baltimore, MD 21250 and Department of Chemistry, University of Iowa, Iowa City, IA 52246
*To whom to address correspondence. Dept of Chemistry and Biochemistry, UMBC, e-mail: [email protected]
# Department of Chemistry and Biochemistry, UMBC. Present address:
Vanderbilt University Centre for Structural Biology, 465 25th Avenue South., Nashville TN 37232
Abstract
For the development of a scheme for quantitative experimental estimation of internal
motion in the complex human milk hexasaccharide Lacto-N-di-fuco hexose I (LNDFH I),
we measured a large number of experimental residual dipolar couplings in liquid crystal
orienting media. We present a total of 40 13C – 1H and 1H – 1H dipolar coupling values,
each representing distinct directions of internuclear vectors. The NMR data were
interpreted with established methods for analysis of rigid sub domains of the
oligosaccharide as well as a novel method in which dipolar couplings were calculated
over an ensemble of conformers from a solvent MD trajectory using multiple linear
regression analysis. The conformation of the Lewisb epitope region of LNDFH I assumed
a single unique conformation with internal motion described by fluctuations of 5 to 10
degrees in glycosidic dihedral angles consistent with previous studies. Greater flexibility
was observed for the remaining GlcNAc1 3-β-D-Gal and β-D-Gal1 4Glc linkages,
with the former glycosidic linkage existing in a conformational exchange among three
states. The results were also supported by similar results of calculations carried out with
Introduction
Defining the conformation and dynamics of macromolecules is one of the most
interesting and challenging areas of structural studies. Among the different
macromolecules, conformational details of oligosaccharides have been the most elusive
due to the numerous linkage options and substitutions with sugars having varied
functionality including amides, phosphates, carboxylates and deoxy sugars 1. For the past
three decades oligosaccharide conformation has been studied to gain insights into their
structural characteristics 2. While many of these sugars exhibit conformational flexibility,
it is not uncommon to find relatively rigid oligosaccharides such as the blood group
determinants. The motion of these oligosaccharides, when present in a physiological
system have a major influence on various cellular recognitions mediated by both proteins
and other carbohydrates. Experimental designs to determine these motions are difficult
because of nano-second to millisecond level motions of these oligosaccharides 3,4.
Development of experimental methods to study motional characteristics in
complex oligosaccharides has been particularly difficult. Some of these sugars can
exhibit multiple degrees of motion including various levels of conformational freedom at
different linkages 5. Molecular modeling simulation alone is insufficient to characterize
these motions since accurate representation of the sugars requires large solvent boxes and
time scales at the millisecond region which are difficult to simulate. Parameterization of
force fields also requires further refinement to accurately simulate the wide variety of
to study carbohydrates, but the dependence of NMR observables like Nuclear Overhauser
Effect (NOE) on both molecular tumbling and internal motion complicates quantitative
interpretation. Averaged values of scalar coupling can be more directly interpreted as
averaged values of glycosidic dihedral angles but long-range 13C – 1H coupling values
necessary for conformation studies are difficult to measure accurately in the absence of
isotope enrichment.
Recently Prestegard et al 6 used residual dipolar coupling (RDC) and generalized
degree of order (GDO) to explain rigid and flexible regions present in a trisaccharide. As
a scalar parameter, GDO can predict flexibility between two rigid fragments but does not
explicitly reflect the amplitude of internal motion 6. In the presence of internal motion,
experimental parameters like RDC are averaged over all possible conformers and
quantification of such motion is possible by identifying those conformers.
Conformational averaging of RDC has recently been studied in sucrose and was found in
a dynamic average of multiple conformers 7. For branched and complex sugars consisting
of four or more residues, similar studies have been very limited due to the lack of
sufficient experimental data and a suitable methodology.
Here we propose a scheme to study domain motion in the complex
oligosaccharide. Lacto-N-difucohexose I (LNDFH I) (Figure 1) and its internal motion is
discussed in detail. Residual dipolar coupling was used as the experimental observable.
For each sugar residue more than five independent RDC vectors were extracted to
calculate the orientation tensors by fitting the experimental data. Molecular simulations
were used to generate sets of co-ordinates for the hexasaccharide which were later used to
the Lewisb tetrasaccharide epitope conformation was first separately studied using
Powellten 8 and REDCAT (REsidual Dipolar Coupling Analysis Tool) 9. The linkages d
– e and e – f which lie outside the Lewisb tetrasaccharide epitope were studied by
considering a shape induced alignment model of the entire hexasaccharide. TRAMITE
(TRAcking Moment of Inertia TEnsor) 10 was used to calculate dipolar couplings for
selected models of the hexasaccharide and multiple linear regression was used as the
statistical method to determine which conformers best represent the average RDC data.
Methods
Sample Preparation
The human milk oligosaccharide, Lacto-N-difucohexose I (LNDFH I) was purchased
from V-Labs, Inc (Covington, LA) and was used without further purification. A sample
of 10 mg of the oligosaccharide was exchanged in 99.9% D2O and lyophilized for three
cycles. The final product was dissolved in 0.7 ml of 99.96% D2O and used as an isotropic
sample to determine scalar coupling.
A partially oriented sample of LNDFH I prepared using n-Octyl pentaethylene
glycol (C8E5) (Sigma-Aldrich) served as a neutral liquid crystalline medium 11. The
sample was prepared by dissolving 10 mg of lyophilized LNDFH I in 0.6 ml of 99.96%
D2O and 35.5 l of C8E5 so that the final concentration of the liquid crystal in the solution
is 5%. Finally 18.07 l of n-octanol was added to the solution to achieve a molar ratio of
0.87 for C8E5/n-octanol. Vigorous mixing resulted in an opalescent bluish, semi viscous
and homogeneous solution indicating formation of the liquid crystal.
All NMR experiments for measuring scalar and residual dipolar couplings were carried
out on a 500 MHz Bruker Avance DRX spectrometer equipped with a cryoprobe at a
temperature of 292 K. The experimental data were processed using NMRPipe/NMRDraw
12 and analyzed using NMRview 13 software on a Linux workstation.
2H residual quadrupolar splitting of D
2O was used to check the homogeneity and
concentration of the anisotropic sample. Homogeneous solution of 5% C8E5 resulted in a
40 Hz splitting at 292 K.
One bond C-H heteronuclear couplings were measured from indirectly coupled
gradient HSQC spectra (t1-coupled gHSQC) 14. Two sets of t1-folded experiments were
acquired with carriers positioned around the center of the anomeric region (90 ppm) and
the ring region (70 ppm) with the spectral width of the indirect dimension reduced to 5
KHz to increase the digital resolution of the spectra. The direct sweep width was
maintained at 2.5 KHz. The INEPT delays corresponding to the nominal value of 1JCH
were set to 160 Hz. Carbon decoupling during acquisition was carried out with the
WALTZ-16 pulse sequence with field strength of 1612.9 Hz.
Long range H-H coupling values of LNDFH I were measured using 13C resolved
HH-TOCSY 15 experiment with MLEV – 17 spinlock for the TOCSY transfer.
HH-TOCSY experiments were carried out at different mixing times ranging from 15 ms to
105 ms with an increment of 5 ms mixing time for each experiment. A change in mixing
times clearly resolves particular cross-peaks compared to others. No changes in coupling
constants were observed between different mixing periods. The down field anomeric
cross peaks were clearly resolved at higher mixing times (70 ms to 105 ms) while lower
resolved HH-TOCSY experiments were carried out with a spectral width of 2.5 KHz in
the direct dimension. The carbon carrier was positioned at 60 ppm with a spectral width
of 12575 Hz. The inept delay corresponding to nominal value of 1JCH was set to 160 Hz.
WALTZ -16 pulse sequence was used for carbon decoupling with field strength of 1612.9
Hz.
Alignment Tensors and Residual Dipolar Coupling Calculation
Three different methods were evaluated to interpret the experimental RDC data from a
collection of conformers generated using the two different simulation methods Molecular
Dynamics (MD) and Monte Carlo (MC). Residual dipolar coupling was calculated using
the general expression 16,17 given by:
(
)
where Dmax is the maximum dipolar coupling value possible between the nucleus X and
Y at a reference internuclear distance of 1 Å and θ defines the angle between the
internuclear vector and the magnetic field. The brackets < > denote the averaging of the
angular information with time.
Method I
In this method, the Powellten algorithm 18 was used to calculate the orientation tensors
from the Cartesian coordinates of the molecular models. This method assumes a rigid
conformation of the molecule under consideration and can be applied to any sub-domain
of a polymer that is rigid. We used this technique to calculate the orientation tensor of the
Lewisb tetrasaccharide epitope of LNDFH I, which is considered to be fairly rigid. For
Cartesian coordinates. A Powell optimization algorithm 19 was used to fit the orientation
tensors to the observed data by minimizing a merit function χ, measuring the goodness of
fit defined in equation (2):
was used to simulate the experimental error. Powellten was advantageous in iteratively
calculating the orientation tensor of a large number of models and then ranking them on
the basis of their fit to the observed data. The resulting data were used to plot a colored
contour map where the rank (χ) for each model was plotted against glycosidic torsion
angles.
Method II
To calculate the residual dipolar coupling from a collection of molecular conformers, the
order matrix based approach REDCAT (REsidual Dipolar Coupling Analysis Tool) 9 was
implemented. Like Powellten, REDCAT assumes a rigid molecular conformation of the
fragment with small degrees of internal motions. Therefore, the order matrix calculation
was used to derive the RDCs of the Lewisb tetrasaccharide epitope of LNDFH I similar to
that of method I. With the knowledge of the molecular geometry and five or more distinct
dipolar coupling data, the Saupe order matrix was diagonalized 20 yielding the principal
order parameter (Szz), an asymmetry parameter (η) and the three Euler angles relating the
molecular fragment from the arbitrary molecular co-ordinate to the principal co-ordinate
One of the important features of REDCAT is that it can account for the
experimental error of the calculated dipolar coupling data by adding uncertainties to
generate several sets of dipolar coupling data by uniformly sampling using a Monte Carlo
simulation. Order tensors were calculated based on 10,000 cycles of Monte Carlo
simulation with RDC values randomly varied over a range of 1-1.5 Hz as described in ref
9. From a collection of 3000 – 4000 order parameters, the best solution was selected
based on the least mean square deviation from the experimental data. The order
parameters were also used to back calculate the RDC for each of the conformers.
Internal motions of complex macromolecules of oligosaccharides have also been
interpreted using the generalized degree of order (GDO) ν 21. As a scalar parameter, GDO
values can characterize the degree of internal motion independent of the order frame and
anisotropy of the molecule. Two rigid fragments with no internal motion should exhibit
identical GDO values given by:
where Sij are the elements of Saupe order matrix.
Method III
The methods I and II discussed above are not suitable to describe the conformation of
flexible molecules. The shape of a single contributing conformer in an ensemble has also
been used to estimate the alignment tensor. For neutral orienting media (C8E5), the SSIA
(Simulation of Sterically Induced Alignment) method assumes that the molecular shape
determines the alignment tensor 22-24. TRAMITE10 uses the moment of inertia tensor to
parameters for an ensemble of conformers based on the shape asymmetry which makes
this method independent of molecular rigidity. For each of the conformers, the RDCs can
also be back calculated from the order parameters.
Molecular Modeling and Simulation
Two different methods of molecular modeling simulation were used to determine the
three dimensional conformation of LNDFH I. The models from each simulation were
treated independently to interpret the residual dipolar coupling data and identify
combinations of conformers which can explain the measured experimental dipolar
coupling values.
We have used the trajectories of MD simulation published earlier by Xia and
Margulis 25 . This is a simulation of 10 ns with explicit SPC water solvent and OPLS-AA
force field. A collection of 40,000 conformations each collected at an interval of 0.25 ps
was obtained. A set of 3200 representative conformers was chosen for the present studies.
A simple and less elaborate simulation based on Monte Carlo simulation was also
performed on LNDFH I without explicit water. The simulation was carried using
Macromodel 26 with 10,000 Monte Carlo steps 19 along with MM3 27 force field and
GB/SA continuum solvent model 28. The selected 2000 conformers had threshold energy
values of 50KJ/mol or less from the lowest energy structure. The random process of
conformer generation using the Monte Carlo algorithm can overcome energy barriers and
sample different regions of the conformational space. Although it is quite possible that
local minima, this collection of conformers can serve as a repertoire for our
conformational search.
The glycosidic torsion angle was used to analyze the conformational space of
LNDFH I. The Φ and Ψ torsion angles are defined according to the IUPAC heavy atom
convention in which Φ is defined by O5-C1-O1-Cx and Ψ by Cx-1-Cx-O1-C1.
Statistical Analysis
One of the major goals of the present study was to determine internal motion as reflected
by the experimental RDC data. In the presence of internal motion the experimental RDC
data are the result of average RDC of the conformers resulting from the motion. MD and
MC simulation were used to search for possible sets of conformers that can explain the
experimental RDC data. Multiple regression analysis technique was used to find the
possible combination of conformers whose calculated RDC was the linear combination of
the observed data.
Multiple linear regression attempts to fit a linear equation which can relate two or
more sets of explanatory (independent) variables to a response (dependent) variable. In
this study, the independent variables were the calculated RDCs for each of the
conformers from the molecular simulations whereas the dependent variables represented
the observed RDC data.
The best sets of independent variables explaining the experimental data were
calculated using the R2 (R–square) selection method. The R2 is a measure of the
proportion of variation explained by the model and ranges between 0 < R2 < 1, where
values closer to 1 indicate a better fit for the model. This method calculates R2 for all
linear fit for the model. From a combinatorial approach, the R2 selection technique is
ideal since it searches through all possible combinations of conformers to best explain the
observed data. However this process is also computationally challenging since an
increase in the number of conformers in the subset increases the computational time
exponentially. Inclusion of fewer than 5 models gave a smaller R2 value while 6 models
gave similar values and computations with 7 or more models were not practical. We
concluded that 5 models is an optimal choice for the experimental data available.
Statistical averaging of the five candidate conformers selected during multiple
linear regression was calculated by assigning weights randomly to each one of them for
10,000 cycles using the following equation:
weights. Squared deviation from the experimental data was calculated using the sum of
the predicted dipolar coupling values from equation 3.6:
(
Pr)
2were used for statistical averaging of the five conformers.
Results
The scalar coupling values were measured for LNDFH I in natural abundance using D2O
as the isotropic media. An anisotropic sample consisting of 5% C8E5/n-octanol liquid
dipolar coupling. Residual dipolar couplings were finally obtained by subtracting
individual splitting obtained in isotropic media from that of anisotropic ones.
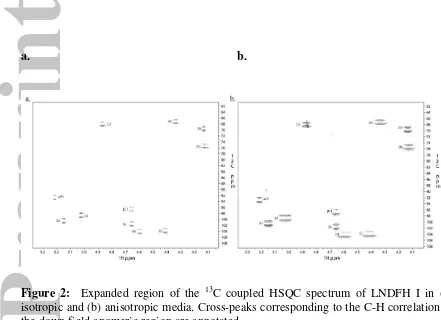
One bond 13C – 1H heteronuclear dipolar couplings (Table 1) were measured
using t1 coupled gradient HSQC (Figure 2) spectra. We report 24 13C - 1H residual dipolar
coupling data measured for LNDFH I. It is to be noted that the glucose residue at the
reducing terminal can have two different anomeric configurations with similar ring
geometry except for the anomeric region. We have used the dipolar couplings of
anomeric carbon and proton from both α and β anomers in this study.
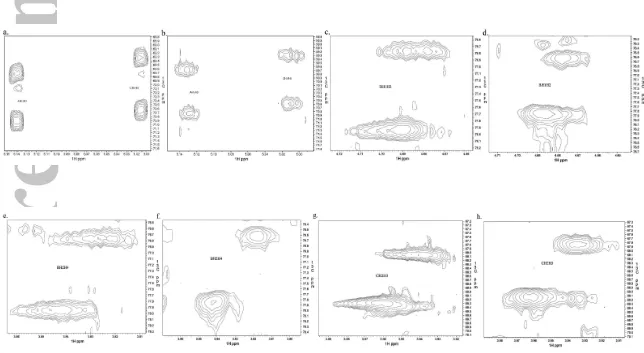
Long range 1H – 1H residual dipolar couplings (nDHH) were measured using 13C
resolved HH-TOCSY 15 (Figure 3). The offsets from the E.COSY type cross peaks in the
proton detected dimension were used to determine the sign and magnitude of the nDHH.
The homonuclear couplings were measured for only those peaks that could be
unambiguously assigned in both isotropic and anisotropic spectra. Although the f1
splittings of the HH-TOCSY spectra could be used to measure one bond 13C – 1H dipolar
couplings, the resolution of such splittings are lower than that of HSQC experiments and
thus not considered for the present calculations. The 26 1H – 1H dipolar couplings (Table
2) measured for LNDFH I included both H1(α) – H2 and H1(β) – H2 splittings from the
glucose residue at the reducing terminal.
Both the gHSQC and HH-TOCSY experiment produced a two dimensional matrix
of 4096 X 512 complex FID data points. The digital resolution of the resulting spectra
was 1.2 Hz/pt in the direct dimension and 2.4 Hz/pt in the indirect dimension. Each
coupled cross peak column was then extracted, phased and stored. An inverse Hilbert
resolution. The residual dipolar coupling was calculated by superimposing two 1D vector
components collected from an isotropic and weakly aligned sample of the
oligosaccharide (Figure 4). One of the vector components was adjusted so that one wing
of the vector completely coincided with the wing of the corresponding vector. The offsets
arising in the other wing of the vectors as a result of the adjustment was the measure of
C-H residual dipolar coupling (1DCH) and long range H-H residual dipolar coupling
(nDHH) from gHSQC and HH-TOCSY experiments respectively. Error in the
measurement attributed mostly to the difference in lineshapes of the two spin doublets of
a single resonance 29 was estimated in both the homonuclear and heteronuclear coupling
to be approximately ±1 Hz to ±1.2 Hz. The experimental data include RDC values for at
least six distinct vector directions for each of the sugar residues. The number of
experimental observables recorded for LNDFH I was much higher than in previous
studies 19,30 on similar oligosaccharides providing a more accurate prediction of the
molecular geometry of LNDFH I.
The hexasaccharide conformation was studied using a 10 ns molecular dynamic
simulation in explicit water as has been discussed earlier 25. The results indicated a single
unique conformation for each of the three linkages in the Lewisb tetrasaccharide epitope
in the LNDFH I hexasaccharide. For the d – e linkage two different conformers were
observed while the lactose linkage (e – f) exhibited some flexibilities in the Ψ angle (77°
- 174°).
The hexasaccharide conformation was also studied using Monte Carlo
simulations. The 10,000 step MC simulation was a less rigorous approach than the MD
above 50 KJ/mol (12 Kcal/mol) threshold energy level were rejected during this
calculation. Unlike the molecular dynamics calculation, each of the linkages of the
hexasaccharide indicated more than one family of conformers (Figure 5: a – e) but the
conformational spaces included conformer families for each of the linkages described by
the MD simulation.
Measuring Internal Motion of the Tetrasaccharide epitope in the hexasaccharide
Powellten was used to assign ranks to each model based on the discrepancies between the
experimental and calculated RDC (χ) value of the optimally oriented tetrasaccharide
model. These model conformers were ranked for both MD and MC simulation results by
plotting χ values on a contour map against the Φ/Ψ dihedral angles for each of the
glycosidic linkages. An experimental error of 1.0 Hz was used for all the model structures
in the calculation.
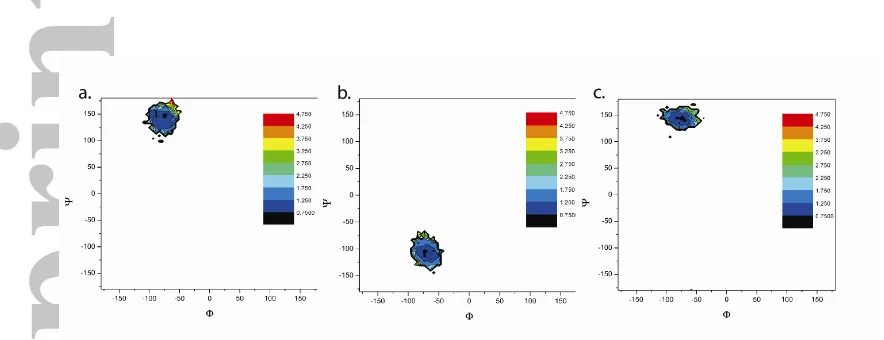
Figure 6 shows two dimensional plots where the minimum discrepancy of the
calculated dipolar coupling from the observed values (χ) from the Powellten calculation
are plotted as a function of the dihedral angle for all the conformers from the MD
simulation. For all three plots, the χ minimum was restricted to a small region within the
dihedral plot. For the α-L-Fuc1 2- β -D-Gal (Φa-b/ Ψa-b) linkage (Figure 6a) this region
lies around -70°/135° a result similar to that reported by Azurmendi and Bush for the
same linkage in blood group A trisaccharide 18. The regions indicating χ minima for the
other two linkages, α-L-Fuc1 4- β -D-GlcNAc and β -D-Gal1 3 β -D-GLcNAc were
approximately (Φb-d/ Ψb-d) -75°/145° and (Φc-d/ Ψc-d) -65°/110° respectively.
The χ minima ranking was also carried out independently for all the conformers
above (Figure 7). The Powellten calculations were repeated with MC data to investigate
whether the results were dependent on a high quality set of simulations (e.g MD with
explicit solvent). A small single region from each of the contour plots indicated
conformers with least deviation from the observed RDC data. The conformers with
lowest RDC discrepancies occupied the same dihedral angle regions as that of the MD
simulation.
To gain further insight into the dynamics of the tetrasaccharide epitope of
LNDFH I, we implemented GDO techniques described in previous studies 6 using the
REDCAT algorithm. Unlike Powellten, where the entire tetrasaccharide epitope was
oriented, the GDO was calculated by independently orienting individual pyranose rings
of the tetrasaccharide. The GDO values of each pyranoside ring of the tetrasaccharide
were calculated from a random frame of the MD trajectory. For the sugar rings a, b, c and
d (Fuc1 2, Gal, Fuc1 4 and GlcNAc) the GDOs were 0.00047, 0.00043, 0.00032 and
0.00081 respectively. Similarities in the values for the first three rings indicate that these
fragments tumble together because of a single rigid conformation. However, different
results for the GlcNAc residue indicate significant internal motion between the rings b –
d and c – d. Comparable GDO values were also obtained from the lowest energy MC
simulation model. The results from the GDO calculation were not consistent with earlier
studies in which the tetrasaccharide was found to exist in a single rigid conformation. The
GDO results thus proved to be inconsistent with previous molecular modeling and NMR
studies of this epitope, perhaps as a result of the complexity of the branched
tetrasaccharide used in the present study as compared to an earlier GDO analysis of a
As an alternative approach, REDCAT was used to measure the order parameters
from the RDC data in order to calculate the amplitude of dihedral angle motion within the
Leb tetrasaccharide epitope. REDCAT assumes that the fragment for which order tensors
are to be calculated is rigid 31. Based on our Powellten calculation and also from earlier
studies on the epitope, we assumed a relatively rigid conformation of the tetrasaccharide
with motions of the first kind 32. It is also assumed that any sub fragments within the
tetrasaccharide should also share the same order parameters and the principal order
frame. This should also be true for the individual sugar pyranoside residues which are
part of the tetrasaccharide and are considered to be fairly rigid. Since the β-D-GlcNAc
resides at the center of the tetrasaccharide fragment, we have used the order tensor
parameters of this residue to orient the entire tetrasaccharide epitope along the principal
order frame. The order tensor parameters were calculated for the β-D-GlcNAc residue
from 100 random MD conformers using REDCAT. At least eight independent C-H and
H-H RDC vectors of the β-D-GlcNAc residue were used for this calculation to avoid an
under-determined system. The best order parameter is the least RMSD solution of all
possible outcomes for the β-D-GlcNAc residue. The order parameter and three Euler
angles were then used to orient the entire tetrasaccharide epitope from which the residual
dipolar couplings were back calculated for each of the 100 models.
Determination of the average RDC required identification of the conformers and
their linear combination coefficients. Multiple linear regression analysis was used to
calculate conformational averaging and estimate the degree of internal motion. RDC data
back-calculated for the 100 tetrasaccharide models were used to explain the experimental
regression model until the best R2 value of 0.98 was achieved for a set of five conformers.
The linear combination coefficients of the five selected conformers are shown in Table 3.
The average dihedral angles of the five best fit conformers and their standard deviations
were calculated (Table 4). Dihedral angles of the final conformers were found in a very
small conformational range with average deviation of the Φ angle to be ~±7.5° and that
of Ψ ~±9° around the average conformer.
The results of RDC averaging performed with MD simulation data sets were
validated by repeating the calculation using conformers from MC simulation. The five
conformers of the tetrasaccharide representing the average RDC value of the
experimental data were distributed in a small conformational space. Three average
dihedral angles (Table 4) of the tetrasaccharide region of LNDFH I were similar to those
obtained from the comparable calculation done with the MD models. The deviations in
dihedral angles between the glycosidic linkages among the five different conformers
were also minimal. Thus, this analysis of the RDC data for the tetrasaccharide epitope,
while it allowed for multiple conformers, showed a good fit with a group of very similar
conformers regardless of the quality of the molecular models employed.
Measuring Internal Motion in LNDFH I Hexasaccharide
The concept of finding combinations of conformers to explain the experimental
data was extended for the hexasaccharide to determine the conformations of
β-D-GlcNAc1 3-β-D-Gal (d – e) and β-D-Gal1 4Glc (e – f) linkages. As this region unlike
the tetrasaccharide, is considered to exhibit domain motion, methods I and II are not
hexasaccharide were predicted based on a shape induced steric obstruction method,
TRAMITE.
To calculate the order parameters, a collection of 100 conformers from the MD
simulation was generated by using the tetrasaccharide dihedral angles from the previous
section (Table 4) to select the possible hexasaccharide conformations. Thus different
possibilities for the glycosidic dihedral angles of d – e and e – f were considered. The
selected conformers had the same tetrasaccharide conformation reported in Table 4, with
different dihedral angles for the d – e and e – f linkages. The RDCs were then back
calculated for each of the 100 conformers.
Multiple linear regression analysis, as described above, was then employed to
determine the collection of models that best explains the experimental data. For the MD
simulation data, the regression model resulted in the identification of five distinct
conformers with R2 of 0.7 (Table 5). When the same calculation was carried out on the
models from MC data, a set of five models was obtained whose linear combination
equaled the observed RDC values. The R2 for the models from the MC simulation was
0.69 (Table 5). The decrease in R2 value as compared to the tetrasaccharide calculation
can be attributed to the increase in the number of RDCs incorporated in the
hexasaccharide model thereby increasing the degrees of freedom for the resulting fit.
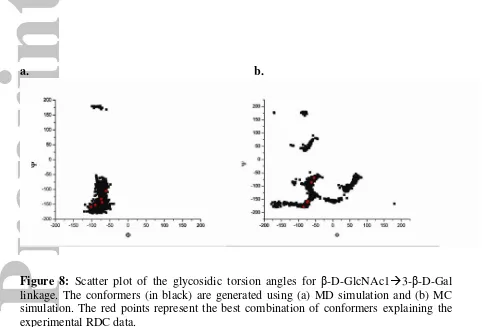
The five conformers resulting from our calculation can be broadly classified
within three distinct regions in the dihedral angle space of the d-e linkage (Figure 8a).
The Φ and Ψ angles for the conformers in these three regions are -60° /-105° (region I),
-74°/-131° (region II) and -90°/-152° (region III) respectively (Table 6). The differences
than in the Φ dihedral angle. A similar calculation using MC simulation models also
identified three different conformational regions whose Φ and Ψ dihedral angles are
-61.32°/-85.86° (region I), -72.27°/-157.24° (region II), and -85.00°/-179.4° (region III)
respectively (Table 6). The conformers in these three regions were much more widely
dispersed in the Ψ dihedral region compared to that of MD outcomes (Figure 8b). The
study of d-e linkage from both MD and MC data thus indicated conformational averaging
among three different conformers. When statistical averaging was carried out on the five
conformers from MD and MC simulation we found that 80% of the conformers were
represented by the regions II and III while only 20% of the population were observed in
region I.
The results from both MD and MC simulation data showed a broad single
conformational region occupied by the β-D-Gal1 4-Glc (e – f) dihedral angle. The five
conformers resulting from the multiple linear regression calculation were found to be
spread throughout this broad conformational region. For the results obtained from MD
data the Φ dihedral angles range between -95° to -65° and the Ψ dihedral angle ranges
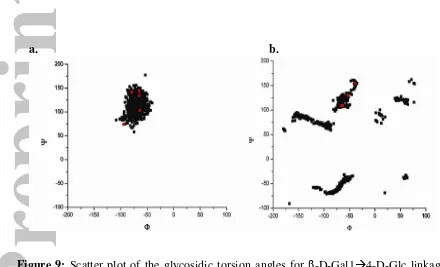
between 74° to 144° (Figure 9a). Similar results were obtained from the MC calculation
where the Φ and Ψ dihedral ranged between -70° to -40° and 108° to 154° respectively
(Figure 9b). Although these conformers were found in discrete regions within the
conformational space, it is reasonable to assume that these conformers give a sense of
average degree of motion within this conformational region. The amplitude of this
motion was found within a broad range of ±30° (Φ) and ±20° (Ψ) indicating large
absence of steric interaction for the glucose with the rest of the sugars since it is
positioned further away from the tetrasaccharide.
For the Leb tetrasaccharide region of LNDFH I, our results indicated a single
conformation with small local fluctuation between the glycosidic linkages. The fact that
glycosidic dihedral angles of the Lewisb fragment occupy a narrow potential energy well
correlates with previous studies 3334. The dihedral angles of the tetrasaccharide linkages
predicted by our study matches with the data obtained from lectin (GS4) bound Lewisb35
except for the α-L-Fuc1 4- β -D-GlcNAc linkage, where the Φ angle differed by ~15°.
Similarities were also observed with the dihedral angles of the tetrasaccharide calculated
by Martin-Pastor and Bush, 30 except for the α-L-Fuc1 2-β-D-Gal linkage.
Conformational exchange among three different conformers observed in this study for the
β-GlcNAc1 3-β-D-Gal linkage contrasts with earlier NMR studies indicating a single
unique conformation for this linkage 30,36. However, these results for the GlcNAc1
3-β-D-Gal (e-f) linkage are consistent with similar studies on another milk oligosaccharide,
Lacto-N-neotetraose (LNnT) 37. Substantial flexibility of the lactose glycosidic linkage
was confirmed by the present study. In LNDFH I, the lactose linkage is in continuous
motion within a single broad conformational well. Minimal steric interaction of the
glucose residue with other pyranose rings in the hexasaccharide is a plausible explanation
for such motion. These motions can be represented as conformers with a broad potential
energy well, in contrast to those with more than one narrow potential well separated by
energy barriers. Similar motion of the lactose linkage has also been proposed by
Conclusion
We investigated the internal motion of the hexasaccharide Lacto-N-di-Fuco hexose I
using 1D
CH and nDHH residual dipolar couplings. The approach used is related to that of
Blackledge and coworkers for describing domain motion in partially folded proteins as
reviewed in ref. 38. For that system which has been much more extensively studied, one
can rely on a library of known polypeptide substructures. For oligosaccharides we used
simple molecular modeling calculations to construct candidate structures.
We present methods to extract a large number of RDC data from an
oligosaccharide molecule, which is enough to test either rigid or flexible models for best
fit to experimental data. The use of more RDC data than any of the previous studies helps
in accurate determination of the orientation tensors. Instead of using the RDCs as
constraints 39, we have exploited the fact that these NMR observables exist as an average
value of all the possible conformers. Our model for flexible conformation is represented
by an ensemble of conformers exchanging at a rate faster than few hundred hertz. Such
an assumption is certainly valid for oligosaccharides.
Three distinct internal motions were observed in LNDFH I. Small local libration
(~±10°) around the average conformer resulted in a relatively rigid conformation of the
Lewisb tetrasaccharide region. Three different conformers resulted in conformational
exchange of the β-D-GlcNAc1 3-β-D-Gal linkage. Large internal motion of the
β-D-Gal1 4-Glc linkage within a single conformational well indicates highly flexible
linkage. Our methods were also able to quantify the degree of internal motions of this
complex sugar. The results indicate sensitivity of RDC to small changes in the dihedral
availability of high quality MD simulation and were supported by results from a simple
Monte Carlo data. The fact that our results were able to narrow down the rigid
conformational spaces for the three dihedral angles of the tetrasaccharide from a
multi-conformational space generated by MC simulation indicates the robustness of our
method. This method proved efficient for prediction of internal motion using a simple set
of molecular simulations to sample the conformational space. An important result of this
Reference:
(1) Adeyeye, J.; Azurmendi, H. F.; Stroop, C. J. M.; Sozhamannan, S.; Williams, A.
L.; Adetumbi, A. M.; Johnson, J. A.; Bush, C. A. Biochemistry 2003, 42,
3979-3988.
(2) Lemieux, R. U.; Bock, K.; Delbaere, L. T. J.; Koto, S.; Rao, V. S. Can. J. Chem.
1980, 58, 631-53.
(3) Rundloef, T.; Venable, R. M.; Pastor, R. W.; Kowalewski, J.; Widmalm, G. J. Am. Chem. Soc. 1999, 121, 11847-11854.
(4) Martin-Pastor, M.; Bush, C. A. Biopolymers 2000, 54, 235-248.
(5) Xia, J.; Daly, R. P.; Chuang, F.-C.; Parker, L.; Jensen, J. H.; Margulis, C. J. J. Chem. Theory Comput. 2007, 3, 1620-1628.
(6) Tian, F.; Al-Hashimi, H. M.; Craighead, J. L.; Prestegard, J. H. J. Am. Chem. Soc.
2001, 123, 485-492.
(7) Venable, R., M.; Delaglio, F.; Norris, S., E.; Freedberg, D., I. Carbohydr. Res.
2005, 340, 863-874.
(8) Martin-Pastor, M.; Bush, C. A. Carbohydr. Res. 2000, 323, 147-155.
(9) Valafar, H.; Prestegard, J. H. J. Magn. Reson. 2004, 167, 228-241.
(16) Tjandra, N.; Bax, A. Science (Washington, D. C.) 1997, 278, 1111-1114.
(17) Bax, A. Protein Sci. 2003, 12, 1-16.
(18) Azurmendi, H. F.; Bush, C. A. Carbohydr. Res. 2002, 337, 905-915.
(19) Azurmendi, H. F.; Martin-Pastor, M.; Bush, C. A. Biopolymers 2002, 63, 89-98.
(20) Saupe, A. Angew. Chem., Int. Ed. Engl. 1968, 7, 97-112. Caufield, C.; Chang, G.; Hendrickson, T.; Still, W. C. J. Comput. Chem. 1990, 11,
440-67.
(31) Losonczi, J. A.; Andrec, M.; Fischer, M. W. F.; Prestegard, J. H. J. Magn. Reson.
1999, 138, 334-342.
(32) Gunawardena, S.; Fiore, C. R.; Johnson, J. A.; Bush, C. A. Biochemistry 1999, 38,
12062-12071.
(33) Cagas, P.; Bush, C. A. Biopolymers 1990, 30, 1123-38.
(34) Mukhopadhyay, C.; Bush, C. A. Biopolymers 1991, 31, 1737-46.
(35) Delbaere, L. T. J.; Vandonselaar, M.; Prasad, L.; Quail, J. W.; Wilson, K. S.; Dauter, Z. J. Mol. Biol. 1993, 230, 950-65.
(36) Almond, A.; Petersen, B. O.; Duus, J. O. Biochemistry 2004, 43, 5853-5863.
(37) Landersjoe, C.; Jansson, J. L. M.; Maliniak, A.; Widmalm, G. J. Phys. Chem. B
2005, 109, 17320-17326.
(38) Blackledge, M. Prog. Nuclear Magn. Reson. Spect. 2005, 46, 23-61.
a. b.
Figure 2: Expanded region of the 13C coupled HSQC spectrum of LNDFH I in (a)
Figure 3: Expanded regions from the 13C resolved HH-TOCSY spectra in (a, c, e and g) D2O and (b, d, f and h) orienting media 5%
C8E5 used to measure long range homonuclear 1H, 1H residual dipolar couplings in LNDFH I. For each of the peaks the first letter and
Figure 4: A 1D slice extracted from 2D gHSQC spectra. The two spectra recorded from
Figure 5: Scatter plot of five Φ/ Ψ dihedral angles for 2000 conformers of LNDFH I with
a threshold energy of 50KJ/mol calculated from Monte Carlo simulation. (a) α-L
Figure 6: Contour plots from the molecular dynamics models of the tetrasaccharide
epitope with the ranking of conformers based on the χmin value calculated using Powellten
Figure 7: Contour plots from the Monte Carlo models of the tetrasaccharide epitope with
the ranking of conformers based on the χmin value calculated using Powellten for
a. b.
Figure 8: Scatter plot of the glycosidic torsion angles for β-D-GlcNAc1 3-β-D-Gal
a. b.
Figure 9: Scatter plot of the glycosidic torsion angles for β-D-Gal1 4-D-Glc linkage.
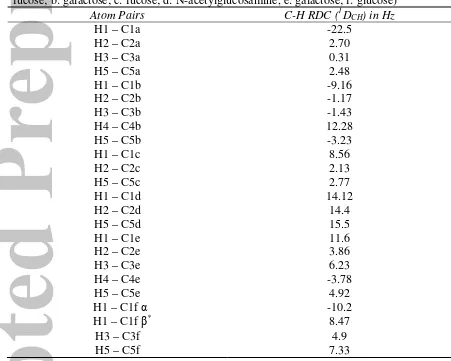
Table 1. One bond C-H experimental residual dipolar couplings in Hz of LNDFH I. (a:
fucose; b: galactose; c: fucose; d: N-acetylglucosamine, e: galactose; f: glucose)
Table 2. Long Range H-H experimental residual dipolar couplings of LNDFH I.
(a: fucose; b: galactose; c: fucose; d: N-acetylglucosamine, e: galactose; f: glucose)
Atom Pairs H-H RDC (nDHH) in Hz
Table 3. The intercept and linear combination coefficients of the models resulting in an
average conformer of the tetrasaccharide epitope of LNDFH1.
MD MC
Table 4. Dihedral angles of the average conformer of the tetrasaccharide epitope with the
degrees of fluctuation
Fuc1 2Gal Gal1 3GlcNAc Fuc1 4Gal
Phi Psi Phi Psi Phi Psi
MD -69.4°±7° 139.8°±10° -63.2°±8° 103.8°±10° -77.8°±8° 144.4°±8°
MC -78.0°±8° 145.4°±7° -65.9°±2° 93.4°±6° -76.7°±5° 143.4°±2°
Table 5. The intercept and linear combination coefficients of the models resulting in an
average conformer of the hexasaccharide LNDFH I
Table 6. Major conformers of GlcNAc1 3Gal linkage in LNDFH1 calculated from MD
and MC data
Conf I Conf II Conf III
MD -60.55°/-105.09° -74.04°/-131.84° -90.17°/-151.97°