DOI: 10.1542/peds.2008-2663
2009;123;e1017-e1027
Pediatrics
V. Jaddoe, Albert Hofman, Johan P. Mackenbach and Hein Raat
Lenie van Rossem, Anke Oenema, Eric A. P. Steegers, Henriëtte A. Moll, Vincent W.
The Generation R Study
Are Starting and Continuing Breastfeeding Related to Educational Background?
http://www.pediatrics.org/cgi/content/full/123/6/e1017
located on the World Wide Web at:
The online version of this article, along with updated information and services, is
rights reserved. Print ISSN: 0031-4005. Online ISSN: 1098-4275.
ARTICLE
Are Starting and Continuing Breastfeeding Related to
Educational Background? The Generation R Study
Lenie van Rossem, MSca,b, Anke Oenema, PhD, MPHb, Eric A. P. Steegers, MD, PhDc, Henrie¨tte A. Moll, MD, PhDd, Vincent W. V. Jaddoe, MD, PhDa,d,e, Albert Hofman, MD, PhDe, Johan P. Mackenbach, MD, PhDb, Hein Raat, MD, PhDb
aGeneration R Study Group,bDepartment of Public Health,cDivision of Obstetrics and Prenatal Medicine, Department of Obstetrics and Gynecology, and Departments of dPediatrics andeEpidemiology, Erasmus MC-University Medical Centre Rotterdam, Rotterdam, Netherlands
The authors have indicated they have no financial relationships relevant to this article to disclose.
What’s Known on This Subject
In Western countries, socially disadvantaged mothers start breastfeeding less often and also have a shorter breastfeeding duration. It is unknown which factors explain the association between social disadvantage and breastfeeding.
What This Study Adds
Socially disadvantaged mothers are less likely to start breastfeeding and to continue it for 2 months. Lifestyle-related and birth characteristics are important modifying factors in the association between educational level and breastfeeding.
ABSTRACT
OBJECTIVE.To assess the effect of a woman’s educational level on starting and continu-ing breastfeedcontinu-ing and to assess the role of sociodemographic, lifestyle-related, psy-chosocial, and birth characteristics in this association.
METHODS.We used the data of 2914 participants in a population-based prospective cohort study. Information on educational level, breastfeeding, sociodemographic (maternal age, single parenthood, parity, job status), lifestyle-related (BMI, smoking, alcohol use), psychosocial (whether the pregnancy was planned, stress), and birth (gestational age, birth weight, cesarean delivery, place and type of delivery) charac-teristics were obtained between pregnancy and 12 months postpartum. Odds ratios and 95% confidence intervals of starting and continuing breastfeeding for educa-tional level were obtained by logistic regression, adjusted for each group of covariates and for all covariates simultaneously.
RESULTS.Of 1031 highest-educated mothers, 985 (95.5%) started breastfeeding; the percentage was 73.1% (255 of 349) in the lowest-educated mothers. At 6 months, 39.3% (405 of 1031) of highest-educated mothers and 15.2% (53 of 349) of lowest-educated mothers were still breastfeeding. Educationally related differences were present in starting breastfeeding and the continuation of breastfeeding until 2 months but not in breastfeeding continuation between 2 and 6 months. Lifestyle-related and birth characteristics attenuated the association between educational level
and breastfeeding, but the association was hardly affected by sociodemographic and psychosocial characteristics.
CONCLUSIONS.Decisions to breastfeed were underlain by differences in educational background. The underlying path-ways require further research. For the time being, interventions on promoting breastfeeding should start early in
pregnancy and should increase their focus on low-educated women.Pediatrics2009;123:e1017–e1027
B
REASTFEEDING HAS CONVINCINGLYbeen established as the best type of feeding for a child, bringing short-termhealth benefits such as a lower risk for otitis media,1 gastroenteritis,2 and respiratory infections.3 In the
long-term, breastfeeding may also reduce the risk for obesity4and diabetes mellitus.5To benefit from these health
effects, the World Health Organization recommends 6 months of exclusive breastfeeding.6
Various studies have found that socially disadvantaged mothers start breastfeeding less often and also breastfeed
for a shorter period.7–11 Although none of these studies explained such social inequalities in breastfeeding, the
implication is clear: at the start of their lives, children from socially disadvantaged families may already run a higher risk of several diseases.
The literature on the determinants of breastfeeding12–18has consistently identified maternal smoking and lower
maternal age as predictors of lower breastfeeding rates.17To establish the role of these and other characteristics in
explaining the social inequalities relative to breastfeeding, we used the Generation R Study, a birth cohort study, to collect data on breastfeeding and on relevant demographic, psychosocial, lifestyle-related, and birth characteristics. Our study had 2 objectives. The first was to establish whether there were any differences between high-educated and low-educated mothers with regard to (1) starting breastfeeding, (2) continuing it for 2 months after birth, and (3) continuing it for between 2 and 6 months after birth. The second objective was to establish how the known
www.pediatrics.org/cgi/doi/10.1542/ peds.2008-2663
doi:10.1542/peds.2008-2663
Key Words
breastfeeding, socioeconomic status
Abbreviations
OR— odds ratio CI— confidence interval FAD—Family Assessment Device MABS—Mother and Baby Scales
Accepted for publication Feb 17, 2009
Address correspondence to Lenie van Rossem, MSc, Erasmus MC-University Medical Centre Rotterdam, Generation R Study Group, PO Box 2040, Room Ae-007, 3000 CA, Rotterdam, Netherlands.
E-mail: [email protected]
determinants of breastfeeding affected the association between mother’s educational level and starting and continuing breastfeeding.
For the second objective, we conceptualized that ed-ucational level is the most distal factor determining breastfeeding behavior, and sociodemographic, lifestyle-related, psychosocial, and birth characteristics are more proximal factors for breastfeeding initiation or continu-ation.
Maternal education was used as an indicator of socioeconomic status, because it reflects not only ma-terial resources but also noneconomic characteristics such as general and health-related knowledge, which in turn influence health behavior, and problem-solving skills.19,20The association between socioeconomic status
and infant feeding practice may vary by ethnic group.21–25 For example, Griffiths et al21 found that
so-cioeconomic status is not associated with breastfeeding
continuation in nonwhite women.21This study was
re-stricted to women with Dutch ethnicity to eliminate the effect of ethnicity from the effect of educational level on breastfeeding.
METHODS
Study Design
This study was embedded in the Generation R Study, a population-based, prospective cohort study from fetal life until young adulthood. The Generation R Study was designed to identify early determinants of growth,
de-velopment, and health.26Enrollment ideally took place
in early pregnancy (at a gestational age of⬍18 weeks), which was the case in 69% of subjects, but was possible until the birth of the child. The study was conducted in accordance with the guidelines proposed in the World Medical Association Declaration of Helsinki and was ap-proved by the Medical Ethical Committee at Erasmus MC, University Medical Centre Rotterdam. Written con-sent was obtained from all participants.
Study Population
The Generation R Study is conducted in Rotterdam, Netherlands. The study area is defined by postal codes and covers more than half of the city’s inhabitants
(⬃600 000). Collaboration was established with all 8
midwifery practices, 3 hospitals, and 16 child health centers located in this area. Invitations to participate in the study were made to all pregnant mothers who had an expected delivery date between April 2002 and Jan-uary 2006 and who lived in the study area.
This study was restricted to Dutch participants. A woman was classified as being of Dutch ethnicity when she reported that both her parents had been born in the
Netherlands.27 Consent for postnatal follow-up was
given by a total of 3787 Dutch women with live-born children.
Because of the different circumstances regarding breastfeeding and delivery, twin pregnancies (115) were excluded. To avoid clustering, our analyses excluded data on the second (n⫽365) or third (n⫽8) pregnancy of the women who were participating in the Generation
R Study with ⬎1 child (10.2%). Our analyses also
ex-cluded participants with missing data on any of the following: educational level (n ⫽ 14), starting breast-feeding (n⫽130), breastfeeding at 2 months after birth
(n ⫽ 186), or breastfeeding at 6 months after birth
(n⫽ 55). Eventually, 2914 subjects were available for
analyses. Thus, after exclusion of the data of mothers who gave birth to twins, and of mothers regarding their second or third pregnancy in the study, complete data on determinant and outcome was available for 88.3% of Dutch mothers who gave postnatal consent.
Educational Level
Level of maternal education was established at enroll-ment and categorized as follows: 1 (low: no education,
or primary school: ⱕ3 years of general secondary
school); 2 (midlow: ⬎3 years of general secondary
school); 3 (midhigh: higher vocational training, under-graduate programs, or bachelor’s degree); and 4 (high:
higher academic education) (Appendix 1).28
Breastfeeding
Three indicators of breastfeeding were constructed: starting breastfeeding,23the continuation of any
breast-feeding for 2 months after birth, and the continuation of breastfeeding between 2 months and 6 months after birth. Data on starting breastfeeding were collected from delivery reports, and data on breastfeeding initiation and continuation were derived from postal questionnaires at 2, 6, and 12 months after birth. Information on exclusive breastfeeding was available for 2 months. Questionnaire items are included in Appendix 2.
Covariates
Literature on the determinants of breastfeeding12–18,29
was used to select potential mediators for the association between maternal educational level and breastfeeding (categories are in parentheses).
Sociodemographic Characteristics
Parity (primiparity, multiparity) and maternal age (⬍30,
30 –35, andⱖ35 years) were measured at intake. Single
parenting (no partner, partner) and job status after birth (not employed, employed) was established by using a questionnaire.
Psychosocial Characteristics
Prenatal stress was measured by using the Family As-sessment Device (FAD), a 12-item questionnaire on gen-eral family function (pathologic score:⬎2.17; nonpatho-logic score: ⱕ2.17).30 Postnatal stress was measured by
using the 13-item subscale “lack of confidence in care-taking” from the Mother and Infant Scales (MABS), which was administered 2 months after birth (cutoff point at mean⫹1 SD).31,32Planned pregnancy (yes, no)
was assessed by using a prenatal questionnaire.
Lifestyle-Related Characteristics
BMI was calculated (normal weight [BMI⬍25 kg/m2],
overweight [BMI ⫽ 25–30 kg/m2 ], obese [BMI ⱖ 30
kg/m2]).33Information on maternal smoking
(nonsmok-ing dur(nonsmok-ing pregnancy, smok(nonsmok-ing dur(nonsmok-ing pregnancy) and alcohol use (nonuser during pregnancy, user during pregnancy) was retrieved from the prenatal questionnaire.
Birth Characteristics
Birth characteristics were obtained from delivery records and included birth weight (⬍2500 g,ⱖ2500 g), cesarean delivery (yes, no), and gestational age (⬍37 weeks,ⱖ37 weeks). In the Netherlands, deliveries by women who are not at increased risk of obstetric and medical com-plications are conducted under the responsibility of a community midwife, either at home or in the hospital. Delivery by women with an increased risk (eg, twin pregnancy, gestational hypertension) takes place in the hospital under the responsibility of an obstetrician. Place and type of delivery was obtained from delivery reports (home birth; hospital delivery, low risk; hospital deliv-ery, high risk).
Statistical Analyses
We established the frequency distributions of breast-feeding and covariates for breastbreast-feeding according to educational level. 2 tests were used to test the
differ-ences in mothers’ educational level for covariates for breastfeeding.
Multivariable logistic regression was used to test the association between educational level, breastfeeding indicators, and mediators. Model 1 was the association between educational level and breastfeeding indicators. We then added successively to model 1 all sociodemo-graphic characteristics (model 2), all lifestyle-related characteristics (model 3), all psychosocial characteris-tics (model 4), and all birth characterischaracteris-tics (model 5). In model 6, all covariates were simultaneously added to model 1. All covariates were treated as categorical variables.
If the percentage of missing values of covariates in the study population did not exceed 5%, subjects with miss-ing values on that covariate were assigned to the most prevalent category for that variable (single parenting, place and type of delivery, parity). If⬎5% was missing on a particular covariate, a separate “missing” category was included in the analyses (job status, maternal BMI, maternal smoking, alcohol use, method of delivery,
planned pregnancy, maternal stress).34 The maximum
percentage of missing values was 25.0%.
All statistical analyses were performed by using SPSS 15.0 for Windows (SPSS Inc, Chicago, IL).
RESULTS
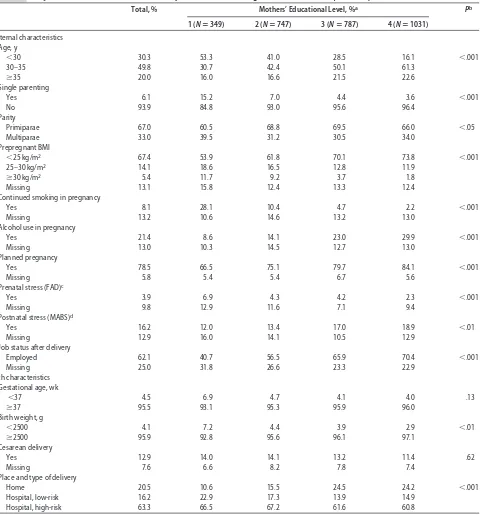
The mothers’ mean age was 31.7 years (SD: 4.22). The infants’ mean birth weight was 3490 g (SD: 551) and lay below 2500 g for 4.1% of the infants. Mean gestational age was 40.0 weeks (range: 27.1– 43.4 weeks); 4.5% of the infants were born before 37 weeks of gestation (Ta-ble 1). All covariates in Ta(Ta-ble 1, except cesarean delivery
and gestational age, were significantly associated with educational level.
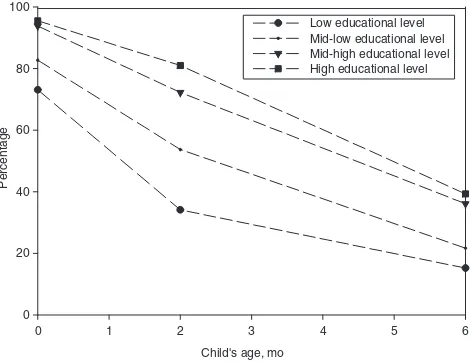
Overall, 89.1% (2596 of 2914) of women started breastfeeding, which was lower for mothers in education category 1 (73.1% [255 of 349]) than for mothers in
education category 4 (95.5% [985 of 1031]) (P⬍.001)
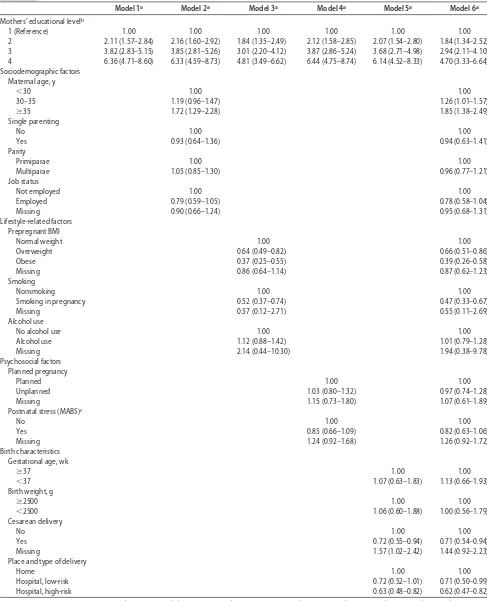
(Fig 1, Table 2). Of the 2596 mothers who started breast-feeding, 1923 (74.1%) were still breastfeeding when their infants were aged 2 months (Fig 1); 1042 (40.1%) of infants were exclusively breastfed. During this period, more mothers in education category 4 than mothers in education category 1 continued breastfeeding (odds ratio [OR]: 6.36 [95% confidence interval (CI): 4.71– 8.60]) (Table 3), and more mothers in education category 4 continued exclusive breastfeeding (OR: 2.78 [95% CI: 2.04 –3.80]). Of the 1923 mothers who were still breast-feeding when their infants were aged 2 months, 904 (47%) continued breastfeeding until 6 months (Fig 1). The continuation of breastfeeding between 2 and 6 months did not differ between mothers in education category 4 and education category 1 (OR: 1.17 [95% CI: 0.79 –1.72]) (data not shown). At 6 months, 39.3% (405 of 1031) of the highest-educated mothers and 15.2% (53 of 349) of the lowest-educated mothers were still breast-feeding. All covariates, except prenatal stress and pre-term birth, were associated with at least 1 of 3 breast-feeding indicators (Appendix 3).
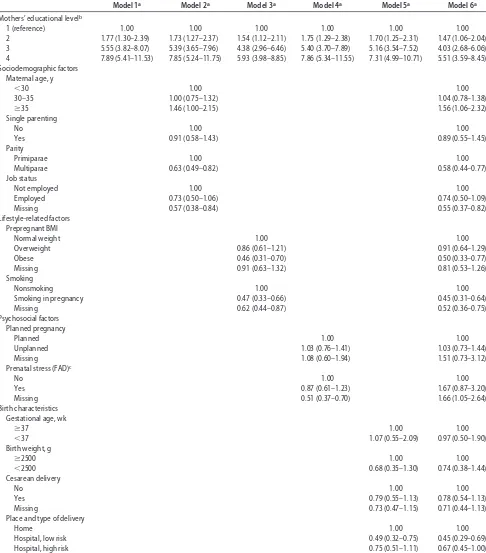
The association between educational level and start-ing breastfeedstart-ing was attenuated most by the addition of the lifestyle-related characteristics followed by the birth
characteristics. Sociodemographic and psychosocial
characteristics had no appreciable effect on the ORs for starting breastfeeding (Table 2). A similar effect was seen in the association between educational level and con-tinuing breastfeeding for 2 months (Table 3).
DISCUSSION
This cohort study shows that although there was a graded inverse gradient between educational level and starting breastfeeding and continuing it until 2 months after birth, there was no such gradient for continuing breastfeeding between 2 and 6 months after birth. These associations are partly explained by lifestyle-related and birth characteristics. Nonetheless, associations between breastfeeding practices and a woman’s educational back-ground remain largely unexplained.
Methodologic Considerations
This study used maternal educational level as single indi-cator of maternal socioeconomic status.35 Socioeconomic
status is a multifactor construct, whose most common in-dicators are educational level, income level, and occupa-tional class.20,35As a socioeconomic indicator, level of
edu-cation can also be applied to teenage and unemployed mothers, unlike occupational class. However, educational level does not entirely capture the material and financial aspects of socioeconomic status.19,20Although fathers also
influence breastfeeding decisions,8 fathers’ educational
breast-feeding, because she is the main caregiver for the child and the only person who can breastfeed. However, fathers’ educational level was associated with all breastfeeding in-dicators, but less strongly than mothers’ educational level. In addition, fathers’ educational level did not differ much from mothers’ educational level within 1 family (data not shown).
There was some selection toward a study population
that was relatively highly educated and somewhat healthier.26For selective participation to explain our
re-sults, nonresponders would have been more often of low socioeconomic status and more often breastfeeding. This is unlikely, although we cannot ascertain this.
This study was restricted to Dutch women. In
accor-dance with the Dutch Standard Classification,27 we
as-signed a Dutch ethnicity to a participant if both her
TABLE 1 Subject Characteristics for Total Study Population and According to Educational Level (Nⴝ2914)
Total, % Mothers’ Educational Level, %a Pb
1 (Nⴝ349) 2 (Nⴝ747) 3 (Nⴝ787) 4 (Nⴝ1031)
Maternal characteristics Age, y
⬍30 30.3 53.3 41.0 28.5 16.1 ⬍.001
30–35 49.8 30.7 42.4 50.1 61.3
ⱖ35 20.0 16.0 16.6 21.5 22.6
Single parenting
Yes 6.1 15.2 7.0 4.4 3.6 ⬍.001
No 93.9 84.8 93.0 95.6 96.4
Parity
Primiparae 67.0 60.5 68.8 69.5 66.0 ⬍.05
Multiparae 33.0 39.5 31.2 30.5 34.0
Prepregnant BMI
⬍25 kg/m2 67.4 53.9 61.8 70.1 73.8
⬍.001
25–30 kg/m2 14.1 18.6 16.5 12.8 11.9
ⱖ30 kg/m2 5.4 11.7 9.2 3.7 1.8
Missing 13.1 15.8 12.4 13.3 12.4
Continued smoking in pregnancy
Yes 8.1 28.1 10.4 4.7 2.2 ⬍.001
Missing 13.2 10.6 14.6 13.2 13.0
Alcohol use in pregnancy
Yes 21.4 8.6 14.1 23.0 29.9 ⬍.001
Missing 13.0 10.3 14.5 12.7 13.0
Planned pregnancy
Yes 78.5 66.5 75.1 79.7 84.1 ⬍.001
Missing 5.8 5.4 5.4 6.7 5.6
Prenatal stress (FAD)c
Yes 3.9 6.9 4.3 4.2 2.3 ⬍.001
Missing 9.8 12.9 11.6 7.1 9.4
Postnatal stress (MABS)d
Yes 16.2 12.0 13.4 17.0 18.9 ⬍.01
Missing 12.9 16.0 14.1 10.5 12.9
Job status after delivery
Employed 62.1 40.7 56.5 65.9 70.4 ⬍.001
Missing 25.0 31.8 26.6 23.3 22.9
Birth characteristics Gestational age, wk
⬍37 4.5 6.9 4.7 4.1 4.0 .13
ⱖ37 95.5 93.1 95.3 95.9 96.0
Birth weight, g
⬍2500 4.1 7.2 4.4 3.9 2.9 ⬍.01
ⱖ2500 95.9 92.8 95.6 96.1 97.1
Cesarean delivery
Yes 12.9 14.0 14.1 13.2 11.4 .62
Missing 7.6 6.6 8.2 7.8 7.4
Place and type of delivery
Home 20.5 10.6 15.5 24.5 24.2 ⬍.001
Hospital, low-risk 16.2 22.9 17.3 13.9 14.9
Hospital, high-risk 63.3 66.5 67.2 61.6 60.8
aScale: 1⫽lowest, 4⫽highest. bPfor2tests.
cYes indicates a score of⬎2.17 (clinical cutoff score).
parents had been born in the Netherlands. However, when identifying immigrant descent in Dutch residents, this classification goes no further than the second gen-eration. The number of third-generation immigrants is nonetheless likely to have been very small and not to have affected our conclusions. Non-Dutch women in the Generation R Study had a substantially different distri-bution on educational level, and some categories were not represented, which makes it difficult to distinguish between the effect of ethnicity and educational level. However, ethnicity may also be an important marker of social disadvantage, and its association with breastfeed-ing should be further investigated.
When women recall breastfeeding only shortly after it has finished, as in our study, self-reported information on breastfeeding has shown itself to be valid and reli-able.36However, because we lacked information on
post-natal smoking behavior, we used smoking during preg-nancy as a proxy for postnatal smoking. Consequently, nonsmoking mothers during pregnancy who restarted smoking after delivery were misclassified as “nonsmok-ing.” In addition, smoking during pregnancy is likely to be underreported, which was slightly the case in our population.37 Misclassification or underreporting of the
determinants of breastfeeding, and in particular smoking status, may have led to residual confounding resulting in a lack of an explanation for the association we observed between maternal education and breastfeeding.
Health gain from breastfeeding is optimal when an infant is exclusively breastfed for 6 months.38 Data on
exclusive breastfeeding were available for the first 2 months after birth. Educationally related differences were seen in both breastfeeding and exclusive breast-feeding. However, health benefits are also reported for breastfeeding initiation and several durations of (partly) breastfeeding compared with never breastfed.39
Comparison With Other Studies
Although the breastfeeding rates in our study were fairly high relative to those in earlier reports,16,40 they were
consistent with the upward trend toward breastfeeding that has been taking place in Western countries since the 1990s.41
Our study is also consistent with earlier reports stat-ing that rates of breastfeedstat-ing are higher in women with a higher socioeconomic status than in those with a lower socioeconomic status.7–11However, the educationally
re-lated differences were greater than those reported in
earlier studies.7–11For example, when comparing
moth-ers who had at least a high school diploma with those
who had no such diploma, Dubois and Girard7found an
OR of 3.54 (95% CI: 2.56 – 4.89) for starting breastfeed-ing. When we repeated our analyses, categorizing ma-ternal education into 3 levels similar to those of Dubois
and Girard,7the OR for the highest versus the lowest
educated mothers was 5.99 (95% CI: 3.40 –10.58). A recent study that found no socioeconomic differences in breastfeeding claimed that when overall breastfeeding prevalence exceeds 80%, there will no longer be any
socioeconomic differences.42 Our results would tend to
refute this; despite a very high overall breastfeeding initiation rate, we found substantial educationally re-lated differences in breastfeeding rates.
Explaining the Educational Level/Breastfeeding Association We considered 4 groups, including 13 covariates in total, of potential mediators. Lifestyle-related and birth char-acteristics can be considered as mediators, because they considerably attenuated the association between educa-tional level and breastfeeding.43Next, we discuss the role
of potential mediating covariates in the association be-tween educational level and breastfeeding. However, because the causal mechanisms regarding the effects on breastfeeding are unknown, the covariates in our study might also be considered as additional markers of social disadvantage.
The Role of Obesity
It is unclear why obese mothers breastfeed less than nonobese mothers. Four possible mechanisms have been described.44First, obese women more often have medical
complications. However, this is probably not the under-lying mechanism in our study, because we adjusted for several perinatal characteristics. Second, psychological factors may play a role; obese mothers are more often depressed and depressed mothers are less likely to breastfeed. From our data, prenatal and postnatal stress did not influence the association between educational level and breastfeeding. A third mechanism may be an-atomically/physiologically related. A delay in
lactogene-sis has been found in obese women.44,45 Also, obese
women often have large breasts, which can create diffi-culties in attaching the infant to the breast. Finally, obese women more often belong to environments with different health beliefs. These last 2 mechanisms could also be interrelated; the delay in lactogenesis can be due to a lower intention to breastfeed.44
The Role of Smoking
Alterations in infants’ sleep patterns have been found after they had ingested nicotine from breastfeeding. It is
Child's age, mo
hypothesized that decreased (quality of) sleep results in dissatisfied infants, which is then thought by the moth-ers to be due to lack of breastfeeding.46Indeed, smoking
mothers are more likely to perceive their milk supply as insufficient and are less likely to seek help with breast-feeding difficulties than nonsmokers.46–49However, this
TABLE 2 Logistic Regression for Starting Breastfeeding (Nⴝ2914)
Model 1a Model 2a Model 3a Model 4a Model 5a Model 6a
Mothers’ educational levelb
1 (reference) 1.00 1.00 1.00 1.00 1.00 1.00
2 1.77 (1.30–2.39) 1.73 (1.27–2.37) 1.54 (1.12–2.11) 1.75 (1.29–2.38) 1.70 (1.25–2.31) 1.47 (1.06–2.04) 3 5.55 (3.82–8.07) 5.39 (3.65–7.96) 4.38 (2.96–6.46) 5.40 (3.70–7.89) 5.16 (3.54–7.52) 4.03 (2.68–6.06) 4 7.89 (5.41–11.53) 7.85 (5.24–11.75) 5.93 (3.98–8.85) 7.86 (5.34–11.55) 7.31 (4.99–10.71) 5.51 (3.59–8.45) Sociodemographic factors
Maternal age, y
⬍30 1.00 1.00
30–35 1.00 (0.75–1.32) 1.04 (0.78–1.38)
ⱖ35 1.46 (1.00–2.15) 1.56 (1.06–2.32)
Single parenting
No 1.00 1.00
Yes 0.91 (0.58–1.43) 0.89 (0.55–1.45)
Parity
Primiparae 1.00 1.00
Multiparae 0.63 (0.49–0.82) 0.58 (0.44–0.77)
Job status
Not employed 1.00 1.00
Employed 0.73 (0.50–1.06) 0.74 (0.50–1.09)
Missing 0.57 (0.38–0.84) 0.55 (0.37–0.82)
Lifestyle-related factors Prepregnant BMI
Normal weight 1.00 1.00
Overweight 0.86 (0.61–1.21) 0.91 (0.64–1.29)
Obese 0.46 (0.31–0.70) 0.50 (0.33–0.77)
Missing 0.91 (0.63–1.32) 0.81 (0.53–1.26)
Smoking
Nonsmoking 1.00 1.00
Smoking in pregnancy 0.47 (0.33–0.66) 0.45 (0.31–0.64)
Missing 0.62 (0.44–0.87) 0.52 (0.36–0.75)
Psychosocial factors Planned pregnancy
Planned 1.00 1.00
Unplanned 1.03 (0.76–1.41) 1.03 (0.73–1.44)
Missing 1.08 (0.60–1.94) 1.51 (0.73–3.12)
Prenatal stress (FAD)c
No 1.00 1.00
Yes 0.87 (0.61–1.23) 1.67 (0.87–3.20)
Missing 0.51 (0.37–0.70) 1.66 (1.05–2.64)
Birth characteristics Gestational age, wk
ⱖ37 1.00 1.00
⬍37 1.07 (0.55–2.09) 0.97 (0.50–1.90)
Birth weight, g
ⱖ2500 1.00 1.00
⬍2500 0.68 (0.35–1.30) 0.74 (0.38–1.44)
Cesarean delivery
No 1.00 1.00
Yes 0.79 (0.55–1.13) 0.78 (0.54–1.13)
Missing 0.73 (0.47–1.15) 0.71 (0.44–1.13)
Place and type of delivery
Home 1.00 1.00
Hospital, low risk 0.49 (0.32–0.75) 0.45 (0.29–0.69)
Hospital, high risk 0.75 (0.51–1.11) 0.67 (0.45–1.00)
aValues shown are ORs (95% CIs). Model 1: basic model
⫽association between educational level and breastfeeding; model 2: basic model⫹sociodemographic factors simultaneously; model 3: basic model⫹lifestyle-related factors simultaneously; model 4: basic model⫹psychosocial factors simultaneously; model 5: basic model⫹birth characteristics simultaneously; model 6: basic model⫹models 2, 3, 4, and 5.
bScale: 1⫽lowest, 4⫽highest. cYes indicates a score of
TABLE 3 Logistic Regression for Continuing Breastfeeding Until Baby Is Aged 2 Months (Nⴝ2596)
Model 1a Model 2a Model 3a Model 4a Model 5a Model 6a
Mothers’ educational levelb
1 (Reference) 1.00 1.00 1.00 1.00 1.00 1.00
2 2.11 (1.57–2.84) 2.16 (1.60–2.92) 1.84 (1.35–2.49) 2.12 (1.58–2.85) 2.07 (1.54–2.80) 1.84 (1.34–2.52) 3 3.82 (2.83–5.15) 3.85 (2.81–5.26) 3.01 (2.20–4.12) 3.87 (2.86–5.24) 3.68 (2.71–4.98) 2.94 (2.11–4.10) 4 6.36 (4.71–8.60) 6.33 (4.59–8.73) 4.81 (3.49–6.62) 6.44 (4.75–8.74) 6.14 (4.52–8.33) 4.70 (3.33–6.64) Sociodemographic factors
Maternal age, y
⬍30 1.00 1.00
30–35 1.19 (0.96–1.47) 1.26 (1.01–1.57)
ⱖ35 1.72 (1.29–2.28) 1.85 (1.38–2.49)
Single parenting
No 1.00 1.00
Yes 0.93 (0.64–1.36) 0.94 (0.63–1.41)
Parity
Primiparae 1.00 1.00
Multiparae 1.05 (0.85–1.30) 0.96 (0.77–1.21)
Job status
Not employed 1.00 1.00
Employed 0.79 (0.59–1.05) 0.78 (0.58–1.04)
Missing 0.90 (0.66–1.24) 0.95 (0.68–1.31)
Lifestyle-related factors Prepregnant BMI
Normal weight 1.00 1.00
Overweight 0.64 (0.49–0.82) 0.66 (0.51–0.86)
Obese 0.37 (0.25–0.55) 0.39 (0.26–0.58)
Missing 0.86 (0.64–1.14) 0.87 (0.62–1.23)
Smoking
Nonsmoking 1.00 1.00
Smoking in pregnancy 0.52 (0.37–0.74) 0.47 (0.33–0.67)
Missing 0.57 (0.12–2.71) 0.55 (0.11–2.69)
Alcohol use
No alcohol use 1.00 1.00
Alcohol use 1.12 (0.88–1.42) 1.01 (0.79–1.28)
Missing 2.14 (0.44–10.30) 1.94 (0.38–9.78)
Psychosocial factors Planned pregnancy
Planned 1.00 1.00
Unplanned 1.03 (0.80–1.32) 0.97 (0.74–1.28)
Missing 1.15 (0.73–1.80) 1.07 (0.61–1.89)
Postnatal stress (MABS)c
No 1.00 1.00
Yes 0.85 (0.66–1.09) 0.82 (0.63–1.06)
Missing 1.24 (0.92–1.68) 1.26 (0.92–1.72)
Birth characteristics Gestational age, wk
ⱖ37 1.00 1.00
⬍37 1.07 (0.63–1.83) 1.13 (0.66–1.93)
Birth weight, g
ⱖ2500 1.00 1.00
⬍2500 1.06 (0.60–1.88) 1.00 (0.56–1.79)
Cesarean delivery
No 1.00 1.00
Yes 0.72 (0.55–0.94) 0.71 (0.54–0.94)
Missing 1.57 (1.02–2.42) 1.44 (0.92–2.23)
Place and type of delivery
Home 1.00 1.00
Hospital, low-risk 0.72 (0.52–1.01) 0.71 (0.50–0.99)
Hospital, high-risk 0.63 (0.48–0.82) 0.62 (0.47–0.82)
aValues shown are ORs (95% CIs). Model 1: basic model
⫽association between educational level and breastfeeding; model 2: basic model⫹sociodemographic factors simultaneously; model 3: basic model⫹lifestyle-related factors simultaneously; model 4: basic model⫹psychosocial factors simultaneously; model 5: basic model⫹birth characteristics simultaneously; model 6: basic model⫹models 2, 3, 4, and 5.
bScale: 1⫽lowest, 4⫽highest. cSubscale
does not fully explain the association we found between smoking and starting breastfeeding. Literature describes that smokers also have a lower intention to breastfeed.47
This suggests that smoking in our study may be a proxy for other more motivational factors rather than for chemical factors.
The Role of Place and Type of Delivery
Relative to those who had delivered at home, fewer women who delivered in the hospital started breastfeed-ing. More research is needed to elucidate this findbreastfeed-ing. But, in any case, hospitals should give optimal guidance to mothers on breastfeeding.
The Role of Motivational Determinants of Breastfeeding We had no information on the motivational determi-nants of breastfeeding. From the literature, it is known that breastfeeding behavior can be predicted by atti-tudes, perceived control, and social support, including social norms, peer influence, and intergenerational fac-tors (elements of the theory of planned behavior).50–52
The effects of smoking behavior and maternal obesity on the association between educational level and breast-feeding may be partly explained by motivational fac-tors.53
CONCLUSIONS
Compared with their less-educated counterparts, more mothers with a higher level of education started breast-feeding and more continued for the first 2 months after birth. Because breastfeeding benefits health both in childhood and adulthood, increasing breastfeeding by less-educated mothers would help reduce socially based health inequalities, potentially achieving a broad public health impact.
However, more research is needed on obesity and smoking behavior and their association with motiva-tional factors that underlie social inequalities in breast-feeding.
ACKNOWLEDGMENTS
This study was supported by grant 7110.0002 from the Netherlands Organization for Health Research and De-velopment (ZonMW).
We acknowledge the contribution of participating mothers, general practitioners, hospitals, and midwives in Rotterdam.
REFERENCES
1. Duncan B, Ey J, Holberg CJ, Wright AL, Martinez FD, Taussig LM. Exclusive breast-feeding for at least 4 months protects against otitis media.Pediatrics.1993;91(5):867– 872
2. Howie PW, Forsyth JS, Ogston SA, Clark A, Florey CD. Protec-tive effect of breast feeding against infection. BMJ. 1990; 300(6716):11–16
3. Wright AL, Holberg CJ, Martinez FD, Morgan WJ, Taussig LM. Breast feeding and lower respiratory tract illness in the first year of life. Group Health Medical Associates. BMJ. 1989; 299(6705):946 –949
4. Owen CG, Martin RM, Whincup PH, Smith GD, Cook DG. Effect of infant feeding on the risk of obesity across the life
course: a quantitative review of published evidence.Pediatrics. 2005;115(5):1367–1377
5. Owen CG, Martin RM, Whincup PH, Smith GD, Cook DG. Does breastfeeding influence risk of type 2 diabetes in later life? A quantitative analysis of published evidence. Am J Clin Nutr. 2006;84(5):1043–1054
6. World Health Organization, United Nations Children’s Fund. Global strategy for infant and young child feeding. Available at: www.paho.org/english/ad/fch/ca/GSIYCF㛭infantfeeding㛭eng.pdf. Accessed March 24, 2009
7. Dubois L, Girard M. Social inequalities in infant feeding during the first year of life. The Longitudinal Study of Child Develop-ment in Quebec (LSCDQ 1998 –2002).Public Health Nutr.2003; 6(8):773–783
8. Glenn LL, Quillin SI. Opposing effects of maternal and paternal socioeconomic status on neonatal feeding method, place of sleep, and maternal sleep time.J Perinat Neonatal Nurs.2007; 21(2):165–172
9. Kelly YJ, Watt RG. Breast-feeding initiation and exclusive du-ration at 6 months by social class—results from the Millennium Cohort Study.Public Health Nutr.2005;8(4):417– 421 10. Celi AC, Rich-Edwards JW, Richardson MK, Kleinman KP,
Gillman MW. Immigration, race/ethnicity, and social and eco-nomic factors as predictors of breastfeeding initiation. Arch Pediatr Adolesc Med.2005;159(3):255–260
11. Heck KE, Braveman P, Cubbin C, Chavez GF, Kiely JL. Socio-economic status and breastfeeding initiation among California mothers.Public Health Rep.2006;121(1):51–59
12. Callen J, Pinelli J. Incidence and duration of breastfeeding for term infants in Canada, United States, Europe, and Australia: a literature review.Birth.2004;31(4):285–292
13. Grjibovski AM, Yngve A, Bygren LO, Sjostrom M. Socio-demographic determinants of initiation and duration of breast-feeding in northwest Russia.Acta Paediatr.2005;94(5):588 –594 14. Hendricks K, Briefel R, Novak T, Ziegler P. Maternal and child characteristics associated with infant and toddler feeding prac-tices.J Am Diet Assoc.2006;106(1 suppl 1):S135–S148 15. Kohlhuber M, Rebhan B, Schwegler U, Koletzko B, Fromme H.
Breastfeeding rates and duration in Germany: a Bavarian co-hort study.Br J Nutr.2008;99(5):1127–1132
16. Lanting CI, Van Wouwe JP, Reijneveld SA. Infant milk feeding practices in the Netherlands and associated factors.Acta Paedi-atr.2005;94(7):935–942
17. Scott JA, Binns CW. Factors associated with the initiation and duration of breastfeeding: a review of the literature.Breastfeed Rev.1999;7(1):5–16
18. Giglia RC, Binns CW, Alfonso HS, Scott JA, Oddy WH. The effect of alcohol intake on breastfeeding duration in Australian women.Acta Paediatr.2008;97(5):624 – 629
19. Braveman PA, Cubbin C, Egerter S, et al. Socioeconomic status in health research: one size does not fit all. JAMA. 2005; 294(22):2879 –2888
20. Galobardes B, Shaw M, Lawlor DA, Lynch JW, Davey Smith G. Indicators of socioeconomic position (part 1).J Epidemiol Com-munity Health.2006;60(1):7–12
21. Griffiths LJ, Tate AR, Dezateux C; Millennium Cohort Study Child Health Group. Do early infant feeding practices vary by maternal ethnic group?Public Health Nutr.2007;10(9):957–964 22. Kelly YJ, Watt RG, Nazroo JY. Racial/ethnic differences in breastfeeding initiation and continuation in the United King-dom and comparison with findings in the United States. Pedi-atrics. 2006;118(5). Available at: www.pediatrics.org/cgi/ content/full/118/5/e1428
24. Gibson-Davis CM, Brooks-Gunn J. Couples’ immigration sta-tus and ethnicity as determinants of breastfeeding.Am J Public Health.2006;96(4):641– 646
25. Li R, Grummer-Strawn L. Racial and ethnic disparities in breastfeeding among United States infants: Third National Health and Nutrition Examination Survey, 1988 –1994.Birth. 2002;29(4):251–257
26. Jaddoe VW, Mackenbach JP, Moll HA, et al. The Generation R Study: design and cohort profile.Eur J Epidemiol.2006;21(6): 475– 484
27. Swertz O, Duimelaar P, Thijssen J. Statistics Netherlands. Mi-grants in the Netherlands 2004. Voorburg/Heerlen, Netherlands: Statistics Netherlands; 2004
28. Statistics Netherlands.Dutch Standard Classification of Education 2003. Voorburg/Heerlen, Netherlands: Statistics Netherlands; 2004
29. Merten S, Ackermann-Liebrich U. Exclusive breastfeeding rates and associated factors in Swiss baby-friendly hospitals.J Hum Lact.2004;20(1):9 –17
30. Byles JBC, Boyle MH, Offord DR. Ontario Child Health Study: reliability and validity of the general functioning subscale of the McMaster Family Assessment Device.Fam Process.1988; 27(1):97–104
31. St James-Roberts I, Wolke D. Differences between maternal and objective ratings of difficult neonatal behavioural style: implications for temperament research and clinical perspective. J Reprod Infant Psychol.1983;1(2):53– 60
32. St James-Roberts I, Wolke D. Convergences and discrepancies among mothers’ and professionals’ assessments of difficult neo-natal behaviour.J Child Psychol Psychiatry.1988;29(1):21– 42 33. Physical status: the use and interpretation of anthropometry—
report of a WHO Expert Committee.World Health Organ Tech Rep Ser.1995;854:1– 452
34. Harrell FHFE. Regression Modeling Strategies. New York, NY: Springer-Verlag Telos; 2002
35. Lynch J, Kaplan GA. Socioeconomic position. In: Berkman LF, Kawachi I, eds.Social Epidemiology. Oxford, United Kingdom: Oxford University Press; 2000:13–35
36. Li R, Scanlon KS, Serdula MK. The validity and reliability of maternal recall of breastfeeding practice.Nutr Rev.2005;63(4): 103–110
37. Willemsen M, van Leent-Loenen H. The National Public Health Compass. Hoeveel mensen roken? (How many people smoke?) Nationaal Kompas Volksgezondheid. 3.16 ed. Bilthoven, Nether-lands In: Available at: http://www.nationaalkompas.nl. Ac-cessed April 5, 2009
38. Kramer MS, Kakuma R. Optimal duration of exclusive breast-feeding.Cochrane Database Syst Rev.2002;(1):CD003517
39. Ip S, Chung M, Raman G, et al. Breastfeeding and maternal and infant health outcomes in developed countries.Evid Rep Technol Assess (Full Rep).2007;(153):1–186
40. Dyson L, McCormick F, Renfrew MJ. Interventions for pro-moting the initiation of breastfeeding.Cochrane Database Syst Rev.2005;(2):CD001688
41. Ryan AS, Wenjun Z, Acosta A. Breastfeeding continues to increase into the new millennium. Pediatrics. 2002;110(6): 1103–1109
42. Scott JA, Binns CW, Graham KI, Oddy WH. Temporal changes in the determinants of breastfeeding initiation. Birth. 2006; 33(1):37– 45
43. Baron RM, Kenny DA. The moderator-mediator variable dis-tinction in social psychological research: conceptual, strategic, and statistical considerations. J Pers Soc Psychol. 1986;51(6): 1173–1182
44. Amir LH, Donath S. A systematic review of maternal obesity and breastfeeding intention, initiation and duration.BMC Preg-nancy Childbirth.2007;7:9
45. Rasmussen KM, Kjolhede CL. Prepregnant overweight and obesity diminish the prolactin response to suckling in the first week postpartum. Pediatrics. 2004;113(5). Available at: www.pediatrics.org/cgi/content/full/113/5/e465
46. Mennella JA, Yourshaw LM, Morgan LK. Breastfeeding and smoking: short-term effects on infant feeding and sleep. Pedi-atrics.2007;120(3):497–502
47. Donath SM, Amir LH. The relationship between maternal smoking and breastfeeding duration after adjustment for ma-ternal infant feeding intention. Acta Paediatr. 2004;93(11): 1514 –1518
48. Dorea JG. Maternal smoking and infant feeding: breastfeeding is better and safer.Matern Child Health J.2007;11(3):287–291 49. Amir LH. Maternal smoking and reduced duration of breastfeeding: a review of possible mechanisms.Early Hum Dev. 2001;64(1):45– 67
50. Avery M, Duckett L, Dodgson J, Savik K, Henly SJ. Factors associated with very early weaning among primiparas intend-ing to breastfeed.Matern Child Health J.1998;2(3):167–179 51. Hoddinott P, Pill R. Qualitative study of decisions about infant
feeding among women in east end of London. BMJ. 1999; 318(7175):30 –34
52. Swanson V, Power KG. Initiation and continuation of breastfeeding: theory of planned behaviour.J Adv Nurs.2005; 50(3):272–282
APPENDIX 1 Dutch Educational System and Categories Used in This Study
APPENDIX 2 Breastfeeding Questions Used to Define Starting Breastfeeding, Breastfeeding Continuation for 2 Months, and Breastfeeding Continuation Between 2 and 6 Months
2-months questionnaire part 1 (child):
1. How many weeks in total did you breast-feed your child up until now? (also in addition to the bottle)
□ Weeks
2. In what way do you feed your child at the moment? (one answer only)
▫ Breast feeding only ▫ Bottle feeding only
▫ As much breast as bottle feeding ▫ More than half breast feeding ▫ More than half bottle feeding
2-months questionnaire part 2 (mother):
1. Have you ever breastfed your child? (this refers to the child participating in this survey)
▫ No
▫ Yes
APPENDIX 2 Continued 6-months questionnaire:
1. Have you ever breastfed your child?
▫ No
▫ Yes
2. How many months of age was your child when you stopped breastfeeding? (only give one answer) ▫ I am still breastfeeding
▫ Younger than 1 month ▫ Between 1 and 2 months ▫ Between 2 and 3 months ▫ Between 3 and 4 months ▫ Older than 4 months
3. How often do you breastfeed your child at the moment? (only give one answer)
APPENDIX 2 Continued 12-months questionnaire:
1. Have you breast-fed your child in the last 6 months? ▫ No, proceed to A4
▫ Yes
2. How often do you breast-fed your child at the moment. (one answer only)
▫ I no longer breast-feed my child ▫ 1 to 2 times a day, go to A4 ▫ 2 to 3 times a day, go to A4 ▫ 3 times or more a day, go to A4
3. How many months old was your child when you completely stopped breast-feeding it? (one answer only) ▫ Between 6 and 7 months
▫ Between 8 and 9 months ▫ Between 10 and 11 months ▫ Older than 11 months
APPENDIX 3 Percentages of Mothers Starting Breastfeeding (Nⴝ2914), Continuing Breastfeeding Until Baby Is Aged 2 Months (Nⴝ2596), and Continuing Breastfeeding Between Baby’s Age of 2 and 6 Months (Nⴝ1923), Within Categories for Each Covariate
30–35 89.9 76.2 46.0
ⱖ35 91.9 80.9 52.9
Pa ⬍.001 ⬍.001 ⬍.05
Single parenting
No 89.4 74.5 46.3
Yes 84.2 67.1 60.0
P ⬍.05 ⬍.05 ⬍.01
Parity
Primiparae 90.6 73.1 44.5
Multiparae 86.1 76.1 52.1
P ⬍.001 .11 ⬍.01
Prepregnant BMI (kg/m2)
⬍25 90.8 77.4 47.1
25–30 87.4 66.1 48.3
ⱖ30 74.1 47.9 50.0
Missing 88.2 74.1 44.6
P ⬍.001 ⬍.001 .81
Continued smoking in pregnancy
No 91.2 75.5 46.3
Yes 73.3 50.9 45.5
Missing 85.9 77.3 51.8
P ⬍.001 ⬍.001 .26
Alcohol use in pregnancy
Yes 93.3 78.2 43.7
No 88.4 72.0 47.2
Missing 85.4 77.7 52.2
P ⬍.001 ⬍.01 .10
Yes 89.7 74.8 46.8
No 85.6 69.3 50.6
Missing 90.0 76.5 41.0
P ⬍.05 .06 .22
Prenatal stress (FAD)b
Yes 88.5 — —
No 88.9 — —
Missing 91.2 — —
P .47 — —
Postnatal stress (MABS)c
Yes — 72.9 38.7
No — 73.8 47.6
Missing — 77.3 54.4
P — .35 ⬍.01
Job status after delivery
Employed 90.8 74.7 44.9
Not employed 88.6 70.9 60.6
Missing 85.2 74.2 45.6
P ⬍.001 .35 ⬍.001
Yes 87.0 65.1 40.4
No 89.7 74.5 47.3
Missing 86.4 84.3 53.4
P .12 ⬍.001 ⬍.05
Place and type of delivery
Home 93.3 83.3 51.8
Hospital, low- risk 83.7 74.9 43.9
Hospital, high-risk 89.1 70.8 45.9
P ⬍.001 ⬍.001 ⬍.05
aPvalues are for2tests.
bYes indicates a score of⬎2.17 (clinical cutoff score). cSubscale
DOI: 10.1542/peds.2008-2663
2009;123;e1017-e1027
Pediatrics
V. Jaddoe, Albert Hofman, Johan P. Mackenbach and Hein Raat
Lenie van Rossem, Anke Oenema, Eric A. P. Steegers, Henriëtte A. Moll, Vincent W.
The Generation R Study
Are Starting and Continuing Breastfeeding Related to Educational Background?
& Services
Updated Information
http://www.pediatrics.org/cgi/content/full/123/6/e1017
including high-resolution figures, can be found at:
References
http://www.pediatrics.org/cgi/content/full/123/6/e1017#BIBL
at:
This article cites 42 articles, 14 of which you can access for free
Subspecialty Collections
m
http://www.pediatrics.org/cgi/collection/nutrition_and_metabolis
Nutrition & Metabolism following collection(s):
This article, along with others on similar topics, appears in the
Permissions & Licensing
http://www.pediatrics.org/misc/Permissions.shtml
tables) or in its entirety can be found online at:
Information about reproducing this article in parts (figures,
Reprints
http://www.pediatrics.org/misc/reprints.shtml