USER EXPERIENCE ANALYSIS OF AN E-COMMERCE WEBSITE USING
USER EXPERIENCE QUESTIONNAIRE (UEQ) FRAMEWORK
Kevin Andika Lukita1), Maulahikmah Galinium2), James Purnama3) Department of Information Technology, Faculty of Engineering and Information
Technology Swiss German University
E-mail: {kevin.lukita[at]student, maulahikmah.galinium[at], james.purnama[at]} sgu.ac.id
Abstract
The purpose of this study is to find the attribute of the Nappa Milano online store that needs improvement the most based on the result of the user experience (UX) evaluation of the customers of Nappa Milano online store. Nappa Milano is a brand of male footwear that has been since 2013. This study uses the UEQ framework to conduct the UX evaluation. There are several attribute a website has which is the attractiveness, perspicuity, efficiency, dependability, stimulation, and Novelty. The result indicates that the Perspicuity attribute is the attribute that receives the most positive evaluation because it receives the score of 2.048 from the scale which ranges from -3 to 3. On the other hand, the novelty attribute is the attribute of the Nappa Milano online store that needs most improvement because it receives the most negative evaluation because it receives the score of 0.157 from the scale which ranges from -3 to 3.
Keywords:User Experience Analysis, User Experience Questionnaire, Nappa Milano
Introduction
Nowadays, internet grows very fast to the point that people may purchase items without getting up from their beds or riding a vehicle to the physical store. E-Commerce helps people to buy and sell via internet. The user experience (UX) is important for the e-commerce to gain customers. It is better and less expensive when customers can quickly find information on an e-commerce website rather than contact the company for assistance. Customers expect to find relevant information at the right place and fast.UX has been widely accepted in Human-Computer Interaction (HCI), but there is no clear definition to it. The interest in UX may be caused by the fact that HCI researchers and practitioners have become well aware of the limitations of the traditional usability framework, which focuses primarily on user cognition and user performance in human-technology interactions while UX highlights aspects such as interactions, shifting the focus to user affect, sensation, and the meaning as well as value of such interactions (Vermeeren et.al., 2009).
Literature Review
A research was conducted on the E-Learning website of Konkuk University’s Seoul Campus. This study proposed an integrated theoretical framework of university students’ e-learning acceptance and intention to use based mainly on the technology acceptance model (TAM). One interesting results of the study is that both e-learning self-efficacy and subjective norm play an important role in affecting attitude towards e-learning and behavioral intention to use e-learning. The study demonstrated that some TAM constructs had a direct and indirect effect on university students’ behavioral intention to use e-learning (Youl, 2009).Another UX research was conducted on PulevaSaud.com website, which is a website offering free information on health, nutrition and general well-being. The research was using the web acceptance model (WAM). The explained almost 70% of the variance of the user’s intention to visit irrespective of the moderator and its level. This underscored the need for including the UX in the explanation of website use (Leiva & Martinez, 2007).
Rauschenberger et.al. (2006) conducted a research on how to do an efficient measurement of a website UX. This research described the construction, the result analyzing and the validation studies of the User Experience Questionnaire (UEQ) framework. This framework allows a fast evaluation of the UX of interactive products. It measures not only pragmatic aspects like efficiency, perspicuity and dependability, but also hedonic aspects like stimulation or originality.Santoso et.al. (2016) conducted a research on the E-Learning website of the University of Indonesia (UI). The results of the research revealed that, while the scores for all scales describing a pragmatic quality aspect were good, the scales describing hedonic quality showed neutral evaluations. The findings were also supported by students’ answers to open-ended questions. Moreover, the measurement results provide additional insights into future development of the E-learning management system of the University of Indonesia. This research also reveals the UEQ framework is capable of measuring both the pragmatic and hedonic quality aspect of a website.
Both TAM and UEQ frameworks measure the ease-of-use of the interactive product. Ease-of-use in UEQ is called perspicuity. The TAM framework has a strength in determining the user behavior based on the perceived ease-of-use and perceived usefulness. The WAM framework also measure the ease-of-use of the interactive product which is linked to the experience of the respondents in using the internet and website to determine the respondent’s future intention to visit. The weakness of both the TAM and WAM frameworks is the frameworks are not capable of measuring the general impression of the website and they don’t measure any hedonic quality of a website. On the other hand, the UEQ is not capable to measure the user behavior and future intention to visit because it is a framework that is designed to measure UX. The UEQ framework was chosen in this research because by the UEQ framework is capable of measuring the general impression of a product and the hedonic quality such as the joy-of-use and the creativity of a product.
Methodology
Figure 1. Overall Research Methodology
A. Designing the questionnaire
The questionnaire is developed based on the items in each categoryof the UEQ framework. The questionnaire is designed and distributed to the respondents using online form. The questionnaire is distributed only to the e-mails which has an account registered in the online shop of Nappa Milano. The questionnaire for the survey is designed and a pilot study which consists of a validity and reliability testing is conducted. The number of respondents also is defined in this step.
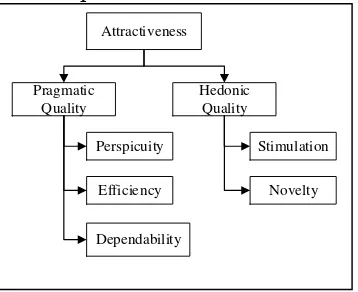
Figure 2. UEQ framework (Rauschenberger et.al, 2006)
The questionnaire is divided into three parts. Part 1 is the respondent profile and their experiences using e-commerce websites, the 2ndpart is the main questionnaires about the target website, and in the 3rdpart, the respondents is asked to leave their comments.The questionnaire is using the 7-scale Likert scale based on the level of agreement. The questions are based on the items of the scales of the UEQ framework, which contains 6 categories with 26 items in total.The sample is the users of Nappa Milano online shop who has an account registered. In determining sample size, the slovin’s formula was chosen. The population size or the number of users which registered in the Nappa Milano website is 134 users. With margin of error is 5%. Calculated using the Slovin’s formula, the minimum sample size is 101 users. The gained sample for this research is 115 users (Israel, 1992).
Pilot study is conducted before the questionnaire is distributed to prevent any failures in the actual study. A questionnaire pilot study should consist of validity and reliability testing. The main points which can be done to prevent any failure from the actual study are as follows (Simon, 2011):
1. Check whether the research protocols might not be followed or whether the proposed methods are inappropriate.
2. Check the questionnaires wording and sentences 3. Check the reliability of the questionnaire
4. Check the validity of the questionnaire
Attractiveness
Pragmatic Quality
Hedonic Quality
Perspicuity
Efficiency
Stimulation
Novelty
Dependability
Research Framework
Create
Questionnaire Pilot Study
Data Gathering Data Extraction
Data Analysis
The participants of pilot study also may be included in the actual study because the participants of the pilot study are also the users who have registered an account into the target website.The validity testing was conducted using the method Pearson’s Product Moment Correlation Formula. Pearson’s product moment correlation is used to compute the correlation between two interval or ration variable, the positive coefficient shows that the two variables systematically vary in the same direction, and the negative coefficient indicates the two variables systematically vary in opposite directions (Yount, 2006).The reliability testing was conducted using the Cronbach’s Alpha formula. The Cronbach’s Alpha formula is the most frequently used when using the Likert-type scales, it is imperative to calculate and report the Cronbach’s Alpha coefficient for internal consistency reliability for any scales or subscales one may be using (Vermeeren et.al., 2009).
B. Data Gathering
The questionnaire was distributed in an online form of Google forms to the emails of the users which are used registered in the website. The questionnaire were open from May 1st 2016 until June 8th 2016. The answers of the questionnaire are saved in a document consisting of every answer of the respondents.
C. Data Set Extraction
This process consists of importing the data from the online form into Microsoft Excel and conduct the data filtering and data coding.Data filtering is the activity where the data from the survey will be filtered and decided whether the data is valid or invalid. The filtering steps are as follow:
Check whether or not there is any usernames that was put in more than once. If there is a username that was put in more than once, only one data will be valid, the other one won’t be valid.
Check whether or not there are inconsistent answers. For example, in the question where the respondent was asked whether or not he or she has accessed an online store, if he or she answered “no” but filled the next question anyway, which is “if YES, what is the online store you most frequently visit”, then the data will be invalid.
Data coding will process the data from the questionnaire. The scores from the negative statement from the questionnaire will be inversed. If the score answered by the respondent is 7, the answer will be written as 1, if the score answered by the respondent is 5, the answer will be written as 3.
D. Data Analysis
The answers from the participants are scaled from -3 to +3. If a participant selects number 1 on the likert scale of a question in the questionnaire, the said question will be given score -3, on the other hand if he or she answers 7, the said question will be given score 3. The total score of a question will be used to calculate the mean score of one question.The mean score of an attribute will be calculated based on the mean all questions in which comes from the particular attribute. The mean of the scores will then be used to calculate the score of the attribute by calculating the average of the score means.
E. Lists of Recommendation
A recommendation is created based on the result of the analysis. Mini Group Discussion is conducted to discuss the list of recommendations.
Result and Discussion
A. Validity and Reliability Test
Table 1 shows the results of the validity and reliability tests on both the pilot study and the actual study. All the results for the validity testing are above 0.374. In that case, the questionnaire can be defined as valid. And for the reliability, the questions from each categories will be considered as reliable if the score is above 0,6.All the results of the reliability testing are above 0,6. In this case, all the values are above 0,6. In conclusion, all the questionnaires for each categories are reliable.
Table 1. Validity and Reliability Results
Question
B. Respondent demographic profile and preferred e-commerce sites
Binneka.com. and 2% chose Bukalapak.All of the respondents browsed the online store of Nappa Milano web-based, and none of the respondents browsed the store mobile-based and mostly have conducted a transaction at the Nappa Milano online store with 74 respondents, while the other 41 respondents have not conducted any transactions in the Nappa Milano online store.
C. UEQ Analysis Result
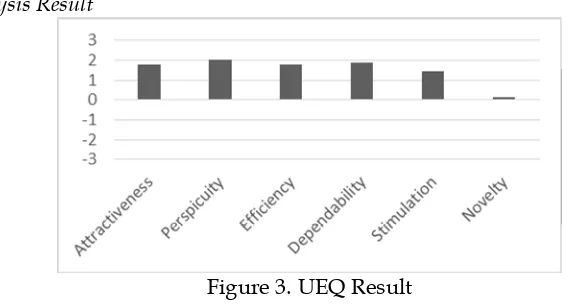
Figure 3. UEQ Result
As seen on figure 3, theattractivenesscategory receives the score of 1.775, which lies in the zone of positive evaluation score which range from 0.8 to the maximum score of 3. It means that the respondents liked the way the Nappa Milano online shop was designed.The perspicuity category receives the score of 2.048, once again, receiving a positive evaluation. The perspicuity category receives the best result of any other category. It means that the respondents find the Nappa Milano online shop is easy to get familiar. The efficiency category receives the score of 1.807, the score that makes the efficiency category of the Nappa Milano online shop receives a positive evaluation. It means that the respondents can solve their tasks with ease and no need of unnecessary effort.
The dependability category receives the score of 1.889, which lies in the positive evaluation zone. It means that the website buttons redirects the page to the right place, and the website does not redirecting to the other websites, making the users feels in control with the interaction.Thestimulation category receives the score of 1.461, which lies in the positive evaluation zone. It means that the users feels motivated to use the website.The
noveltycategory receives the score of 0.157, which lies in the zone of neutral evaluation which ranges from -0.8 to 0.8. The novelty category receives the worst result of all the other categories which means that the view of the online shop of Nappa Milano lacks of creativity.
D. Data Benchmarking
The UEQ provides a benchmarking tool which contains the data of 163 various product evaluations with the UEQ (with a total of 4818 participants in all evaluations). The benchmark classifies a product into 5 categories (Schrepp, 2010)
a. Excellent: In the range of the 10% best results.
b. Good: 10% of the results in the benchmark data set are better and 75% of the results are worse.
c. Above average: 25% of the results in the benchmark are better than the resultfor the evaluated product, 50% of the results are worse.
d. Below average: 50% of the results in the benchmark are better than the result for the evaluated product, 25% of the results are worse.
Figure 4.Nappa Milano UEQ benchmark result
As seen on figure 4, the Nappa Milano online store was categorized as ‘Excellent’ in the Attractiveness, Perspicuity, Efficiency, and Dependability category. This means that the Nappa Milano online store is in the range of 10% of the best results from the 163 previous product evaluations in terms of its Attractiveness, perspicuity, efficiency, and dependability. The Stimulation category was categorized as ‘Above Average’, which means that the user’s motivation to use Nappa Milano website is in the zone of 50% best results of the previous 163 product evaluations.The Novelty category was categorized as ‘Bad’, which means that the website’s creativity is in the range of the 25% worst results.
E. Mini Group Discussion Result
Table 2. Lists of Recommendation and Discussion Result
The first recommendation is to change the content of the slideshow in the first page. 3 out of 4 persons agreed because the slideshow only containing product images is quite annoying and according to them, it will be better if the slideshow content changes to any promotional offers or ongoing events. Therefore, the owner agrees to change the content of the slideshow into available promotions and ongoing events.The second recommendation is to zoom out the login and register page everybody agrees because it contains unnecessary blank spaces and doesn’t look neat. The owner agrees to zoom out the login register page.The third is to add dropdown into the “shop” button, in which 3 persons including the owner disagree because it destroys the structure of the buttons, one person recommends that instead of adding a dropdown, it can be done to change the button word into “products” instead. The owner decides to take the advice and change the button word into “products”.
The fourth is to add login and register button instead of “My account” button, which all the persons agreed because the “My Account” button is designed commonly for pages that have a user logged in. The owner states that the button was designed to limit the number of buttons in the header, but he agrees to change to a separate login and register
Recommendation A B C Owner Conclusion
Change the content of slideshow to
ongoing promotional or events Agree Disagree Agree Agree Agree
Zoom out the login and register page Agree Agree Agree Agree Agree
Add dropdown into the "shop" button Disagree Disagree Agree Disagree Disagree
Add login and register button instead of
“My Account” Agree Agree Agree Agree Agree
Change the background color Disagree Disagree Disagree Disagree Disagree
button.The fifth is to change the background color from white into any other color because most e-commerce website uses white as their background color. This recommendation is refused by every people involved in the discussion because according to them, white color is neutral and is the proper color for online shops.The sixth is to change the transaction flow of the website, which was refused by every people involved in the discussion because by doing so, it will only confuse the users, because most B2C e-commerce have a transaction flow that is the same with others.
Conclusion
The research is conducted to find the attribute of the online shop of Nappa Milano that needs improvement. The UEQ is used as the main framework and the result is obtained and analyzed using the UEQ framework.The result from the analysis of UX shows that the general impression from most users of the Nappa Milano online shop is receiving a positive evaluation. This is proved from the result of the attractiveness component in figure 4, the score for the attractiveness component receives more than 0.8, which means it is included in the positive evaluation zone.The attribute that receive the most positive impression from the users is the perspicuity attribute, which as proved in figure 4, receives a score of 2.048, which means that the users easily gets familiar with the Nappa Milano online shop.
The attribute that receive the most negative impression is the novelty attribute. It receives a score between -0.8 and 0.8, receiving a neutral evaluation from the users. This means that the Nappa Milano online shop lacks in creativity. The research objective is limited to the UX evaluation and provides recommendation to the owner to improve the UX of the website. The next research could be the modification and retesting the Nappa Milano online store to determine whether or not the UX of Nappa Milano online store is increased post-modification.
References
Israel G.D., "Determining Sample Size," University of Florida, 1992.
Leiva F.M. and Martinez T.L., "Web Acceptance Model (WAM): Moderating Effect of User Experience," University of Granada, Granada, 2007.
Rauschenberger M., Schrepp M., Cota M.P. and Thomachewski J., "Measurement of the User Experience of Interactive Products," International Journal of Artificial Intelligence and Interactive Multimedia,vol. 2, no. 1, 2006.
Santoso H., Isal R., Utomo A.Y. and Priyogi B., "Measuring User Experience of the Student-Centered e-Learning Environment,"The Journal of Educators Online,vol. 13, no. 1, 2016.
Schrepp M., "User Experience Questionnaire Handbook," Walldorf, 2010.
Simon M., "Assumptions, Limitations and Delimitations," Seattle, 2011.
Youl P.S., "An Analysis of the Technology Acceptance Model in Understanding University Students’ Behavioral Intention to Use e-Learning," Konkuk University, Seoul, 2009.