1
MARKETREAC TION ON EXEC UTI VE OPTI ON GR ANT IN THE EXISTENCE OF PERFORMANC E HURDLESYuniarti Hidayah Suyoso Putra
Fakultas Ekonomi Universitas Islam Negeri Maulana Malik Ibrahim Malang Jl. Gajayana No. 50, Telepon (0341) 558881, Fax. (0341) 558881,
Abstrak
Penelitian ini bertujuan untuk menginvestigasi reaksi pasar terhadap pengumuman opsi kepada eksekutif. Pasar bereaksi positif jika mengganggap pemberian opsi sebagai berita yang mengguntungkan karena pemberian opsi akan memotivasi eksekutif dalam memperjuangkan kepentingan pemegang saham dan bekerja lebih giat dalam meningatkan kinerja perusahaan. Reaksi negatif pasar menunjukkan bahwa pemberian opsi akan meningkatkan biaya agensi dan mengurangi kekayaan pemegang saham. Hasil penelitian menunjukkan bahwa pasar berekasi positif dan menganggap pengumuman pemberian opsi kepada eksekutif sebagai berita yang menguntungkan. Hasil penelitian juga menunjukkan ‘performance hurdle’ melekat pada sebagaian besar eksekutif opsi di Australia sehingga pasar yakin eksekutif tidak bisa menggunakan hak opsinya secara maksimal jika syarat kinerja belum terpenuhi.
Key Words: Opsi saham, Eksekutif, Reaksi Pasar, Performance Hurdles
The dramatic increase of the use of share option as a part of compensation
package to executive indicates it has become a popular means of compensating
employees. More than 50% of the S&P 500 firms granting executive with share
option by the end of 1990s in US. Meanwhile, in Australia, long-term incentives,
such as share options represent on average of 17 per cent of the total CEO’s
compensation at the 2005 Annual General Meetings (Buffini and Kitney, 2005).
About 40 out of the top 100 companies sought approval from shareholders to
issue options to executive directors as a component of long-term incentives
packages at the 2005 Annual General Meeting (Hooper, 2005). The reason is the
grant may be encouraged CEO to achieve good performance in the future.
However, share option grants to executive can be controversial.
Shareholders are concerned with the effectiveness of share options in aligning
manager-shareholders interest. Therefore, it is important to investigate how the
investigation will provide insights into the markets’ perception of the benefit of
option grants.
Noticeably, Australian studies of executive share option grants have
focused on firm-specific characteristics associated with the existence of executive
share option plans (e.g., Coulton and Taylor, 2002; Goodwin and Kent, 2004), the
appropriate model to value executive share option grants (e.g., Bergmann, 2003;
Cassano, 2003; Brown and Yew, 2002; Brown and Samson, 2003; Kerin, 2003; and
Clark 2004). Studies related to the alternative accounting treatment for executive
share option (e.g., Stoddart, 2001), and the disclosure of CEO compensation (e.g.
Chalmers and Koh, 2005). To my knowledge, no Australian study has
investigated the market reaction associated with the announcement of executive
share option grants.
This study investigates market reaction around the announcement of
executive option grants with performance hurdles to be satisfied as a pre
condition to vesting.
THE ROLE OF SHARE OPTION GRANT
Share option grants aimed to align executive and shareholders interests.
The grants will give the executive incentives to act in his best in achieving the
company’s performance. The inclusion of share options as a component of
compensation might retain potential executives. Hall and Murphy (2002)
underline the objectives of share options are to attract, retain, and motivate
executives and other employees. Share options help the company to attract high
skilled executives and relatively less-risk averse since these individuals naturally
will select the companies offering performance based compensations that have
potential benefits for them. Share options provide retention through a
combination of vesting provisions and long-term options and motivate the
executives in terms of providing a direct link between company’s performance
and executive wealth. Share options can used to reward past performance and
promote future performance.
Hutchinson (2003) investigates the association between firm risk,
Australian firms from 1998 to 1999 indicates that executives who have an
investment in the firm in form of share options rather than shares adopt high
risk-return projects and the strategy to increase firm’s value. The negative
relationship between risk and firm performance is weaker when executives hold
more share options than shares. The result indicates that share option can align
the interest between the agent and principal, reduce the agency costs, and
avoiding risk-averse behaviour.
MARKET REACTION TO OPTION GRANT
The Efficient Market Hypothesis (EMH) theory explains that market will
react to new unanticipated information. The reaction will reflect in price
movements and trading volume changes around the date and time of the
information release. If markets consider the new information as favourable news
and the information is unexpected, share prices and trading volumes will
increase. On the other hand, if the market believes that the information to be
unanticipated unfavourable news, a decrease in share prices and trading
volumes is expected.
The perception of favourable news and unfavourable news can relate to
the markets ability to obtain private information. If traders could not obtain
private information of a public announcement prior to the announcement, there
would be a temporarily high degree of trading volume and information
asymmetry, until traders incorporate the news during the trading process.
Furthermore, if it is assumed that traders could obtain private information, form
opinions, and trade before public announcement, then they will update their
expectation prior to the announcement (Nofsinger and Prucyik, 2003), consistent
with efficient market hypothesis that all information should be fully incorporated
in the share prices.
Finding from Morgan and Poulsen (2001) showed a positive reaction for
the compensation plan (including share option plans, restricted share plans,
performance plans) particularly targeting top executives, because it delivers
favourable signals of future performance. The positive reactions reveals new
increase and are willing to tie their compensation schemes to the company’s
performance.
Whilst, Brickley, Bhagat and Lease (1985) discovered a positive share
price reaction to the announcement of long-term managerial compensation
schemes proposed by the board of directors of the firms and presented to
shareholders for ratification. The two days cumulative abnormal return shows
that these managerial compensation schemes can increase shareholders wealth.
However, the results do not prohibit the possibility that a sharing of tax benefits
with managers in tax-motivated plans could derive the benefits to shareholders.
There is a possibility that the model specified incorrectly; hence, the positive
cumulative abnormal return might be due to the error in benchmark rather than
the favourable market reaction. The analysis of variance of this study shows that
there is also no difference in the market reaction across different types of
compensation plans (e.g. share options, performance plans, and restricted shares)
supporting the perception that different type of plans may be suitable in different
situations.
However, there is also negative market reaction related to options
proposals that have high potential dilution effect on shareholders wealth. Martin
and Thomas (2003) documented significant negative cumulative abnormal return
in three days around the announcement of executive share option plans only.
They also reported that the plans that include repricing provisions, permit the
executives to borrow money from the firm in order to exercise options or plans
that permit the issues of restricted shares do not experience significant negative
return, because it depended on the magnitude of voting against the plans with
these features.
Lie (2005) also found negative abnormal returns of –3% for 30 days before
the announcement of CEO grants. The negative abnormal return mostly occurred
10 days before the grant date for unscheduled CEO option grants. A positive
abnormal return of 2% occurred for the first 10 days after the announcement date
and almost another 2% for the next 20 days. Unscheduled share option grants
denote to the share options are not granted on the same date every year.
Therefore, the CEO might use their influence to set the grant date when the share
grants at the date when the share prices are particularly low, thus securing a
lower exercise price. The presence of abnormal return around the announcement
dates indicates that information currently incorporated in the share prices.
Hence, this situation might lead to the opportunistic behaviour from the
executives such as CEO to obtain future benefits by timing the release of the
news.
PERFORMANCE HURDLES
Despite of the benefit and market reaction to executive share options, a
controversial issue arises at annual general meetings is inadequacy of the
performance hurdles attached to the option grant. For example, the Australian
Shareholders Association (ASA) raised this issue at the Seven Network annual
general meeting and argued that the company set too low hurdles for the
executive option grant (Kavanagh, 2003). Setting of easily achievable hurdles
may influence to the dilution effect on shareholders wealth. Another case, the
board of the National Australia Bank criticized for the terms attached to CEO
option grants. The CEO of National Bank Australia was rewarded with 500,000
options that would vest after three year if the banks’ total shareholders return
(TSR) was between the top quartile in its peer group. Twenty five percent of
options would vest if the bank’s TSR were in third quartile. It means that CEO would be rewarded the grants for delivering a TSR, below the median of its peer
group (Kavanagh, 2001).
Colquhoun (2001) explains adequate performance hurdles attached to
options grants will encourage the executives to earn this compensa tion
component by considering the achievement of company’s objectives more
carefully. It also will increase investors’ confidence that this compensation
package is aligned with shareholders interests. Performance hurdles ensure the
shareholders that the CEO or other executives are only rewarded if they achieve
a good performance that has positive payoffs for shareholders. Well design
performance hurdles should ensure that the CEO would only receive the grants if
he or she performs better than the competitors (Lawson, 2004). For example, John
Fletcher-Coles Myers’ CEO and Myer boss Dawn Robertson got a pay cut in after
Mr Fletcher's total remuneration from $5.34 million in 2004 to $4.43 million and
Ms Robertson's total pay decreased from $3.3 million to $2.7 million (Leyden,
2005).
Performance hurdles can be market based on firm specific. Common
hurdles include Total Shareholder Return (TSR) as measurement function of
share-price growth plus dividend growth, Earning Per Share (EPS) growth,
Return on Investment (ROI), Return on Invested Capital (ROIC), increase in
revenue, and increase in net profit (Rappaport, 1999; Kavanagh, 2001, Ernst and
Young, 2003).
HYPHOTESIS DEVELOPMENT
The hypotheses are developed and predicted market reaction around the
announcement dates of executive option grants.
Alignment Hypothesis
The agency theory predicts that compensation schemes will be designed
to stimulate executive to make decisions consistent in increasing shareholders
wealth and reducing agency costs (Jensen and Murphy, 1990; Grinner, 1999). It is
expected that the granting of share options as a part of compensation packages
can reduce the agency cost resulting from agency problems, which exists in
manager-shareholders relationships and linking between the pay and the
company’s performance (Morgan and Poulsen, 2001).
The establishment of share options as the part of compensation might be
employed to retain potential executives. The achievement of performance target
and vesting periods created in the contract will restrict executive to exercise the
options and therefore it ensures his loyalty to the company (Goodwin and Kent,
2004). Market expects that granting options will encourage executive to act in
shareholders’ best interest, implying that the market believes such grants can
reduce the agency costs from improved incentives, signals favourable future
performance and shared taxation benefits (Brookfield and Ormrod, 2000). It
implies that granting executive options may give the incentives to take more risk
and can play an important role to reduce agency cost of equity.
Furthermore, the positive market reaction is likely to occur based on the
attempts to deliver a favourable news rather than unfavourable news (Yermack,
1997; Nofsinger and Prucyk, 2003). The investors are confidence that executives
who are being granted with such compensation packages are financially
motivated to increase shareholders wealth (Colquhoun, 2001; Thompson, 2002).
This confidence could be the key driver in increasing share price. Alternatively, if
market considers the announcement of executive option grants convey
unfavourable news negative abnormal returns are predicted. Thus, it has
likelihood to dilute shareholders wealth and cannot improve the company’s
performance.
The positive assumption is consistent with the purpose of why firms
decide to grant executive with share options. To test how market reacts to the
announcement of executive option grants, the following hypothesis is presented.
H1: Firms that announce executive option grants will experience positive
abnormal return around the announcement date.
The Performance Hurdles Hypothesis
Many remuneration consultants say that the size of options packages
should come second after consideration as to whether adequate performance
hurdles are attached to the options (Kavanagh, 2001). Rappaport (1999) states
that the concern associated with the dilution effect of shareholders wealth should
not focus on the number of options granted but rather on the number of options
that can be exercised in the absence of superior performance hurdles.
Adequate performance hurdles attached to options grants will encourage
the executives to earn this compensation component by considering the
achievement of company’s objectives more carefully (Colquhoun, 2001). It also will increase investors’ confidence that this compensation package is aligned
with shareholders interests. Performance hurdles ensure the shareholders that
the executives are only rewarded if they achieve a good performance that has
positive payoffs for shareholders or if he or she performs better than the
competitors (Lawson, 2004). For example, John Fletcher-Coles Myers’ CEO and
Myer boss Dawn Robertson got a pay cut in after failing to achieve key
remuneration from $5.34 million in 2004 to $4.43 million and Ms Robertson's total
pay decreased from $3.3 million to $2.7 million (Leyden, 2005).
Those arguments denote that the existence of performance hurdles is essential to
protect the shareholders wealth, ensure the achievement of company’s
performance, and reward the CEO appropriately based on his/her performance.
Therefore, the following hypothesis is proposed.
H2: The positive market reactions around the announcement of executive option
grants are more likely supported with the existence of performance hurdles
attached to the grants
RESEARCH DESIGN Data Description
This study investigates the market reaction to the announcement of
executive option grants during 1998 to 2004 in Australia. The disclosures of
executive and director compensations facilitate the availability of data to test the
market reaction to the announcement of executive share option grants. Data is
collected from four main databases: Aspect Fin Analysis, Connect 4, IRESS and
DataStream.
Sample Selection
An initial sample of firms granting share option grants exclusive to
executive for ASX 500 listed companies during 1998 to 2004 is obtained from
Aspect Fin Analysis database. During the process, trust companies were
removed from the sample since it is subject to different reporting requirements.
This process reduces the sample into 189 executive share option grants
announced by 130 companies. Then the final samples are segregated into
two-groups: pure executive option grants announcements (92 samples) and executive
option grants announced simultaneously with the increase in directors’ fees (38
samples). The primary focus of this study is pure executive option grants group.
However, investigating the market reaction of executive option grants with the
Furthermore, information disclosed in notice of annual general meeting,
director reports, notes of financial reports, appendix 3B and or ASX released
news are utilized to determine and verify the number of share option granted,
the exercise price, total number of Executive shares holding, and the existence of
performance hurdles.
Event Study Methodology
Event study methodology is used to examine the impact of executive
option grant announcements on the company’s share price.
Event Date
Event date explains the proxy of announcement date employed to
benchmark the market reaction. According to ASX listing rule 10.14, the
directors’ remuneration including executive option grant must be approved by shareholders at the annual general meeting. Based on this reason, the Annual
General Meeting date is selected as an event date.
Event Windows
Event windows section specifies the event parameters and market proxy,
abnormal return generation, actual return generation, and the market model
used in this study. This section aimed to indicate event parameters and highlight
the market proxy. In this study, the Australian All Ordinary Share Price Index is
used as the market proxy. The estimation period for this study commences 260
days prior the announcement date of executive option grants (that is the date of
annual general meeting) and ends 60 days after the announcement of executive
option grants. Meanwhile, the event window is focused on three days around the
announcement date (day –1 to day +1).
Abnormal Return Generation
Abnormal returns (actual returns minus expected returns) are calculated for a
specified period around the announcement dates to examine the impact of
executive option grant announcements. The abnormal return formula is given in
the model 1.
Where
AR = abnormal return for the event j on time t
Rjt = observed return for the event j on time t
E(Rjt)= expected return for event j on time t
Actual Return
Actual returns are calculated in continuous form based on daily share price
returns (Strong, 1992) using model 2:
Rjt = Ln (Pjt + D)/Pjt-1) (Model 2) Where
Rjt = actual return on share j on day t;
Pjt = price ofshare j on day t;
Pjt-1 = price of share j on day t-1;
Ln = natural logarithm operator;
D = dividends paid on the day t
The Market Model
The Market Model will be used in the analysis to calculate expected
return. General formula of the market model is as follows.
Rjt = j + j Rmt + jt (Model 3)
Where
Rjt = observed return for even j on time t
j = the constant (or intercept) of the model
j = the beta of security j
Rmt = observed return on market index on time t
jt = error term
Statistical Testing
The use of these two statistical tests improves the robustness of the study.
Parametric Test
The examination of statistical significance of abnormal returns requires
the calculation of a t-statistic. This parametric test assumes the normal
distribution of abnormal returns. However, even though the parametric test is
Standardised Cross Sectional T-test (SCST)
This study used standardized cross sectional t-test (SCST). This test
involves calculating average abnormal returns for event period and standardizes
it by standard error of the regression of the market model. SCST is used to
overcome the event-induced variances. Event induced variance occurs if the
variance is under estimated, the test statistic will lead to the rejection of null
hypothesis more frequently than it should, even when the average abnormal
performance is zero (Brown and Warner, 1985). The results employing
unadjusted abnormal returns and ordinary cross-sectional t-test will be subject to
the event-induced variance (Balachandran, Cadle, and Theobald, 1999). The
model to calculate SCST as follows:
ARt /SERR (AR) est (Model 4)
Where:
ARt = Abnormal returns generated from market model for
specified time period
SERR (AR) est = Standard error of the estimation period daily return
T-test for Difference Mean for Two Independent Samples
Parametric t-test is conducted to compare the means of two independent
samples. This test is under assumption that the sample is normally distributed.
Non-parametric test
Non-parametric test, Mann-Whitney test, is also conducted to compare
the median of two independent samples. The underlined assumption of this test
is that the two distributions have the same shape, although the shape does not
have to be normal.
RESULTS AND DISCUSSIONS
The results provide several importance findings that the existence of the
market reaction is indicated by the increase in share prices relative to the
announcement of pure executive option grants and the decrease in share price for
the announcement of executive option announced simultaneously with the
Market Reaction
Price changes represented by abnormal returns are the best indicator to
observe the market reaction around the announcement date of executive option
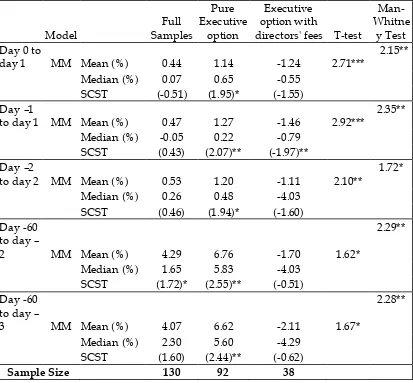
grants. Table 1 reports the abnormal return generated from the market model for
the full samples, pure executive option grants and executive options with
directors’ fees sample. This table provides the information related to the mean
and median of abnormal returns, and standardised cross-sectional t-test. The
average abnormal returns for 130 sample firms all are positive. Particularly for
pre announcement period (day-60 to –2), the average abnormal return is 4.29%
that statistically significant at the 10% level.
After splitting into two groups, the average abnormal return is 1.27% for
pure executive option, which is significant at the 5% level for three days event
window (from day –1 to day +1). The result provides evidence for hypothesis 1
that the market reacts positively to the announcement of executive option grants.
Positive reaction is represented with the increase in share price during the event
window that indicates that market perceives executive option grant
announcements deliver favourable news. The market believes option grants
motivate executive to increase the company’s performance, because executive has
incentives to work harder and will be rewarded for a good performance. As it is
suggested in agency theory, the compensation package including share options
should become an efficient tool to align executive-shareholders interest. Positive
reactions are also found in the event window of day –60 to day –2 (the average
mean is 6.76%) and day – 60 and day –3 (the average mean is 6.62%). Both results
are significant at the 5% levels.
In comparison, table 1 also reports negative market reaction for executive
options that announced simultaneously with the increase in directors’ fees. The
average abnormal return is –1.46% for executive options with the increase in
directors’ fees, which is significant at the 5% level for event window day –1 to day +1. The result gives the indication that market is sensitive with the
information considered as unfavourable news. The market negatively views the
increase in the directors’ fees since it will boost the fixed costs of the company
option grants as commensurate with performance and firm has to allocate
another expense despite of share option compensations.
The findings for Australian firms are different with previous studies in
the US, which find negative reaction prior to the announcement and positive
reaction after the announcement of executive option grants. Positive reaction
prior to the announcement of executive option grants for pure executive option
group leads to the notion that there is no opportunistic behaviour to time the
release of favourable news and unfavourable news around the announcement
date.
Further, the parametric test results show that pure executive options
group is different from executive options with directors’ fees group. The result is
statistically significant at least at 10% level for all events reported.
Table 1.
Market Reaction to Executive Share Option Announcement for All Samples
Using two tail test:
Day –1 One day before the announcement
Day –2 Two days before the
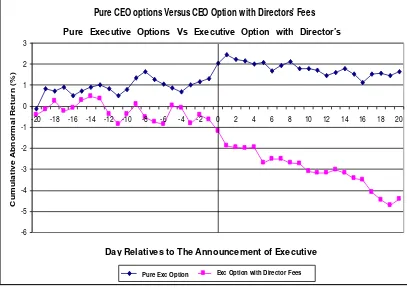
To support the previous analysis, Figure 1 illustrates the difference in the market reaction between the announcement of pure executive option grant and
the announcement of executive option grant with the increase in director’s fees.
Figure 1.
CAR for Pure Executive Option Grants Versus Executive Option Grants
with an Increase in Directors’ Fees Groups (Day –60 to +60)
The figure illustrates that pure Executive option grants trigger positive
market reactions from 60 days before the announcement date to 60 days
afterward. The reaction is concentrated at the three days event window (day –1
Pure CEO Options Versus CEO Options with Director's Fees
-10
Day Relatives to The Announcement of CEO Option Grants
C
Pure CEO Options CEO Options w ith Directors' Fees
Pure Executive Options Vs Executive Option with Director ’s Fees
Day Relatives to The Announcement of Executive Option Grant
Pure Exc Option Exc Option with Director Fees
Pure CEO Options Versus CEO Options with Director's Fees
-10
Day Relatives to The Announcement of CEO Option Grants
C
Pure CEO Options CEO Options w ith Directors' Fees
Pure Executive Options Vs Executive Option with Director ’s Fees
Day Relatives to The Announcement of Executive Option Grant
to day +1) and continues to increase after that until 60 days after the
announcement date.
On the other hand, Figure 2 also indicates that the announcement of
executive option grants concurrently with an increase in directors’ fees generates
a negative reaction. The reaction is concentrated at the event window day –1 to
day +1 and continues to show a downward trend after the announcement date
(day 0).
Similarly, Figure 2 gives clear illustration the difference between two
groups market reaction for event period twenty days before the announcements
to twenty days after the announcements of executive option grants. The market
reaction for both groups is concentrated at day –1 to day +1.
Figure 2.
CAR for Pure Executive Option Grants Versus Executive Option Grants with
an Increase in Directors’ Fees Groups (Day –20 to +20)
The upward trend of share prices of pure executive options group before
and after announcements in both figures denote there is no opportunistic
behaviour to time of releasing of good news and bad news in Australian Pure CEO options Versus CEO Option with Directors' Fees
-6
Day Relative to the Announcements of CEO Option Grants
Cu
Pure CEO Options CEO Options w ith Director's Fees
Pure Executive Options Vs Executive Option with Director’s
Day Relatives to The Announcement of Executive
evidence. It indicates that share options grants can align the interest between
executive and shareholders.
Only in the pre announcement period the result differs from previous
studying, which mostly find negative abnormal returns before the announcement
date and positive abnormal returns after the announcement date. Previous study
documented that mixed results associated to the announcement of executive
option grants indicated executive timed the release of good news and bad news.
The Existence of Performance Hurdles
Performance hurdles attached to option grants give assurance that the
vesting of executive options will not occur unless the hurdles are achieved. If
only the existence of performance hurdles attached to the grant would be
insufficient. The performance hurdles must be effective, which is including the
magnitude of performance hurdles. Adequate performance hurdles ensure that
the increase of share price is as the result of management efforts rather than the
result of overall economy (Brickley, Bhagat and Lease, 1985).
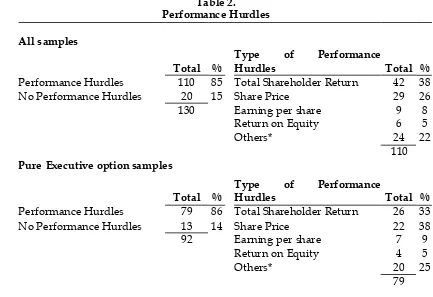
2
Table 2 shows that the majority of the firms have
performance hurdles (85%) attached to the grants.
Findings from Australian evidence indicate that the
granting of executive options grants mostly have
performance hurdles. Under the current regulation, if
the company decides to grant executive options
without performance hurdles attached to the grant,
they have to disclose the reasons why they do not set
the type of performance hurdles used by the firms
generally is total shareholders return (38%), share
price hurdles (26%), and earning per share (8%).
This study also reports that for the sub sample of firms only granting
executive options, 86% of the firms have performance hurdles attached. The
contender group, sub sample of firms granting executive option and having an
increase in directors’ fees, 82% of the firms have performance hurdles.
Both groups have a tendency to use the same type of performance hurdles such
as total shareholder return, share price hurdles, earning per share or return on
equity. The results presented in Table 2 indicate that the existence of performance
hurdles is common in Australia and most of executive option grant are subject to
performance hurdles.
Performance Hurdles 79 86 Total Shareholder Return 26 33
Total %
Type of Performance
Hurdles Total %
Performance Hurdles 31 82 Total Shareholder Return 16 52
No Performance Hurdles 7 18 Share Price 7 23
38 Earning per share 2 6
Return on Equity 2 6
Others* 4 13
31
*Others include NPAT, NPBT, EBITA, Accumulation Index, Investment Growth,
Market Capitalisation and Annual Compound Growth.
Discussions and Limitations
The purpose of granting executive options is to align
managers-shareholders interests. The existence of positive market reactions around the
announcement dates indicates that market perceives the granting of executive
with share options as favourable news. They believe that executive will work to
increase the company’s performance, which is consistent with the purpose of setting compensation packages as suggested in the agency theory. The findings
strengthen argument that options are still popular means in aligning the interest
between executive and shareholders.
The result is different from the US studies, which mostly found negative
market reaction prior to the announcement of executive option grants and
positive market reaction after the announcement dates. It may indicate that
Australian executive may not use his discretion to manipulate the release of bad
news and good news in determining exercise price.
Descriptive data of performance hurdles leads to the first notion that the
existence of performance hurdles attached to the grants is prevalent in Australia.
The measurement should include the magnitude of adequate performance
hurdles, which might come in different results.
This study acknowledges the limitations regarding the time of study, small
number of data and control variables. Data elimination that contaminated with
other announcements has been used in this study to control the sample.
However, there might be other variables, which affect the increase or decrease in
Therefore, further research can be developed in many ways. First, it can
look at the impact other contaminate news to the announcements executive
option grants despite of the increase in directors fees such as issue shares.
Second, it should measure the market reaction to the option grants by looking at
the magnitude of adequate performance hurdles.
CONCLUSION
To sum up, measuring the effectiveness of share options as the means to
solve the agency problems, which exists between managers and shareholders are
very complex investigation. Many factors should consider giving difference
perspective on the effectiveness of share option.
Overall findings from this study lead to the argument that share options
are the effective means to align managers-shareholders interest, the existence of
performance hurdles is prevalent in Australia, and most of executive option
grant are subject to performance hurdles.
REFERENCES
Bergmann, G. (2003). Getting Your Fair Share, Australian CPA, Vol. 73, No. 8, pp.
78-79.
Brickley, J. A., S. Bhagat, and R. C. Lease (1985). The Impact of Long-range
Managerial Compensation Plans on Shareholder Wealth, Journal of
Accounting and Economics, 7, pp. 115-129.
Brookfield, D. and P. Ormrod (2000). Executive Stock Options: Volatility,
Managerial Decisions and Agency Costs, Journal of Multinational financial
Management, Vol. 10, pp. 275-295.
Brown, M. and Samson, D. (2003). Executive Compensation: Balancing
Competing Priorities, Australian Accounting Review, Vol. 36, no. 3, pp.
316-323.
Brown, P. and Yew, E. (2002). How Do Investors Regard ESOs? Australian
Accounting Review, Vol. 12, no.1, pp. 36-42.
Buffini, F., and D. Kitney (2005). Executive Salaries: Plenty of Extras in CEOs’
Pay Packets, The Australian Financial Review, 16 November 2005.
Cassano, M. (2003). Executive Stock Options: Back to Basics, The Australian
Economic Review, vol. 36, No. 3, pp. 306-315.
Chalmers, K. and P. Koh (2005). Value of Enforcement Regime Change: Option Value Disclosure, Working Paper, www.business.uq.edu.au/
events/speakers/kchalmers-paper.pdf, Date Accessed [21/11/2005].
Clark, K. (2004). Share and Share Alike, Australian CPA, Vol. 74, No. 4, pp. 72-76.
Colquhoun, L. (2001). Executive Options Under the Gun, Business Review Weekly,
Core, J. E., R. W. Holthausen, and D. F. Larcker (1998). Corporate Governance,
Chief Executive Officer Compensation, and Firm Performance, Journal of
Economics, Vol. 51, pp. 371-406.
Coulton, J. and S. Taylor (2002). Option Awards for Australian CEOs: the Who,
What and Why, Australian Accounting Review, Vol. 12, No. 1, pp. 25-35.
Goodwin, J. and P. Kent (2004). The Incentives of Australian Companies To
Utilize Executive Stock Option Plans, Corporate Ownership & Control,
Volume 1, Issue 2 (Winter), pp. 137-149.
Gordon, J. N. (2002). What Enron Means for the Management and Control of the
Modern Business Corporation: Some Initial Reflection, The University of
Chicago Law Review, Summer, 69, 3, pp. 1233-1250.
Griner, E. H. (1999). The Effect of CEO Option Grants on Shareholders Return,
Journal of Managerial Issues, Vol. XI, No. 4, Winter (1999), pp. 427-439. Hall, B. J. and K. J. Murphy (2002). Stock Options for Undiversified Executives,
Journal of Accounting and Economics, 33, pp. 3-42.
Hooper, N. (2005). Long–term Incentives the Way to Go, The Australian Financial
Review, 16 November 2005.
Jensen, M. C. and K. J. Murphy (1990). Performance Pay and Top-Management
Incentives, Journal of Political Economy, Vol. 98, No. 21, pp. 225-264.
Jensen, M.C. and Meckling, W.H. (1976). Theory of the Firms: Managerial
Behaviour, the Agency Costs and the Ownership Structure, Journal of
Financial Economics, Vol.3, pp. 305-360.
Kerin, P. (2003). Executive Compensation: Getting the Mix Right, The Australian
Economic Review, Vol. 36, No. 3, pp. 324-332.
Lie. E., (2005). On the Timing of CEO Stock Option Awards, Management Science,
Vol. 51, No. 5., pp. 802-812.
Martin, K. J. and R. S. Thomas (2003). When is Enough, Enough? Market Reaction to Highly Dilutive Stock Option Plans and the Subsequent Impact
on CEO Compensation, Journal of Corporate Finance, XX, pp. 1-23.
Morgan, P. and A. B. Poulsen (2001). Linking Pay to Performance-Compensation
Proposals in the S&P 500, Journal of financial Economics, Vol. 62, pp. 489-523.
Nofsinger, J. R. and B. Prucyk (2003). Option Volume and Volatility Response to
Scheduled Economic News Releases, The Journal of Future Markets, 23, 4, pp.
315-345.
SPSS Base 7.0 Application Guide (1996). SPSS Inc.
Stoddart, E. K. (2001). Options in Valuing Equity Compensation Benefits,
Australian Accounting Review, Vol. 11, No. 2, pp. 49-61.
Thomson, J. (2002). Value for Money, Business Review Weekly, 20/12/2001–
9/1/2002, pp.71-73.
Yermack, D. (1997). Good Timing: CEO Stock Option Awards and Company