A Rapid Simulation
System for Decision
Making in Intelligent
Forest Management
Jing Fan, Tianyang Dong, Xinxin Guan, and Ying Tang, Zhejiang University of Technology, China
Balancing different
forest management
goals related
to economic,
ecological, and
social sustainability,
a rapid simulation
system uses
CPU+GPU
heterogeneous
patterns to accelerate
the computation of
dynamic processes,
supporting quick and
intelligent decision
making.
and social sustainability can have a tremen-dous impact on the final selection of forest management plans.1,2 The cycle of forest succession is very long—which includes ger-mination, seed dispersion, juvenile growth, juvenile mortality, adult growth, and adult mortality—so forest managers don’t have the required time to complete actual exper-iments and verify the effect of each forest management plan. Instead, they use succes-sion models to quickly predict the long-term effects of forest management practices.
Spatially explicit forest succession mod-els can describe the detailed interactions among trees both vertically and horizon-tally, and they provide a realistic and accu-rate representation of a forest ecosystem.3,4 However, the incorporation of this explicit-ness into forest succession models leads to great costs in terms of computation time. Because hundreds of plans are generated to reach all kinds of forest management goals, it can take several months to complete the
simulation and evaluation of each alter-native to make a scientific and reasonable selection. The existing simulation method simply can’t satisfy the simulation require-ments of large-scale plots in forest man-agement decision making. This problem has also seriously restricted the ability of forest managers to quickly make relevant decisions.
To speed up the simulation and evalua-tion of forest management plans, we present a rapid system that uses GPUs to accelerate the computation of dynamic forest succession processes, simulate alternative forest manage-ment plans, and support intelligent selection of forest management plans.
Simulation Process and System Architecture
Forest management decision making needs to find more intelligent ways to strike a balance between different forest manage-ment goals, such as the maximum amount
T
he forest management decision-making process is built on the
comprehen-sive evaluation of forest ecosystems—their function, structure, biological
diversity, adaptability, succession laws, and management efficiency. Therefore,
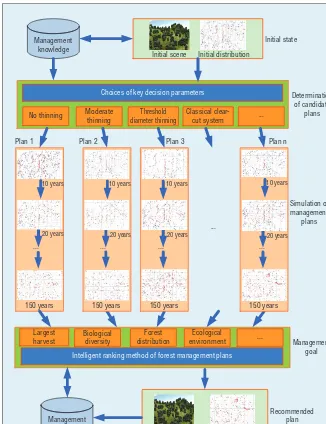
of acceptable deforestation, biologi-cal diversity, and spatial distribution. Forest management plans also need to factor in the most common selec-tivecutting methods, such as no thin-ning, moderate thinthin-ning, threshold diameter thinning, and classic clear-cut. Figure 1 shows the simulation process.
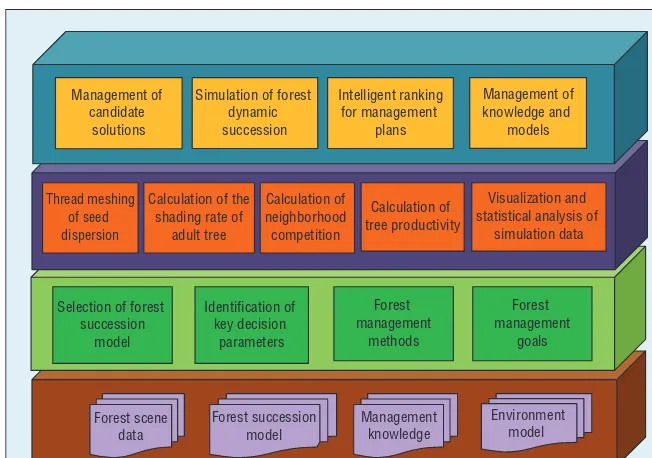
To rapidly simulate alternative for-est management plans and quickly de-termine the optimal solution, the rapid simulation system is divided into four
layers (see Figure 2): data, strategy, computing, and application.
The data layer is the system’s foun-dation. It stores and manages the environment model, the forest succes-sion model, any knowledge related to forest management, and the data in the simulation scene that are necessary for simulating dynamic succession. Besides helping with selection, the strategy layer automatically identifies key decision parameters and comprehensively con-siders both forest management goals
Plan 1
...
Plan 2 Plan n
10 years
20 years
150 years
Management goal Largest
harvest
Biological diversity
Forest distribution
Ecological
environment ...
Simulation of management
plans Determination
of candidate plans No thinning Moderate
thinning
Threshold diameter thinning
Classical clear-cut system ... Plan 3
Target distribution Target scene
Recommended plan ...
10 years
20 years
150 years
...
10 years
150 years
...
10 years
20 years
150 years ...
Choices of key decision parameters
Intelligent ranking method of forest management plans
Management knowledge
20 years
Figure 1. Simulation to support forest management decision making. It’s an intelligent way to strike a balance between different forest management goals, such as the maximum amount of acceptable deforestation, biological diversity, and spatial distribution.
IEEE Computer Society Publications Office
10662 Los Vaqueros Circle, PO Box 3014 Los Alamitos, CA 90720-1314
Lead Editor Brian Kirk [email protected]
Editorial Management Tammi Titsworth
Manager, Editorial Services Jenny Stout
Publications Coordinator [email protected]
Director, Products & Services Evan Butterfield
Senior Manager, Editorial Services Robin Baldwin
Digital Library Marketing Manager Georgann Carter
Senior Business Development Manager Sandra Brown
Senior Advertising Coordinator Marian Anderson [email protected]
Submissions: For detailed instructions and formatting, see the author guidelines at www.computer.org/intelligent/author. htm or log onto IEEE Intelligent Systems’ author center at Manuscript Central (www.computer.org/mc/intelligent/ author.htm). Visit www.computer.org/ intelligent for editorial guidelines.
I N T E L L I G E N T D E C I S I O N M A K I N G
and methods. The computing layer is a bridge between the strategy and appli-cation layers. It uses CUDA-based ac-celerated calculation to determine seed dispersion, the neighborhood competi-tion index, adult trees’ shading rates, and tree productivity. Finally, the applica-tion layer provides a user interface for managing plans, knowledge, succession models, and so on. It can also calculate a dynamic succession model based on GPU acceleration, rapidly realize the visualization and statistical analysis of simulation data from each solution, and intelligently rank management plans to get to the optimal solution.
GPU-Based Accelerated Calculation
As a spatially explicit dynamic model, the SORTIE model takes into con-sideration the interactions among tress both vertically and horizontally, making it more realistic and accurate than other forest models in simulat-ing the evolution of large-scale forests
(www.bvcentre.ca/sortie-nd). We adopt the SORTIE model in this work to sim-ulate forest succession; the process is cy-clic, and the simulation flow of one time step is divided into six submodels: ger-mination, juvenile growth, juvenile mortality, adult growth, adult mortal-ity, and seed dispersion. We can com-pute each submodel independently but sequentially, with the computation de-pending on the results of the previous submodel.
The computation process of dy-namic forest succession is highly complex: in a 100 × 100 plot area with 2,500 trees, the simulation of a year can take at least five hours on a computer with an Intel Xeon CPU E5506 2.13-GHz processor. Because there are all kinds of forest manage-ment goals, decision making can pro-duce hundreds of plans, thus when the forest plot is much larger (at least 1 km2) and the simulation is run for a longer duration (at least 100 years), it can take several months to simulate
all the options. The main objectives of our research are to determine how to quickly simulate each forest man-agement plan based on a spatially explicit forest succession model, and how to get more accurate simulation data that are visual and quantitative to support decision making.
Few studies improve the computa-tion time of forest succession. Sath-ish Govindarajan and his colleagues presented an efficient simulator that adopted an optimized calculation method to show how the seeds are dispersed.5 However, the preprocess is time-consuming for larger-sized plots, and it’s no longer applicable when the seed dispersion doesn’t have obvious spatial-temporal varia-tion characteristics. Govindarajan and his colleagues also exploited the model to calculate the distribution of light resources in forest and proposed a novel method to compute the dis-tribution of understory light in the forest based on the graphics card.6 To calculate the competition between trees more efficiently, an implemen-tation of the SORTIE model reduced the calculation load by building the list structure according to the circle of competition influence.
Although our system has adopted an algorithm that appears elsewhere,6 to speed up computing the distribution of understory light, the large amount of forest data involved in the simula-tion still leads to a large cost in com-putational time. From our experi-mental results’ statistics and analysis, based on the accelerated computa-tion for the distribucomputa-tion of understory light, the calculation of adult growth and seed dispersion submodels account for 90 percent of the entire calculation, making them the most important op-timization objects. The submodels of adult growth and seed dispersion are computationally intensive, and the data have highly parallel features.
Forest management
methods Identification of
key decision parameters Thread meshing
of seed dispersion
Calculation of the shading rate of
adult tree
Calculation of neighborhood competition
Strategy layer
Management of knowledge and
models
Computing layer
Application layer
Management of candidate
solutions
Simulation of forest dynamic succession
Visualization and statistical analysis of
simulation data Intelligent ranking
for management plans Calculation of tree productivity Selection of forest
succession model
Accordingly, we can split these sub-models into multiple subtasks by using a parallel method for optimization.
In the succession process, germi-nation, juvenile mortality, and adult mortality are primarily related to the logically complex operations of ad-dition, deletion, and judgment; the
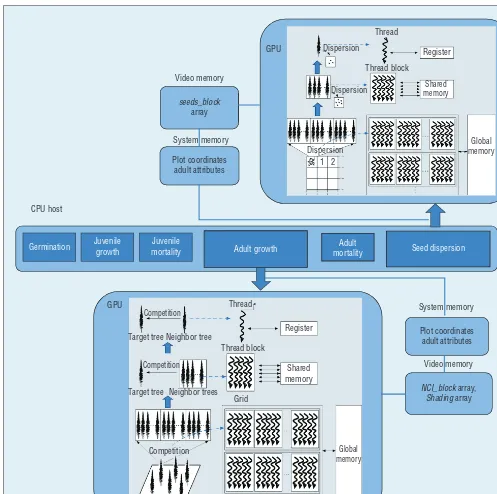
computation consumption of juvenile growth is relatively small. Therefore, a CPU can execute these four subpro-cesses, so we use a CPU+GPU hetero-geneous pattern to optimize overall system performance, as Figure 3 shows.7,8 In this pattern, the CPU is the main processor responsible for
organizing and storing forest data, controlling the succession process, and handling serial computation for the four subprocesses. The GPU serves as the CPU-scheduled coprocessor, primarily for the CUDA-based par-allel computing optimization of seed dispersion and adult growth. In each Video memory
Video memory GPU
CPU host
Germination Juvenile growth
Juvenile
mortality Adult growth
Adult
mortality Seed dispersion
Shared memory Dispersion
Dispersion 0 1 2
Global memory
Thread Competition
Competition
Competition Target tree
Target tree
Neighbor tree
Neighbor trees
Register
Shared memory Thread block
Grid
Global memory System memory
System memory
Plot coordinates adult attributes
NCI_block array, Shading array Plot coordinates
adult attributes seeds_block
array
I N T E L L I G E N T D E C I S I O N M A K I N G
growth cycle, the CPU sequentially schedules each submodel according to the succession process. When the GPU-based calculation is required, the CPU provides data for the GPU. Once the GPU-based calculation is com-pleted, the CPU regains control and accepts the results returned from the GPU, and then starts again with the next submodel.
The GPU-based accelerated com-putation of seed dispersion divides the plots into uniform grid cells. We can calculate the number of seeds dispersed in each plot to get the to-tal seed dispersion results. This cal-culation process has two levels of computation parallelism: the first is to compute the number of seeds dis-persed in the plot’s grid cells, and the other is the process by which each adult tree produces seeds per plot cell. Figure 3 shows the GPU opti-mization algorithms for seed dis-persion. The two parallelisms are mapped to the threads of a 2D grid, where the Y dimension (defined as grid Y) represents the plot cells, and the X dimension (defined as grid X) represents the array of adult trees that generate seeds. Each thread block is responsible for calculating the seed contribution of a certain number of adult trees on a plot cell—each thread deals with a single adult tree for the seeds dispersed to that plot cell. The total number of seeds contributed by all the blocks in the same Y dimen-sions corresponds to that plot cell’s seed dispersal results.
In the GPU-based accelerated com-putation of adult growth, the shad-ing value blocked by neighborshad-ing trees, the neighborhood competition index, and final growth are divided into three separate computational kernels according to their computa-tional complexity. The thread meshing of the first two factors complies with the method of 2D thread meshing for
the seed dispersion. The X dimension represents the competition impact of neighborhood adult trees, and the Y
dimension represents the computation of target adult trees. Therefore, the thread blocks on the same Y dimen-sion respond to the competitive effects computation of the same target adult trees. Based on the shading rate and neighborhood competition index, we can design a 1D thread grid to com-pute the growth of adult trees in par-allel, where each thread corresponds to an adult tree.
Intelligently Ranking Forest Management Plans
It’s difficult for decision makers to se-lect the optimal forest management plan—something that can meet mul-tiple objectives from a large number of options. To address this conun-drum, we use an intelligent ranking method of forest management plans based on multiobjective optimization. If n is the number of forest manage-ment goals, and m is the number of candidate forest management plans in decision making, we have
Xi= (x1i, x2i, ..., xmi), i = 1, 2, …, n,
where Xi is the ranking vector of plans for the ith forest management goal, and xji is the ranking of the jth plan in the ith forest management goal (j = 1, 2, …, m). For the ranking vector of forest management plans after composite analysis, we have
X0= (x10, x20, ..., xm0),
where X0 is the ranking vector of forest management plans after composite analysis, and xj0 is the ranking of the jth forest management plan in X0 (j = 1, 2, …, m).
In the comprehensive ranking of forest management plans, we use the following multiobjective optimization:
min min ( ) weight of the ith forest management goal, and Wi
If the ith forest management goal is more important, the value of Wi will be endowed with a larger weight. We generate the final comprehensive ranking of forest management plans to minimize the sum of squared dis-tances from X0 to each Xi. Therefore, from the above ranking computation, we get the proper candidate forest management plans that can fully re-flect the balance of all forest manage-ment goals and provide a candidate set of fewer options. We adopt a ge-netic algorithm to achieve the intel-ligent ranking. Based on experiential knowledge, decision makers can select and confirm the optimal plan from the candidate set.
The Effects of
Accelerated Calculation
We developed our rapid simula-tion system in VS2008 with C++ and the CUDA Toolkit Version 2.1. The experiments described here have been performed on a computer with an Intel Xeon CPUE5506 2.13-GHz processor with 4 Gbytes memory and an NVIDIA Quadro 600 (2 Gbytes memory) graph-ics processor.
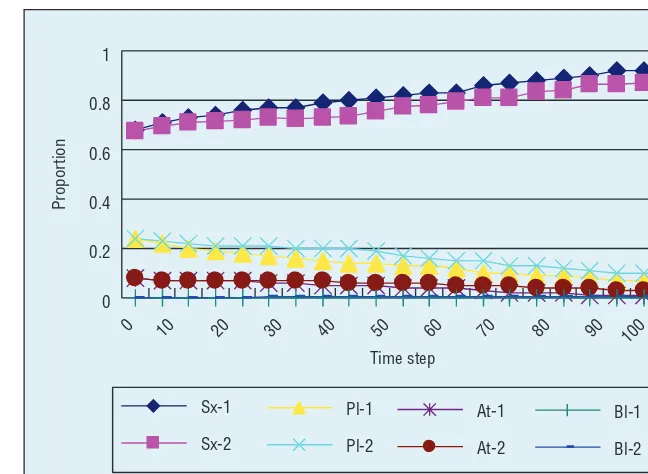
67.34, 24.29, 7.96, and 0.41 percent. Figure 4 shows the change of pro-portion for each tree species by sim-ulating the dynamic forest succession over 100 years. The tree species de-noted with the suffix 2 are the simu-lation results of SORTIE-ND, and the tree species with suffix 1 are our simulation results. The trend given by our system is basically the same with those of SORTIE-ND.
To prove that our optimization of parallel computation for seed dispersion and adult growth can significantly im-prove the speed of the entire forest simulation, we compared the comput-ing time necessary both before and af-ter the optimization based on data from the aforementioned plots. Before using the optimized method, the average an-nual simulation time is 11,358 ms, of which the computation time of adult growth is 8,316 ms and time of seed dispersion is 1,805 ms. In comparison, the average annual simulation time us-ing the optimized method is 1,246 ms, of which the computation time of adult growth is 53 ms and time of seed dis-persion is 94 ms. The speedup ratio for computing the adult growth, seed dis-persion, and annual simulation is, re-spectively, 156.9, 19.2, and 9.1 times.
According to our experimental re-sults for 10,000 trees in a 1-km2 plot area and without optimizing for seed dispersion and adult growth, the simu-lation of forest succession for one year would take about 54 hours—100 years would probably take several months. As the independent simulation of adult growth shows, the speedup also gradually increases before and af-ter the optimization with the increas-ing size of the adult trees. When the adult number reaches 5,000 or more, the GPU running time and the scale of the adult trees are proportional. The speedup is at a stable value of 104, and the growth computation time of
10,000 trees is about 18 seconds. The computational time of seed dispersion is related to the product value of plot scale and the number of adult trees, because each plot cell’s seed num-ber is based on the calculation of all adult trees, and all plot cells are cal-culated in the same way. According to our experiment, when the product value is over 106, the speedup is al-most stable at about 2,000, and the computation of seed dispersion for 10,000 trees in a 1-km2 plot area takes about 51 seconds. Therefore, after optimization, in 1-km2 plot areas with 10,000 trees, the simulation of forest succession for one year would take about 113 seconds. The computation efficiency of forest succession for one year improves by about 1,700 times higher than before: only a few hours are required for a hundred years’ sim-ulation, which can greatly reduce the overall simulation time.
Application to Decision Making
Our system can simulate the process of dynamic forest succession accord-ing to soil, moisture, illumination,
tree species, and age of trees. It can also analyze the downturn of the aver age annual growth of trees based on simulation results and then iden-tify the year in which forest plots reach maturity, setting that year as the initial year of selective cutting. After that, according to preexisting simulation results, historical data, and expert experience in the system’s knowledge base, our system can auto-matically determine key decision parameters such as selective cutting method, minimum selective cutting diameter, selective cutting cycle, selec-tive cutting rate, and so on.
Because of the variety of selective cutting methods and the large num-ber of key decision parameter values, hundreds—maybe even thousands— of possible forest management plans will be generated. According to the experimental results we reported in the previous section, for example, the average annual growth of trees begins to decline at the 20th year of natural succession, and the average annual growth of lodgepole pines with a di-ameter at breast height (DBH) greater than 30 cm also decreases. Therefore, 0
0.2 0.4 0.6
0 10 20 30 40 50 60 70 80 90
100
Time step
Proportion
Sx-1
Sx-2
Pl-1
Pl-2
At-1
At-2
Bl-1
Bl-2
I N T E L L I G E N T D E C I S I O N M A K I N G
we can set the 20th year as the initial year of selective cutting. The simula-tion applicasimula-tion we described chooses the minimum diameter, cycle, and rate as the three key parameters in the selective cutting process. Accord-ing to the historical data in our rapid simulation system, and with a mini-mum selective cutting diameter of 30, 34, 37, 40, 46, and 50 cm, selective cutting cycle of 20, 25, 30, 35, and 40 years, and selective cutting rate of 25, 32.3, 50, 67.9, and 100 percent, it
will provide 150 kinds of forest man-agement plans.
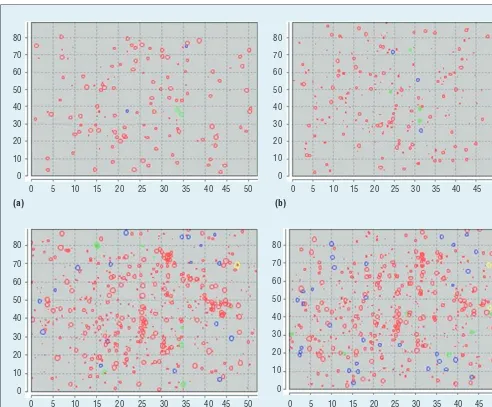
For our initial forest plots, if the simulation time is 150 years, the se-lective cutting plan (30 cm, 35 years, 100 percent) and cutting plan (34 cm, 25 years, 100 percent) have the two largest harvests—1,097.01 m3/hectare (ha) and 1,089.18 m3/ha, respectively, according to simulation results in Figures 5a and 5b. These two solutions are ranked in first and second place, according to forest management
goals about deforestation. However, considering the distribution of trees after 150 years, these two solutions have negative ecological impacts on the site because there are only 302.51 and 490.49 trees per hectare, respectively.
As the simulation results of the se-lective cutting plan (50 cm, 35 years, 32.3 percent) and cutting plan (50 cm, 30 years, 100 percent) show in Fig-ures 5c and 5d, there are 1,106.31 and 1,095.50 trees per hectare, 80
70
60
50
40
30
20
10
0
0 5 10 15 20 25 30 35 40 45 50
80
70
60
50
40
30
20
10
0
0 5 10 15 20 25 30 35 40 45 50
80
70
60
50
40
30
20
10
0
0 5 10 15 20 25 30 35 40 45 50
80
70
60
50
40
30
20
10
0
0 5 10 15 20 25 30 35 40 45 50
(a)
(c)
(b)
(d)
only 546.94 m3/ha and 543.83 m3/ha. These two solutions are optimal in species density and can be used to maintain a diversity of species; they’re ranked first and second place accord-ing to forest management goals about species density.
When making recommendations for our forest plot, we need to consider the diversity of species and forest har-vest together as a whole to achieve the multi-objective optimization of for-est management—their weights are both 0.5. According to the ranking re-sults, the selective cutting plan (46 cm, 30 years, 100 percent) and cutting plan (46 cm, 20 years, 67.9 percent) are the two best solutions. For these two plans, the harvests are 712.01 m3/ha and 678.07 m3/ha, and there are 1,030.68 and 1,011.24 trees per hectare, re-spectively. For the same forest plot, if the harvest is the prime objective and maintaining the stability of forest eco-systems is an auxiliary goal—say, their weights are 0.6 and 0.4, respectively— the selective cutting plan (30 cm, 35 years, 100 percent) and cutting plan (34 cm, 25 years, 100 percent) will be better solutions.
I
n the future, we plan to analyze and deduce the causal relation-ship between the simulation results and the recommended forest ment plan to extract forest manage-ment knowledge. Furthermore, the extracted forest management knowl-edge can be deployed in the Strategy Layer of the rapid simulation system that supports forest management de-cision making, thereby potentially affecting new upcoming forest man-agement decisions.Acknowledgments
This work is supported by grants from the Na-tional Natural Science Foundation of China
(nos. 61173097, 61003265, and 61202202), the Key Science and Technology Innovation Team of Zhejiang Province (no. 2009R50009), the Zhejiang Science and Technology Planning Project of China (no. 2010C33046), the Zhe-jiang Natural Science Foundation of China (nos. Z1090459 and Y1101102), and the Tsinghua-Tencent Joint Laboratory for Inter-net Innovation Technology. Ying Tang was the corresponding author for this article.
References
1. K. Eyvindsona et al., “Selecting a Forest Plan among Alternatives: Consistency of Preferences within Decision Support Frameworks,” Forest Policy and Economics, vol. 15, 2012, pp. 114–122. 2. E.-M. Nordström, L. Eriksson, and
K. Öhman, “Integrating Multiple Criteria Decision Analysis in Participatory Forest Planning: Experience from a Case Study in Northern Sweden,” Forest Policy and Economics, vol. 12, no. 8, 2010, pp. 562–574.
3. S.W. Pacala, C.D. Canham, and J.A. Silander, “Forest Models Defined by Field Measurements: I. The Design of a Northeastern Forest Simulator,”
Canadian J. Forest Research, vol. 23, no. 10, 1993, pp. 1980–1988.
4. H. Bugmann, “A Review of Forest Gap Models,” Climate Change, vol. 51, nos. 3–4, 2001, pp. 259–305.
5. S. Govindarajan et al., “A Scalable Algorithm for Dispersing Population,”
J. Intelligent Information Systems, vol. 29, no. 1, 2007, pp. 39–61. 6. S. Govindarajan et al., “A Scalable
Simulator for Forest Dynamics,” Proc. 20th ACM Symp. Computational Geometry, ACM, 2004, pp. 106–115. 7. S.V. Jeffrey et al., “Keeneland: Bringing
Heterogeneous GPU Computing to the Computational Science Community,”
Computing in Science & Eng., vol. 13, no. 5, 2011, pp. 90–95.
8. K. Wang and Z. Shen, “Artificial Societies and GPU-Based Cloud Computing for Intelligent
Transportation Management,” IEEE Intelligent Systems, vol. 26, no. 4, 2011, pp. 22–28.
9. G.F. Shao et al., “Integrating Stand and Landscape Decisions for Multi-Purposes of Forest Harvesting,” Forest Ecology and Management, vol. 207, nos. 1–2, 2005, pp. 233–243.
virtual reality, and software component technology. Fan has a PhD in computer science from Zhejiang University. She’s a member of IEEE and a director of the China Computer Federation. Contact her at [email protected].
Tianyang Dong is an associate professor with the School of Computer Science and Tech-nology at Zhejiang University of TechTech-nology, China. His research interests include com-puter graphics and artificial intelligence. Dong has a PhD in comcom-puter science from Zhejiang University. Contact him at [email protected].
Xinxin Guan is a teaching assistant with the School of Computer Science and
Technol-ogy at Zhejiang University of TechnolTechnol-ogy, China. Her research interests are in computer graphics and concurrent computation. Guan has an MS in computer science from Zheji-ang University of Technology. Contact her at [email protected].
Ying Tang is an associate professor with the School of Computer Science and Technol-ogy at Zhejiang University of TechnolTechnol-ogy, China. Her research interests are in computer graphics and information visualization. Tang has a PhD in computer science from Zheji-ang University, China. Contact her at [email protected].