The level of environmental degradation continues rising to lead a global warming. Without immediate prevention measures, this could bring the Earth into total breakdown. Therefore environmental preservation campaign buzzing for every element of the society to participate in the campaign. Number of people understand and care about environmen-tal degradation and global warming is growing. Many people aim is to influence the lifestyle and consumption pattern of the society. The campaign is to attract and motivate the society to purchase environ-mentally friendly goods which are also known as green products. The number of potential people to the purchase green products continues rising along with the spread of knowledge concerning the importance of conserving the environment. Such condition recognized by the com-panies. Therefore they start to consist them as the target market. One of the important marketing aspects is market segmentation. There are many ways and statistical methods to classifying consumers into par-ticular segmentations; one of the methods is the Chi-squared Auto-matic Interaction Detector (CHAID). CHAID, it is implemented in this research for green product market segmentation (Segmentation result subsequently used to determination of the following strategic marke-ting measures). CHAID examines independent variables used in clas-sification and arrangement process based on the level of chi-square statistical significance towards the dependent variable. Dependent variable used in this research is potential customer trend to purchase preference of green products. The result shows that significantly in-fluential variables towards the potential of green products buyers are age, educational background, gender and their monthly amount of expenditure / spending.
© 2011 IRJBS, All rights reserved. Received: May 2, 2011
Final revision: October 25, 2011
Keywords:
environmental preservation, global warming,
green product, segmentation, CHAID
Corresponding author:
A R T I C L E I N F O A B S T R A C T
Vol. 4 | No. 3 ISSN: 2089-6271
Edi Abdurachman
*, Khi On
**BINUS University, Jakarta
The Impact of Age, Educational Background,
Gender, and Monthly Expenditure
In Indonesia, global warming and environment preservation is popularly discussed in the TV, media, seminars as well as schools. Nowadays almost every element of the society is aware of this. The condition encouraged the people to start appreciate the importance of preventing global warming by way of preserving the environment. They have also further understands that they can contribute, even in a small scale, to help preserve the environment thus prevents global warming from worsening. It encourages some part of the society to change their lifestyle and behavior. Such behavioral change is subsequently studied by the marketers for the sake of capitalizing the opportunity in order to market and sell their product more, which also known as green product marketing or green marketing.
Green product marketing started to be popular in 1980s along with the development of research indicating that earth has been badly damaged and the news has publicized to the society thus influencing their lifestyle (Avro, 2009). Several companies then took a stand to be committed to help prevent the environment degradation. Evidently that such measure gained positive response from the consumers. Consumers support came in the form of the purchase of the companies’ environmentally friendly products. Subsequently the number of companies embracing the same approach increased. Companies intentionally creating campaign for their product, informing that it was environmentally friendly or green, because it was well received by the public as the consumer. Green marketing is used to boost up the sales.
The number of consumers purchasing green product, also known as the green consumers, is considerable (Robin, 2007). In addition to the growing concern for environment preservation among consumers, the trend shows that green product is becoming increasingly popular among the people. It has become a lifestyle (green style). Reasoning that it does not only help to the environment preservation, green style also considered to bring cost savings to the consumers.
Examples of green product are: a. Low-power lamps,
b. Electronic devices such as refrigerator, air conditioner, computer etc. with low power, c. Printer that uses environmentally friendly inks, d. Recycled products such as: recycled books,
recycled wipes, recycled shopping bags, etc. e. Cosmetics and soaps with environmentally
friendly organic ingredient,
In a marketing system, a company has to develop strategy by analyzing influential factors to the business, including the available opportunity, regarding its scale and the time period. The following is competition factor regarding its intensity level in the business. Who is the company’s main competitor, what their main advantage is and how to win the competition. The next factor is to analyze the marketing target. To whom the marketing will be carried out on by referring the profile of potential consumers.
In case the factors mentioned above have been analyzed, the next step is to determine the target market. Citing Belch (2007), the process is divided into several steps, namely:
a. Identifiying market b. Market segmentation c. Targeting
d. Positioning
In terms of market segmentation, Lehman (2005) suggested evaluating the market segments, the company needs to observe at least two factors: first is the attractiveness of the segment structure, Measurement and growth of the targeted segment and which will generate profitability? Second factor is the goal as well as the company’s ability as they have to determine whether a potential segment comes with the right measurement and growth characteristics for the company. However, although a segment is in accordance with both factors men-tioned above, yet incompatible to the company’s goal or does not meet the company’s capability and adequate resources, then the segment is negligible. There are numerous methods that can be used
for market segmentation. One of the commonly used methods is statistical analysis method, Chi-squared Automatic Interaction Detector (CHAID). Researchers had been using this CHAID model for such segmentation, for instance, in Hoare (2004), Antipov (2010), Kusakci (2010), Ramaswani and Bhaskaran (2010), Hoare (2004) using CHAID analysis for classification based on fairly complex non-linear daily financial data. CHAID application for market segmentation in higher education environment was conducted by Kusakci (2010) using various characteristic of prospective students to predict their success in college. Similar research was performed by Ramaswani and Bhaskaran (2010), analyzing the data on the characteristic of high school students to predict college success. To evaluate the accuracy of classification model, CHAID had been used by Antipov (2010) which at the same time recommended better predictive classification model.
In the research, CHAID was used to form segmentation which separates the sample into two or more different groups based on certain criteria. Subsequently further separate the groups into smaller groups based on other independent variables. The process continues until there are no statistically significant independent variables left. Dependent variable that will be used in the research is potential buyer as the direct target market for green product whether the respondent a potential buyer or not. Whereas product purchase decision making of consumer behavior is used to determine the independent variables.
Concern about global warming and the importance of preserving the environment has become a common thing, it is not only for the scientist or government people. Information about global warming and environment preservation are available for almost everyone. Almost every nation in the world acknowledged the danger of global warming, including Indonesia.
E
nvironmental degradation, nature andits content that causes global warming has become a major topic discussed by everyone lately. In fact, the topic had long been concerned by the researchers, scientists, and environmental care activists. Nowadays people share the same concern for the impact of global warming began to get real. The most obvious phenomenon indicating global warming is climate change. For instance, frequent heavy rain in what is supposed to be the period of dry season.
Temperature increase between 0.15 – 0.30 C (Wilkipedia, 2009) throughout the earth has started to happening during 1990-2005. If it continues to increase, the entire north and south polar icebergs would be totally gone by 2040. Subsequently, in case of no improvement to the situation, there will be scarcity of freshwater that could give rise to the problem of hunger around the world by 2050. There will be serious heat, decline in agricultural sectors, freshwater scarcity causing millions of people struggling for food and water. Fumes and dusts will cause shortness of breathing. Coastal residential areas will be submerged by rising sea level, obliterating islands.
The government and environmental care institutions keep on campaigning environment preservation to the societies. Despite the minimum result, the societies began to understand and aware of the importance of preserving the environment. The society is increasingly aware that with even the smallest contribution could help to preserve the environment globally. The condition influences society’s consumption pattern. Nowadays people start to put environmentally friendly product, known as green product, into their list of choices.
of significant chi-square value result, separate the category with others. In case of more than one category that are available for separation, separate one of them with the highest chi-square value.
Gallagher (2000) further describe four steps in the use of simple CHAID analysis namely: (1) Examine each independent variables using chi-square test to determine which category could significantly indicates the difference within dependent variables and to collect all insignificant categories; (2) Determine the best or the most significant independent variables to be used in differentiating the dependent variables; (3) to split the data using the independent variable category with the most significant data; (4) examine the remaining independent variables category to determine the most significant level in specifying differences in the subsequent dependent variables and separate them with the insignificants; (5) determining which independent variables the most significant and then continued with dividing the data using the variables. Subsequently to repeat the five steps mentioned to identify all subgroups.
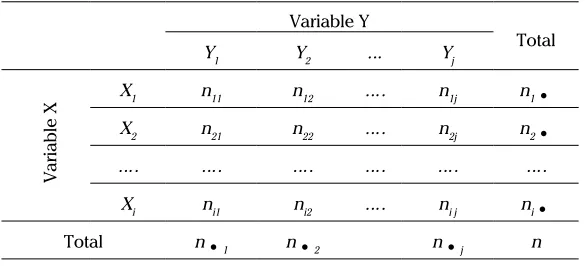
Gallagher (2000) suggestion is to conduct data testing based on the merged table. Data testing is needed to know whether there is any significant correlation between the factors. It is considered as independent or statistically free in case of insignificant correlation between them. The
significance testing performed with Chi-Ssquare
Test (
χ
2) as shown in Table 1.Based on the table, we can get the expected value or counted Eij using the formula as follow:
E
i j=
n
i˙n
.
n
˙jThe formula used in Chi Square is:
X
2=
Xi Xi
i=1 j=1
Σ Σ
(n
ij.
Eij)Eij
When the error probability value (p-value) < level of
significant (
α
) then H0 is rejected and H1 acceptedwhich means both factors are interrelated. Yet when error probability value (p-value) > level of significant
(
α
) then H0 is acceptable and H1 is rejected whichmeans both factors are not interrelated. Level of
significant or
α
used in the research is 5% (0,05).The analysis continued with selecting the best independent variables, that is the one with the lowest p-value, and then make groups distribution with the independent variables, by using each of the independent variable categories that have been merged optimally to determine the sub division There have been many references related with the
market segmentation. Nelson (2010) had reviewed the market segmentation, ranging from objective of segmentation, basis of segmentation, basic
criteria used, analysis method (Cluster Analysis,
Conjoint Analysis, CHAID, Discriminant Analysis). Other author, for example, Thomas (2007) also conducted similar analysis covering geographic segmentation, media segmentation, distribution channel segmentation, price segmentation, psychographic segmentation, demography segmentation and time segmentation. International market segmentation issue and perspective had been reviewed by Steenkamp and Hofstede (2002). They interviewed 25 empirical studies ranging from its sample aspects, geographic configuration, the validation, prospects and its weaknesses.
Segmentation using Neural Network had been
conducted by Bloom (2005) for South Africa’s tourist market segmentation. The model is also capable to support the analysis of tourist behavioral changes within and between the segments.
After the segmentation, the company is able to implement strategy to the segment. Thomspon (2008) briefly explained the strategy to win a competition. The strategy divided based on the nature of the product benefits and targeted market volume. The nature of the product benefits divided into lower-cost or differentiation, as for targeted market volume divided based on extensive or narrow. Combining the two dispositions we will get four different strategies plus another strategy that covers the first whole four strategies. The five strategies can be summarized as follows:
a. Comprehensive low-cost strategy b. Centralized low-cost strategy c. Broad differentiation strategy d. Centralized differentiation Strategy e. Best-cost strategy
After determining the marketing strategy, the next step is to make a plan that includes product decision, price decision, channel of distribution decision, and promotional decision. Indubitably,
marketing main goal is for the consumers to purchase the product.
METHODS
Data gathering in the research carries out using survey method that is by conventionally distributing written questions. Respondents are given the question sheet or direct questionnaire to be filled. In this case, respondents know understand clearly that they themselves are part of the under observation object and actively participating in the research. The resources of data and research population are group of productive-age employees, assumed to be aged between 2- to 55 year-old. The data were collected from Bandung that considered representing Indonesia’s big cities. Sampling method performed using simple random sampling method from various segments, types of occupations, gender. The sample will be picked randomly in various public locations in Bandung.
The research formed based on number of references obtained from respondents describing variables structured within green product potential buyer characteristic or in other words to acquire green product potential buyer segmentation. To develop the segmentation, analysis method used is statistical analysis method, Chi-squared Automatic Interaction Detector (CHAID).
Lehman (2001) explained the steps towards CHAID analysis. First step in CHAID analysis is to create two-way contingency table equipped with its dependent variables, in which Y as the dependent variables and X as predicator variables. Next calculate the p-value for each of the chi-square value in pairs to assess
the level of significant or
α
. Among the insignificantpairs, combine the most similar category pair (the pair with smallest paired chi-square value) into a single category. For certain combined category composed of 3 or more categories, conduct a trial to find whether a particular independent variable category should be separated by testing its significance between the category with other category within the combined category. In case
Variable Y
The dependent variables acquired from several questions directly indicating whether the respondent come under as potential buyer or not. Whereas independent variables can be acquired from the analysis of product purchase decision-making.
RESULTS AND DISCUSSION
CHAID analysis result to determine interrelation between independent variables towards dependent variables can be acquired with the assistance from SPSS 17.0 software as shown in Table 2.
From the result of Chi-Square test mentioned above, thus it is known that the variables with correlation or affecting potential buyer towards green product are Age variable and Education by reason of its p-value level is lower compared to level of significance
(
α
) of 0,05. Subsequently after running level ofsignificance test on several variable level and categories, Age variable is taken as first node.
The next step in CHAID analysis is jointing stage. In the research, Age variable divided into 4 categories:
• below 23-year-old • 23 – 30 -year-old • 31 – 40 -year-old • over 40 -year-old
Based on CHAID analysis through the search of level of significance from amalgamation possibilities, thus the category of below 23-year-old amalgamated with category of 23 – 30 –year-old and 31 – 40
-year-old. Resulting in change of Age Category variable to become as follows:
• Below of equal to 40 -year-old.
• Over 40 -year-old.
The amalgamation was done for the composition qualify chi-square significant requirement, which is p-value level below 0,05 and the biggest chi-square. It indicates that group of over 40-year-old has the tendency of ignorance towards environment thus probably considered to be included as non-potential buyer in green product marketing. There is a chance that the age group’s level of understanding and knowledge regarding environment is low, thus they bear the tendency of ignorance towards preservation of the environment.
After acquiring significance value on each step, the next step is to repeat the same CHAID analysis with limited respondent for the category below or equal to 40 -year-old. Next step, highest level of significance referring to Education variable, then continued with its categories amalgamation process. Education categories prior to the amalgamation are:
• Elementary/Junior High
• High School/equal
• Diploma/equal
• Under/Post graduate
And based on chi-square level of significance, then the category of Elementary/Junior High amalgamated with category of High School/Equal. from the master group into new sub groups. The
group divisions cannot be done if there are no independent variables with significant p-value
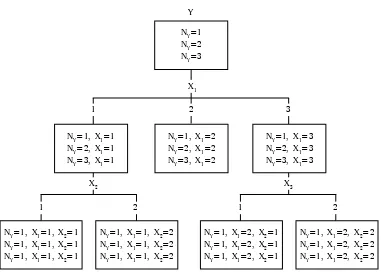
Segmentation process and CHAID result can be made into tree diagram, as shown in figure 1.
Based on explanation by Lehman (2001) CHAID tree diagram works top down, in which the diagram set from main groups, continued by sub groups structured successively based on result of main groups division in accordance with certain criteria. Each of the nodes in the diagram represents sub group from observed sample. Every node will be consisting of sample entirety and absolute frequency for each category above. In CHAID classification tree, there is term of depth resembling the amount of nodes level all the way down to the last sub group nodes. On the first depth, sample is divided by X1 as the best independent variable for dependent variable based on Chi-square test. Every node consisting of information regarding Y variable frequency, as a dependent variable, which is part of the resulting sub groups based on the category (X1). On the second depth (node X2 and X3) is
the result of division by X1 (for the 1st and 3rd). In
the same manner, next sample will be divided by other descriptive variable which are X2 and X3, thus
become sub groups of the 4th, 5th, 6th, and 7th node.
Each node shows respondent percentages for each dependent variable categories, as well as the total respondent number for each node.
This node will be interpreted as a segmentation to be tabulated divided into green product potential buyer consumers and green product non-potential buyer consumers. Green product market segmentation will be generated from the tabulation.
CHAID is used to generate segmentation dividing a sample into two or more groups based on certain criteria. Then divide the groups into smaller group based on other independent variables . Proceed until there are no statistically significant independent variables left. Dependent variable used in the research is potential buyer that will be the target of green product marketing. Dependent variables divided into two categoris:
a. Green product potential buyer consumers, b. Green product non-potential buyer consumers.
NY=1 NY=2 NY=3 Y
X1
2 1
1 2 1 2
X2 X3
3
NY=1, X1=1 NY=2, X1=1 NY=3, X1=1
NY=1, X1=1, X2=1 NY=1, X1=1, X2=1 NY=1, X1=1, X2=1
NY=1, X1=2, X2=1 NY=1, X1=2, X2=1 NY=1, X1=2, X2=1
NY=1, X1=3 NY=2, X1=3 NY=3, X1=3
NY=1, X1=1, X2=2 NY=1, X1=1, X2=2 NY=1, X1=1, X2=2
NY=1, X1=2, X2=2 NY=1, X1=2, X2=2 NY=1, X1=2, X2=2 NY=1, X1=2
NY=2, X1=2 NY=3, X1=2
Figure 1. CHAID Analysis Tree Diagram
Variable chi-square test p-value
Gender 3.461 0,063
Marital Status 0,099 0,753
Age 20.088 0,000
Education 28.859 0,000
Occupation 6.713 0,152
Occupation Field 18.014 0,081
Monthly Expenditure 9.156 0,057
old, education of High school/ Equal or below.
• 5th Segment Potential buyer of age > 40
-year-old.
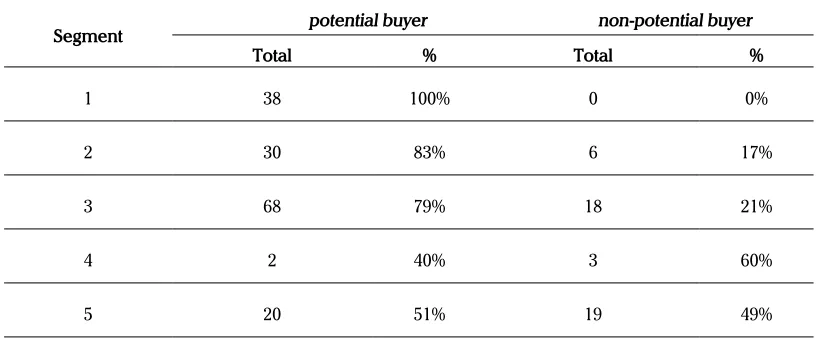
From the five segments formed will be used to calculate both green product potential and non-potential buyer as shown in Table 4.
The category of Diploma/Equal amalgamated with Under/Post graduate. After the amalgamation to become as follows:
• High School/Equal and below
• Diploma/Under/Post graduate
It indicates that education is highly correlated to green product potential buyer. Community groups with lower-middle level education will have less understanding and knowledge of environment. This has led the community group into slight ignorance towards environmental preservation, let alone the potential of green product purchase.
The following Chi-square analysis indicates Gender variable with highest significance on narrowed total respondent number. On this stage, the amalgamation is not necessary. There are only two categories, which are:
• Male
• Female
Total number of male category considered as green product potential buyer is equal with the female that is 68, however each category’s percentage vary with male category potential buyer as much as 79% (68 compared to 86), while the female is as much as 92% (68 compared to74). Thus in percentage female category is larger than the male category. This indicates that women have greater tendency to be green product potential buyer compared to man.
The process then retested to find if there were any significant variables left. Variable that can still be examined is the variable of monthly expenditure. This variable should also be amalgamated, the category of less than Rp. 1 Million to be amalgamated with the category of Rp. 1-2 Million, whereas the category of Rp. 2-3 Million amalgamated with the category of Rp. 3-5 Million and the category of less than Rp. 5 Million. The results of the amalgamation are as follows:
• Less than or equal to 2 Million
• Over 2 Million.
This proves that monthly expenditure affects green product potential buyer, in which the bigger the amount of monthly expenditure, the bigger the chance to be green product potential buyer.
CHAID analysis process mentioned above and its amalgamation process can be described in CHAID classification tree as shown in the figure 2. The figure clearly shows the nodes along with its Chi-square analysis result.
Figure 2. shows that there are four variables with significant result namely Age, Education, Gender and Monthly Expenditure. In addition to that, CHAID analysis result classification tree diagram has four depths up to no variable correlated with its dependent variable left. Whereas variables with no correlation namely Marital Status, Occupation and Occupation.
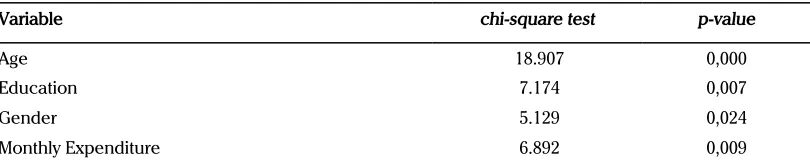
Level of p-value and chi-square test from each independent variable considered to be in correla-tion with its dependent variables as shown in the Table 3.
The four variables in Table 3 have the value of less
than α = 0,05. The conclusion is that chi-square test
is to reject H0 or in other word that the variables have the correlation with dependent variable, that is green product potential buyer.
Tree diagram in Figure 2. shows that the market can be divided into five segments, namely:
• 1st Segment Potential buyer of age < 40
-year-old, education of Diploma/under/ post graduate, female and monthly expenditure of > Rp. 2 Million.
• 2nd Segment Potential buyer of age < 40
-year-old, education of Diploma/under/ post graduate, female and monthly expenditure of < Rp. 2 Million.
• 3rd Segment Potential buyer of age < 40
-year-old, education of Diploma/under/ post graduate, male.
• 4th Segment Potential buyer of age < 40
-year-Category n %
Potential buyer 158 77%
Non-potential buyer 46 23%
Total 204 100%
Category n % Category n %
Potential buyer 138 84% Potential buyer 20 51%
Non-potential buyer 27 16% Non-potential buyer 19 49%
Total 165 100% Total 39 100%
Category n % Category n %
Potential buyer 2 40% Potential buyer 136 85%
Non-potential buyer 3 60% Non-potential buyer 24 15%
Total 5 100% Total 160 100%
Category n % Category n %
Potential buyer 68 79% Potential buyer 68 92%
Non-potential buyer 18 21% Non-potential buyer 6 8%
Total 86 100% Total 74 100%
Category n % Category n %
Potential buyer 30 83% Potential buyer 38 100%
Non-potential buyer 6 17% Non-potential buyer 0 0%
Total 36 100% Total 38 100%
< 2 million Node 7
> 2 million Node 8 Male
Node 5
Female Node 6
Expenses/Expenditures per month p-value = 0,009, chi-square = 6.892
df = 1
Equivalent high school and below Node 3
> 40 years
Diploma / undergraduate / postgraduate Node 4
Gender p-value = 0,024, chi-square = 5.129
df = 1 p-value = 0,007, chi-square = 7.174
df = 1
Node 2 Node 0
Age p-value = 0,000, chi-square = 18.907
df = 1
Node 1
Education
< 40 years
Figure 2. CHAID analysis result classification tree diagram for the Variable of Green Product Potential Buyer towards Demography of Respondents
Variable chi-square test p-value
Age 18.907 0,000
Education 7.174 0,007
Gender 5.129 0,024
Monthly Expenditure 6.892 0,009
D divisions. For companies that cannot afford to provide professional R & D divisions are suggested to think wisely, before entering this market. Thus it can be assumed that this market is classified as low competition factor, and hard entering this market for the other new players.
Target marketing or the potential buyers are those consumers who care enough about preserving the environment, and those who are willing to partici-pate in environmental conservation effort. They are willing to change their consumption patterns on their attitudes towards the environmental destruc-tion and its preservadestruc-tion.
Referring to the strategy explained by Thomson (2008) as previously discussed, currently the green product marketing is under the category of dif-ferentiation product. While on the market target side, the green product marketing is categorized under the wide market target. Therefore, the green product market should set its product differently from its competitors. This can be emphasized th-rough its different package, unique advertisement, and unique product appearance without turning aside its message or identity where the product is environmental friendly or energy efficient. So that consumers who purchase the product will feel that they have to help preserve the environment, or have been saving energy consumption. And if the product offered is addressed to women, it is necessary to observe any possible additional variable; those are women who have a big expenditure more than 2 million per month. For further strategic implementa-tion is discussed in the following secimplementa-tion.
Referring to the selected segment, the selected product ought to be relevant with today’s modern and dynamic style, because one of the characte-ristics of the selected segment is that age less or up to 40 years. In this category, potential buyers are those who are on their productive and mobile age. Informative product is an obligation hence the potential buyers in this age range are close with information, they are familiar with cyberspace.
Mo-reover, other segment characteristic is education: Diploma/Bachelor/Master holders. CHAID analysis results explain that both men and women can be the potential buyers for the green product with the additional variable for women, big expenditure with more than 2 million per month. Therefore, it is de-terminable from the beginning whether the product was created for multigender or intended for men or women only. If the product is intended for men and or multigender, then the target marketing is a wide differentiation strategic. This strategic is applied when the benefit of the product is differentiated or different with other competitors’ products. The pro-duct may be in a high price because it comes from the professional research & development (R&D) divisions to achieve a product differentiation, the expensive cost of the target can be covered with a large market, while companies continue to improve themselves to tighten the cost in order to make a greater profit. If the product is offered for women, then the product must have a particular style. That doesn’t mean feminism is needed to be shown, but it is needed to make women take their choices whether to buy or not to buy a product. Women tend to buy a product based on recommendations of friends, family or other people, they are like detective, firstly, they have to know the profit and benefit of certain items before purchasing it, espe-cially highly educated women. The products should be able to recommend themselves. Women are also concerned with shape, color, packaging and others associated with a particular style that is able to build a certain perception. Therefore, products must be designed as beautiful as possible, unique, and so forth. Women are also easily attracted to an additional bonus when buying a particular product, although that additional product is not needed, or not at all useful. The important thing is they feel like gaining some advantage rather than buying another product without any bonus. Therefore, once again, the products to be marketed in green product should really add additional values in order to satisfy consumers.
In terms of marketing green product, pricing or price Therefore based on the tabulation results of table 4
it is found out that the first segment has the largest percentage of potential buyers (100%), neverthe-less, the third segment has the most total number of potential buyers compare to the other four segments. The first segment has a characteristic of age less or up to 40 years, Diploma/Bachelor/ Master holders, and female with big expenditure more than Rp. 2 million per month, while the third segment has a characteristic of age less or up to 40 years, Diploma/Bachelor/Master holders, and male. Here can be seen that the two segments have the equation in the age variable (less than or up to 40 years) and education variable (Diploma/Bachelor/ Master holders). And the difference starts from the sex variable. Based on the results of CHAID analysis, it turns out that male’s variable is not determined by the big expenditure per month, while female’s variable still can be classified based on the big ex-penditure per month. In other words, men are the potential buyers for the green product regardless how big their expenditures are, whereas for wo-men, they can be a potential buyer for the green product when the big expenditure is more than Rp. 2 Million per month. These results show us that job, occupation and marital status are irrelevant with the target of green product’s marketing.
Marketing of the green product has good prospects for this present day and future. As predicted, for
this product the number of potential buyers will continue to grow. This is due to:
• Environmental conservation cannot be
com-promised any longer, this effort is essential and absolute to be done for all mankind, so it’s not only the responsibility and obligation of the scientist nor for the government. This effort of environmental conservation will continue to be pursued and campaigned in order to be implemented by all mankind. It will become a lifestyle.
• Higher education will give knowledge and
awareness to consumers about the importance of environmental conservation, which will then affect their lifestyle and consumption pattern.
• The energy that gets more expensive day by
day will bring the people to finally think about cost-saving, which will also encourage them to choose products that are energy efficient.
Companies that intend to produce green product need to be fully supported by the professional re-search & development divisions (R & D), because the green product requires a continuous assess-ment in technology in order to produce products that can be categorized as green product, and surely to meet customers’ expectation. The expenditure occurred is not small. For that reason, the competi-tion on this field is only for those companies that have huge financial to be able to finance the R &
Tabel 4. Tabulation of Green Product Potential Buyer and Non-potential CHAID Analysis Result
seems to be quite sensitive if the segmentation is addressed for women, considering the presence of a big variable expenditure more than 2 million per month for women. But it is not hard if the segmen-tation is addressed for men. Potential buyers can receive a higher price as long as they feel satisfy with the profit or benefit gained from the green product. Companies can set their prices high, while continu-ing to do the research to keep the production cost, in order to make a greater benefit. Moreover, basically the production cost of green product is quite high, considering producers will need to do the research and keep on developing to make the green product. But if consumers were disappointed as they did not get the products as promised, then that product will soon be abandoned because consumers will feel like they have been cheated, they did not get any benefit for the money they had spent.
Suitable promotions with the selected segment are suggested to fulfill a few things, as follows:
• Complete information, considering the
seg-ment is a group of consumers who have higher education (Diploma/Bachelor/Master holders). Information can be offered through brochures, catalogs, packaging, etc. If necessary have a website on the internet, so it would be easier for the potential buyers to get the information needed about the product.
• Be consistent in giving friendly messages
about the environment, this purpose will lead the potential buyers to buy some products. Therefore, they need to be convinced about the value consistently, because if a product is set to enter the market of green product, there is no cancelation and we cannot change market’s direction. If not, then the product will be abandoned.
• In sales, if necessary, place the sales force
directly (personal selling). Additionally sa-lesperson may play the role as consultant to explain how that product can help consumers to prevent environmental damage.
CONCLUSION
Research result of green product marketing, using CHAID analysis generates five potential buyer, as follows:
• Potential buyer of age < 40 -year -old, education
of Diploma/Under/Post graduate, female with monthly expenditure of > Rp. 2 Million.
• Potential buyer of age < 40 -year -old, education
of Diploma/Under/Post graduate, female with monthly expenditure of < Rp. 2 Million.
• Potential buyer of age < 40 -year -old, education
of Diploma/Under/Post graduate, male.
• Potential buyer of age < 40 -year -old, education
of High School/Equal or below.
• Potential buyer of age >40 -year -old.
From the result of the analysis mentioned above, there are several managerial implications made into consideration in making decision, as follows: 1. The first segment need to be prioritized in
the green product marketing target is those potential customer with the following group classifications: Age segment of less or equal to 40-year-old female, education of Diploma/ Under/Post graduate, with monthly expenditure of over Rp. 2 Million;
2. Second target need to be worked out is the group of potential customer with the following classification: Age segment of less or equal to 40-year-old male, education of Diploma/ Under/ Post graduate, male;
3. It is recommended that green product marke-ting to adapt product differentiation strategy targeting the niche market or combination between market specialization and product specialization towards segmentations men-tioned above
4. Green product marketing may ignore the vari-ables of occupation, field occupation, and marital status for the reason that those variab-les do not have any significant correlation with green product potential buyer.
R E F E R E N C E S
______, ______ 2005, Introduction to climate change and water, [online] Available: http://www.ipcc.ch/pdf/technical-papers/ ccw/chapter1.pdf [2009, April 10]
______, ______ 2008, Consumers Buying Green Despite Battered Economy - Survey, [online] Available: http:// sustainablebusiness.com/index.cfm/go/news. display/id/17631 [2009, April 10]
______, ______ 2008, Climate Change and Consumers: The Challenge Ahead, EcoAlign [online] Available: http://www. ecoalign.com/news/ecopinion/ climate-change-consumers [2009, April 10]
______, ______ 2008, Going Green: When “Making a Difference” Aligns with Market Demand, Aberdeen Group [online] Available: [2009, April 10]
______, ______ 2009, Global warming, [online] Available: [2009, April 10]
______, ______ 2009, Green marketing, [online] Available: http://en.wikipedia.org/ wiki/Green_marketing [2009, April 10] Antipov, E. 2010. Applying CHAID for Logistic Regression Diagnostic and Classification Accuracy Improvement. Munich
Personal RePEc Archive, Paper No. 21499
Avro, S. R. 2009, Survey: Consumers Willing to Buy Green Products, but only if Saving Money, [online] Available: [2009, April 10]
Belch, G. E. dan Belch, M. A. 2007, Advertising and Promotion An Intregated Marketing Communications Perspective, 7th
edition, McGraw Hill Companies, Inc., New York
Bloom, J. Z. 2005. Market Segmentation, A Neural Network Application. Annals of Tourism Research. Vol 32, No. 1 Cravens, D. W. dan Piercy, N. F. 2006, Strategic Marketing, International edition, McGraw Hill Companies, Inc., New York Engel, James. 1994, Perilaku Konsumen, Jilid 1 Edisi Keenam. Binarupa Aksara. Jakarta.
Gallagher, C. A. 2000, An Iterative Approach to Classification Analysis, [online] Available: www.casat.org/library/ retemaking/90dp237.pdf [2008, Desember 30]
Hoare, R. 2004. Using CHAID for Classification Problems. New Zealand Statistical Association 2004 Conference, Wellington Kotler, P. dan Keller, K. L. 2006, Marketing Management, 12th edition, Pearson Education, Inc., Upper Saddle River, New Jersey
Kusakci, S. 2010. Segmentation of Student Markets, A CHAID-Based Analysis. 6th International Student Conference, Izmir
University of Economics, Turkey
Lehman, D. R. dan Winer, R. S. 2005, Analysis forMarketing Planning, 6th edition, McGraw Hill Companies, Inc., New York
Lehman, T. dan Eherler, D. 2001, Responder Profiling with CHAID and Dependency Analysis, [online] Available: www. informatik.uni-freiburg.de/~ml/ecmlpkdd/ WS-Proceedings/w10/lehman.pdf. [2008, Desember 30]
Levine, D. M., Stephan, D., Krehbiel, T. C. dan Berenson, M. L. 2005, Statistics for Managers, 4th edition, Pearson Education, Inc.,
Upper Saddle River, New Jersey
Murdiyarso, Daniel 2003, Protokol Kyoto Implikasinya Bagi Negara Berkembang, Kompas, Jakarta. Nelson, C. 2010. Market Segmentation. Foreseechange Publication
Ramaswami, M and Bhaskaran, R. 2010. A CHAID Based Performance Prediction Model In Educational Data Mining. International Journal of Computer Science Issues, Vol 7, Issue No. 1
Rusbiantoro, Dadang 2008, Global Warming For Beginner, Pengantar Komprehensif Tentang Pemanasan Global. O2, Yogyakarta.
Setiawan, Nugraha 2006, Proyeksi Penduduk Kota Bandung 2005-2025. Universitas Padjadjaran, Bandung. [online] Available: http://pustaka.unpad.ac.id/wp-content/uploads/2009/03/proyeksi_penduduk_kota_bandung_2005_2025.pdf [2009, Januari 20]
Steenkamp, J.E.M and Hofstede, F.T. 2002. International Market Segmentation; Issues and Perspectives. Tilburg University and Carnagie Melon University
Surya, T. M. 2009, Tenggelam Dalam Janji Pemerintah, WALHI [online] Available: http://www.walhi.or.id/websites/index.php/ in/kampanye/pengelola anbencana/79-banjir-dan-longsor/92-tenggelam-dalam-janji-pemerintah- [2009, April 10] Thomas, J.W. 2007. Market Segmentation. Decision Analyst, Arlington, Texas, USA
Thompson, A. A., Strickland, A. J. dan Gamble, J. E. 2008, Crafting and Executing Strategy: The Quest for Competitive
Advantages: Concepts and Cases, 16th edition, McGraw Hill Companies, Inc., New York