POLICY PAPER
Benchmarking, Social Partnership and Higher
Remuneration: Wage Settling Institutions and
the Public-Private Sector Wage Gap in Ireland
ELISH KELLY*
SEAMUS MCGUINNESS PHILIP O’CONNELL
Economic and Social Research Institute, Dublin
Abstract: This paper uses data from the 2003 and 2006 National Employment Surveys to analyse the public-private sector wage gap in Ireland. In particular, we investigate the impact of awards implemented under a number of wage setting institutions on the pay differential. These include the pay increases awarded by the Public Service Benchmarking Bodyin its first report and the increases given to higher-level posts in the public sector by the Review Body on Higher Remuneration in the Public Sector, Reports No. 40 and 41. The pay increases that were awarded under the Social Partnership process in Sustaining Progress and the Mid-Term Review of Part Two of Sustaining Progressare also captured in the data used. Furthermore, we assess the impact of pensions on the gap. The results indicate that the public sector pay premium increased dramatically from 9.7 to 21.6 per cent between 2003 and 2006. Furthermore, we found that by 2006 senior public service workers earned almost 8 per cent more than their private sector counterparts, while those in lower-level grades earned between 22 and 31 per cent more. The public premium results derived in this paper relating to March 2006 predate the payment of the two most recent Social Partnership wage deals, along with the pay increases awarded in the second Benchmarking exercise and by the Review Body on Higher Remuneration in Reports No. 42 and 43. The results presented raise serious questions with respect to the justification for any further boosts to the pay levels of public sector workers. Finally, the study highlights the importance of correcting for differences in pension coverage between public and private sector workers when making any assessment of the public-private sector pay differential.
339
I INTRODUCTION
O
ver the last decade, there has been a great deal of discussion about pay levels in the public sector in Ireland, and in particular about how wage rates in this sector compare with those in the private sector. From a policy perspective, there are a number of reasons why the relationship between pay in the public and private sectors is of importance. First, policy-makers must ensure that pay rates in the public sector are of a sufficient level to attract and retain individuals with the qualifications and skills required to deliver good quality public services. Second, wage levels in the public sector should not lead the private sector, as such a scenario will have potential knock-on affects on an economy’s competitiveness (via wage inflation). Third, a significant gap between public and private sector wages will influence competition for workers between both sectors. The consequence of this is that the private sector will be ‘crowded-out’ unless private sector wages increase. Finally, as the public sector wage bill is financed through taxation, in situations where an economy is fiscally constrained, governments must ensure that scarce tax resources are used optimally.The current downturn in the Irish economy, and the consequential sharp deterioration in the public finances, has propelled the issue of public sector pay levels, and relativities with private sector wages, to the fore as a policy issue. Since the beginning of the current decade, much of the debate on public sector pay in Ireland has focused on the wage processes that have awarded public sector workers considerable pay increases. In particular, the work of the Public Service Benchmarking Body (PSBB) has received much attention. A number of studies (Ruane and Lyons, 2002 and O’Leary, 2002) questioned the awards made by the PSBB in its first report (June 2002) on the basis that the Body provided no evidence that public sector workers pay lagged behind their private sector counterparts. The researchers argued instead that public sector workers enjoyed a wage premium at this time, an assertion that has been subsequently supported by empirical evidence (Boyle, McElligot and O’Leary, 2004). A second benchmarking report was produced in December 2007 which recommended pay increases to public servants in more senior positions. However, as with the first report, there was some doubt surrounding the extent to which public sector pay levels lagged behind the private sector.
under the national Social Partnership pay agreements. The national wage deals apply to the private sector as well, where wages have not been agreed on at the local level. However, a smaller proportion of private sector workers are covered by the national pay deals (Barrett, Callan and Nolan, 1999 and McGuinness, Kelly and O’Connell, 2008).
Given the importance of the public-private sector wage gap, particularly in the current economic climate, the principal objective of this paper is to identify the impact that the three wage determination mechanisms discussed above – Benchmarking, the Review Body and the national pay deals – have had on the public-private sector wage differential in Ireland between 2003 and 2006. In particular, we investigate the effects of the following on the public-private sector wage gap: (i) the pay increases that were awarded to public servants under the first Benchmarking exercise, (ii) the increments given to higher-level posts by the Review Body in Reports No. 40 and 41, and (iii) the wage increases that were agreed by the social partners in the Sustaining Progress and the Mid-Term Review of Part Two of Sustaining Progress national pay deals. The public-private sector wage gap is analysed in terms of the overall differential and across the earnings distribution. Data from the 2003 and 2006 National Employment Surveys (NESs), a survey conducted by the Central Statistics Office (CSO), are used to undertake this analysis. The 2003 National Employment Survey (NES) data captures earnings prior to the increases given by the PSBB, the Review Body and the national wage agreements, and the 2006 data earnings post the implementation of these three wage-setting rounds. We also undertake a decomposition analysis, based on the 2006 NES data, in order to identify the proportion of the variation in earnings between public and private sector employees that is due to differences in observable characteristic between the two sectors and the share that is due to differences in the returns to these attributes between the two sectors.
A secondary aim of the paper is to asses the sensitivity of the public-private sector wage differential to certain obvious adjustments. Specifically, using information available in the 2003 NES, we assess the impact of differences in pension coverage on the pay gap.
II CONTEXT AND LITERATURE
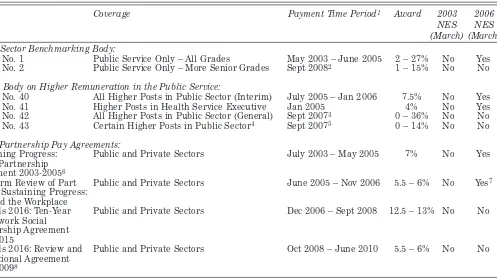
Table 1 sets out the various pay increases that public sector workers have been awarded between 2003 and 2008 from Benchmarking, the Review Body and the national wage deals. As indicated in Section I, the data that we use in this paper allows us to capture the impact of payments made under each of these three wage determination mechanisms between 2003 and 2006. However, we are unable to identify the impact of the pay increases that have been awarded to public sector workers since 2006, under each of the three wage setting processes mentioned above, as they fall outside the capture period of our data. Thus, the wage increases that public sector workers have received since 2006, which are set out in Table 1, should be borne in mind when evaluating the results that are presented later in the paper. We now give a brief description of the various processes that have given public sector workers pay increases between 2003 and 2006.
2.1 The Public Service Benchmarking Body (PSBB)
In June 2000, the Public Service Benchmarking Body (PSBB) was established in Ireland to examine and make recommendations on the pay levels of all key grades in the public service1 in comparison with equivalent positions in the private sector.2 The establishment of the PSBB was a provision in the Programme for Prosperity and Fairness(PPF),3the fifth Social Partnership agreement.4 The Body’s formation came about as a result of a recognition by the Government and social partners that the traditional approach to pay determination in the public service, which was predominately based on cross-sectoral relativities, had become unsustainable. In particular, pay increases were being progressively awarded to some grades without justification, which in turn led to pay demands from other groups within the sector. The upshot of this chain of pay claims, based on relativities, was the creation of substantial industrial relations problems around the end of the 1990s (e.g. the Garda blue flu). Discontent among public sector workers that
1See Public Service Benchmarking Body (2002), Appendix A for a list of the public sector grades covered by the PSBB.
2 Craft workers and general operatives in the public sector are covered by a Parallel
Benchmarking Processand not by the PSBB. This process produced increases of about 17 per cent in its first report. A second process is currently underway (Department of Finance, 2008). 3Framework I, Annex II (page 39).
PUBLIC-PRIV
A
TE SECTOR W
A
GE GAP
IN IRELAND
343
NES NES
(March) (March) Public Sector Benchmarking Body:
Report No. 1 Public Service Only – All Grades May 2003 – June 2005 2 – 27% No Yes Report No. 2 Public Service Only – More Senior Grades Sept 20082 1 – 15% No No
Review Body on Higher Remuneration in the Public Service:
Report No. 40 All Higher Posts in Public Sector (Interim) July 2005 – Jan 2006 7.5% No Yes Report No. 41 Higher Posts in Health Service Executive Jan 2005 4% No Yes Report No. 42 All Higher Posts in Public Sector (General) Sept 20073 0 – 36% No No
Report No. 43 Certain Higher Posts in Public Sector4 Sept 20075 0 – 14% No No
Social Partnership Pay Agreements:
Sustaining Progress: Public and Private Sectors July 2003 – May 2005 7% No Yes Social Partnership
Agreement 2003-20056
Mid-Term Review of Part Public and Private Sectors June 2005 – Nov 2006 5.5 – 6% No Yes7
Two of Sustaining Progress: Pay and the Workplace
Towards 2016: Ten-Year Public and Private Sectors Dec 2006 – Sept 2008 12.5 – 13% No No Framework Social
Partnership Agreement 2006-2015
Towards 2016: Review and Public and Private Sectors Oct 2008 – June 2010 5.5 – 6% No No Transitional Agreement
2008-20098
Notes:1 Payment information obtained from various Department of Finance circulars (Department of Finance, 2003-2008).
2 Five per cent of recommended awards to be paid on September 1 2008. Payment of balances to be discussed in the context of a successor to
recent Partnership deal.
3 Five per cent of the recommended increases were paid on September 1 2007, with all pending increases to be reviewed in September 2010.
4 Continuation of Report No. 42 that covers posts in the Labour Court, Labour Relation Commissions, State Solicitors and Universities.
5Same dates as those applying to Report No. 42 (Review Body on Higher Remuneration in the Public Sector,July 2008).
6 Pay pause for the first six months of this agreement with first phase paid on January 1 2004.
7The third phase of this agreement (2.5 per cent) is not captured in the 2006 NES data as it was paid on 1 June 2006.
pay levels in the private sector were above the norms set in the Programme for Competitiveness and Worknational pay agreement5added further fuel to the growing industrial relations unrest that took place at this time (PSBB, 2007). Specifically, public servants felt that their private sector counterparts were benefiting more from the significant economic growth that was taking place in the country at that time. Thus, the Benchmarking process was established by the government and social partners to institute a new method of pay determination in the public service and also to ensure equity between public and private sector workers.
After undertaking a comprehensive assessment of the jobs, pay and conditions of both public and private sector workers, the PSBB delivered its first report in June 2002 in which it recommended varying levels of pay increases, ranging from 2 to 27 per cent, and averaging 8.9 per cent for the 138 public service grades examined.6The grades covered included administrative/ clerical grades, civil servants, local authority workers, the Gardai, teachers, nurses, other health professionals and the defence forces. Following full implementation of the recommended increases, it is estimated that the extra cost to the Exchequer has been €1.2 billion per annum (PSBB, 2007).7 The Government and social partners agreed to a second Benchmarking exercise in 2004,8 which resulted in a subsequent report being published in December 2007. On this occasion, after taking explicit account of the fact that public service pensions are more valuable than those in the private sector,9the PSBB found that the pay levels of only a few of the more senior public service grades lagged behind their private sector counterparts. Specifically, pay increases were only recommended for 15 of the 109 grades analysed, at an estimated annual cost of €50 million on full implementation.10
5Third Social Partnership agreement.
6 The pay increases that were recommended, which were to be linked to public sector modernisation plans, affected the pay levels of 230,000 public servants (PSBB, 2002).
7 The pay increases were introduced on a phased basis. One-quarter of the increases were backdated to 30 November 2001, a provision that had been agreed on by the government and social partners in December 2000. This first payment was sanctioned in May 2003, thus, it is not covered in the 2003 NES earnings data. The second phase, which covered half of the recommended increases, was paid on 31 December 2003 and the final phase was paid on 31 May 2005. 8During the negotiations of the Mid-Term Review of Part Two of Sustaining Progress (Department of the Taoiseach, 2004).
9The PSBB discounted private sector workers pay rates by 12 per cent to take account of the superior value of public service pensions (PSBB, 2007).
10 In the most recent Social Partnership agreement, Towards 2016: Review and Transitional
2.2 The Review Body on Higher Remuneration in the Public Sector
The Review Body on Higher Remuneration in the Public Sector,11hereafter referred to as the Review Body, was established in May 1969 to advise the government on the pay levels of the top posts in the public sector, such as members of the government, ministers of state, senior civil servants outside the scope of the civil service conciliation and arbitration scheme,12 the judiciary and so on.13 Since its establishment, the Review Body has, by and large, conducted a general review of the remuneration levels of the posts under its remit every four years. A general review was due in 2004. However, the Minister for Finance at the time decided that the next report by the Review Body should coincide with the PSBB’s second benchmarking report. Thus, the 2004 general review was postponed until 2007.14 Nevertheless, in April 2005 the Government asked the Review Body to examine the pay levels of the public sector posts covered by it to identify if their wages had fallen behind their private sector counterparts since the last general review was conducted in 2000 and, if so, to recommend an interim increase to rectify them.15The Review Body was asked to report within two months (June 2005), consequently, the Body decided to examine the pay movements of the groups within its terms of reference as opposed to individual posts. In its examination, the Review Body found that the pay levels of the public sector groups covered by it had significantly fallen behind their private sector counterparts. Consequently, in their interim report, Report No. 40, the Review Body recommended a 7.5 per cent interim increase to basic salary for all the groups within its remit. Half of the recommended increase was paid on 1 July 2005 and the balance on 1 January 2006. A second interim report was produced at the end of 2005, Report No. 41, which covered certain higher-level positions within the Health Service Executive. In this report, the Review Body recommended that a 4 per cent increase be given to the posts examined, which was paid on 1 January 2006.
The general review report by the Review Body, Report No. 42, was published in September 2007. This covered all the individual posts within the
11Also referred to in the literature as the “Buckley Review Group”. 12Including secretaries general of government departments.
13The salaries of chief executives of commercial state bodies and members of the House of the Oireachtas are no longer covered by the Review Body, since 1999 and 2005 respectively. See Review Body on Higher Remuneration in the Public Sector (2007) for an up to date list of the posts covered by the Review Body.
14In the future, the two payment exercises will be conducted at the same time (Review Body on Higher Remuneration in the Public Sector, 2005).
Body’s terms of reference, as opposed to the broad public sector groupings. As with the PSBB in its second Benchmarking exercise, the Review Body took explicit account in the 2007 general review of the fact that public sector pensions are substantially more valuable than those in the private sector.16In doing this, the Body still found that some of the posts within its remit lagged behind comparable positions in the private sector and, therefore, recom -mended pay increases that ranged from zero to 36 per cent. A second general review report, Report No. 43, was produced in July 2008, which covered certain higher-level public sector positions (for example, posts in the Labour Court and State Solicitors) that could not be covered in the 2007 general review. The awards recommended in this report ranged from zero to 14 per cent. Five per cent of the increases in both of the general review reports were paid on 1 September 2007. However, given the current economic climate, payment of all pending awards has been suspended and will be reviewed in September 2010.17
2.3 Social Partnership Pay Agreements
Over the last decade and a half, the main mechanism that has determined public sector workers’ wages has been the national pay agreements that have been negotiated under Social Partnership.18There have been nine pay deals to date, the most recent of which was agreed in October-November 2008. In the early days of Social Partnership modest wage increases were agreed on by the social partners in return for income tax reductions to boost take home pay, because of the bleak economic situation that the country was in when the pay agreements were first negotiated. However, as the economy recovered and moved into the ‘Celtic tiger’ era, larger pay increments were given in the national pay deals.
The pay agreements apply across both the public and private sector. However, as union density is lower in the private sector, a smaller proportion of workers in this sector are covered by the pay deals (Fitz Gerald, 1999). This aside, there are also clauses attached to the application of the pay increases in the private sector. Specifically, the recommended increases are negotiated between employers and unions “… with due regard had to the economic, commercial and employment circumstances of the particular firm, 16In the 2007 general review, the Review Body discounted private sector salaries by 15 per cent to account for the anomaly in the value of pensions between the posts within its remit and their equivalent counterparts in the private sector (Review Body on Higher Remuneration in the Public Sector, 2007).
17In July 2008, the Taoiseach announced that ministerial and parliamentary office-holders would not receive any of the payments that were awarded to them in the 2007 general review and that this decision would be reviewed in September 2010.
employment or industry, whether arising from exchange rate movements or otherwise” (Sustaining Progress, p. 75).19 Thus, the pay increases are not automatically awarded in the private sector as they are in the public sector. In addition, private sector employers can claim inability to pay the terms of the national wage agreement if its implementation would result in a serious loss of competitiveness or employment in the firm in question. This clause in the private sector component of the pay agreements is increasingly likely to be invoked by employers given the current economic environment. Of course, pay deals in excess of the terms of the national agreements may also be negotiated in the private sector.
Sustaining Progress and theMid-Term Review of Part Two of Sustaining Progressare the two pay agreements that are covered by the data used in this paper. The former pay deal awarded workers 7 per cent, which was paid in three phases between 1 January 2004 and 1 December 2004, while the latter wage agreement gave workers a 5.5 per cent increase in basic pay20between 1 June 2005 and 1 June 2006.21The two subsequent pay deals, not covered by the data used in this study, are Towards 2016 and Towards 2016: Review and Transitional Agreement 2008-2009. The Towards 2016 pay deal awarded workers between 12.5 and 13 per cent, paid between 1 December 2006 and 1 September 2008, while under the latter agreement, which is the most recent, workers are to receive between 5.5 to 6 per cent over a 21 month period.
2.4 Literature
Gregory and Borland (1999) provide a comprehensive review of international empirical studies of the public-private sector wage differential between the early 1980s and mid-1990s. Examining research using Ordinary Least Square (OLS) earnings models with a public sector dummy variable, they report a significant positive premium for an extensive range of countries ranging from 3 to 11 per cent.22There were, however, some exceptions with the wage gap estimated to be 21 per cent in Japan and –7 per cent in Norway. Also, some studies for the United States reported a small negative public sector effect, specifically for state and local government employees.23 Gregory and
19This private sector pay clause applies in all the pay agreements.
20For those below a certain income threshold level, a 6 per cent pay increase was awarded. 21The third phase of this agreement, which consisted of a 2.5 per cent increase in basic pay, is not captured by the data used in this paper as the payment was implemented on 1 June 2006 and the 2006 NES data relates to March.
22The public sector pay gap in Ireland between 1988 and 1991 was estimated to be 8.9 per cent (Gregory and Boland, 1999).
Boland’s (1999) review also shows that the results from the OLS studies were supported by the findings from research that used decomposition-type techniques. Furthermore, their analysis of the literature revealed that the public sector pay premium was greater for females than for males24and that, based on quantile regression (QR) analysis, the wage advantage was larger for public sector employees at the bottom of the earnings distribution than for those at the top. In relation to the latter finding, researchers in the United Kingdom (UK) found that the public sector wage advantage for male employees went from being considerably positive at the lower end of the earnings distribution to being a slight penalty at the very top (Gregory and Boland, 1999).
For the most part, the findings from more recent research on the public-private sector pay gap echo those from Gregory and Borland (1999).25 For example, Lucifora and Meurs (2006) estimated that the public sector premium in France, Italy and the United Kingdom in 1998 was between 4 and 6 per cent; premia that are quite similar to the wage advantages found in the 1980s and early 1990s. As with previous studies, Lucifora and Meurs (2006) found that the premium was greater for female public sector employees than for males.26 Interestingly, Jürges (2002) and Melly (2005) both found a pay penalty for male public sector employees in Germany but a premium for females. Similar results were found by Cai and Liu (2008) for Australia. Lucifora and Meurs (2006) QR analysis reproduced the same pattern of results reported in earlier research, namely that the public sector pay premium declines as one moves up the earnings distribution with no wage advantage at the very top.27 The same pattern was found by Jürges (2002) for German public sector workers. Lucifora and Meurs (2006) research also revealed that the premium across the earnings distribution was larger for females than for males. Both Jürges (2002) and Melly (2005) obtained the same result for Germany. Melly (2005) also found that the premium observed for males and females at the bottom of the income distribution turned into a discount at the top but that the pay penalty was much larger for males. Jürges (2002) got a similar effect for males as Melly (2005) but an insignificant return for females at the top of the earnings distribution. Cai and Liu (2008) found similar gender income distribution results as Jürges (2002) for Australian public sector employees.
24For example, for the UK Disney and Gosling (1998) reported that male public sector workers earned 4 per cent more compared to their private sector counterparts whereas females earned an additional 19 per cent.
25One exception is Adamchik and Bedi (2000) who find a private sector wage advantage in Poland. 26See Mueller (1998, 2002) for similar evidence for Canada.
In terms of the Irish literature, a number of recent studies have analysed the public-private sector wage differential.28 Using microdata from the European Community Household Panel Survey (ECHP), Boyle, McElligot and O’Leary (2004) investigated the wage differential29 over the 1994 to 2001 period and found that public sector workers earned between 10 and 17 per cent more than their private sector counterparts, with 13 per cent the estimated gap for 2001. These estimates are much larger than those found in similar studies in other countries, as is evident from the literature discussed above. Boyle et al. (2004) also examined variations in the public sector premium across the earnings distribution. Their results showed that the premium was greatest for low-paid workers and smallest for public sector workers at the top of the earnings distribution, results which are in line with what has been found internationally.
Focusing on third-level graduates, O’Connell and Russell (2006) found that in 2004 such individuals employed in the public sector earned 9 per cent more per month than their counterparts in the private sector, with the hourly premium estimated at 20 per cent. The inclusion of bonuses reduced the monthly premium to 7 per cent.
The most recent evidence on the public-private sector pay gap in Ireland comes from the econometric study that was undertaken as part of the second Benchmarking exercise.30Using data from the 2003 NES, the study showed that public sector employees earned between 6 and 10 per cent more in weekly earnings than their private sector counterparts, with the premium of the order of 2 to 6 per cent among males and 10 to 15 per cent among females (Ernst & Young and Murphy, 2007).31The analysis also looked at variations across the earnings distribution and found that the public sector premium declined at the upper end of the distribution,32turning into a discount at the very top, with males experiencing a larger penalty than females. The findings from this most recent research on the public-private sector pay gap in Ireland are in line with a number of international studies.
Each of the Irish studies cited above have found, after controlling for various wage determining characteristics, that public sector workers earn substantially more, on average, than those in the private sector. In addition,
28See Ruane and Lyons (2002) and O’Leary (2002) for evaluations of the Benchmarking process and the first report produced by the PSBB.
29Using gross monthly wages as the dependent variable.
30The study did not contribute directly to the pay recommendations that were made in the second report as the data used did not give a breakdown of earnings by grade levels. As with the first Benchmarking exercise, the pay recommendations in the second Benchmarking report were based on a comprehensive job evaluation scheme and a private sector salary survey.
the research also shows that low-paid public sector workers tend to enjoy the highest premiums. While the data used in these studies will have captured some of the pay increases awarded under the Social Partnership pay deals, none of the research covers the time period following the implementation of the increases awarded under the first PSBB report or the rewards from the Review Body reports discussed above, Reports No. 40 and 41. Thus, no study has, as yet, considered the impact of these two wage determination processes on the public-private sector wage differential. Furthermore, the previous research did not take explicit account of the impact of differences in pension coverage33 on the wage premium. Consequently, this present paper seeks to add to the Irish literature in this area by addressing each of these issues in turn.
III DATA AND METHODOLOGY
The data used in this study come from the 2003 and 2006 National Employment Surveys (NESs). The NES is a workplace survey, covering both the public and private sectors, which is carried out by the Central Statistics Office (CSO). The employer sample is drawn from the CSO’s Central Business Register. Selected firms are then asked to extract a systematic sample of employees from their payrolls.34 Approximately 89,000 employees were included in the 2003 NES survey and 78,860 in 2006. In keeping with Ernst & Young and Murphy (2007), the econometric study that formed part of the second Benchmarking exercise, we restrict our sample to full-time, permanent employees who are aged between 25 and 59 years, and exclude semi-state body employees.35 After these restrictions and exclusions, our final 2003 NES sample consisted of 29,232 employees, while the 2006 sample was 32,239. We apply cross-sectional weights to our data in order to ensure that our results are representative of the population of working age employees.
As well as including information on earnings, hour’s worked (including overtime) and sector (public or private), the NES also contains a rich range of controls that are required to estimate the standard sorts of earnings models that are employed in the public-private sector wage gap literature. This
33The econometric study that formed part of the second Benchmarking exercise could have taken account of the impact of pensions as such information is available in the 2003 NES data used. 34Only employers with more than three employees are surveyed and the data are collected at the enterprise level. While the NESs are of enterprises with 3 plus employees, the results are calibrated to the Quarterly National Household Survey (QNHS) employment data for employees (excluding agriculture, forestry and fishing), which covers all employees.
includes various educational and personal characteristics, such as educational attainment, gender, work experience and occupation, along with detailed job (supervisory responsibilities, professional body membership, shift-work) and organisational (sector, trade union membership, firm size) information. The earnings information collected in the NES represents the gross monthly amount payable by the organisation to its employees, and relates to the month of March in 2003 and 2006. This includes normal wages, salaries and overtime; taxable allowances, regular bonuses and commissions;36and holiday or sick pay for the period in question. It does not include employer’s Pay Related Social Insurance (PRSI), redundancy payments and back pay.
In terms of methodology,37we begin by estimating standard OLS earnings regressions with a public sector dummy variable included in the specification to identify what the overall public sector wage premium/discount is, controlling for a range of other important wage determining characteristics. This earnings equation can be written as follows:
Wi= βXi+ γsectori+ εi (1)
where Wi is the log weekly earnings of employee i, Xi is a set of controls for productivity-related and job characteristics of employee i (e.g. education, experience, occupation, etc), β measures the return to each of the character -istic controls, sectori is a dummy variable that captures the employee’s work sector and γ measures the return to the employee’s sector of employment, that is, the public sector premium/discount.
We then use QR, again with a public sector dummy variable included, to identify how the premium/discount varies across the earnings distribution. This methodology has become standard in the public-private sector pay gap literature as it allows one to estimate the returns to an employee’s sector of employment at different points along the wage distribution; thus, QR enables researchers to identify if the public sector premium/discount varies over the income distribution. In this paper, we estimate the returns to public sector employment at the 10th, 20th, 30th, right up to the 90th percentile.
Finally, we use an Oaxaca-Blinder decomposition to separate out the variation in earnings between public and private sector employees into (i) differences in average productivity-related and job characteristics between the
36It is likely that the peak of commission remuneration received by private sector workers over the last few years is captured by the data used in this study.
two sectors, and (ii) differences in the returns to these attributes between the sectors.
The Oaxaca-Blinder decomposition can be written as follows: _____ ______ _____ _____
^ ^ ^ Wpub– Wpriv= (Xpub– Xpriv) βpriv+ (βpub–βpriv)
__
Xpub+ αpub–αpriv= E + C+ U (2) _____ _____
^ The first term on the right hand side of Equation (2), (Xpub – Xpriv) βpriv, measures the amount of the public sector wage gap that is due to differences in the characteristics of workers in the two sectors (endowments effect {E}). The second term, (β^pub – β^priv)X¯¯pub, captures the degree to which public and private sector employees holding similar characteristics are treated differently in the labour market, in terms of the return to each characteristic (coefficient effect {C}). The third term, αpub – αpriv, is the component that measures the difference in public and private sector employees earnings that is not due to any differences in their observable characteristics or returns to these characteristics (shift effect {U}). In this decomposition analysis, the private sector is treated as the reference group on the basis that employment in this sector is much larger than the public sector, and also because wages in the private sector are largely driven by market forces (Jürges, 2002).38
As well as estimating an overall employee model, for both our OLS and QR analyses, we also estimate separate male and female models to see how the premium/discount differs by gender. Our dependent variable is the log of gross weekly earnings. It should be noted that the methodologies employed in this paper are based on the standard approaches in the international literature to the comparison of earnings, and are similar to those adopted in the econometric study of the 2003 NES data prepared for the second Benchmarking report (Ernst & Young and Murphy, 2007).
38We are conscious of the identification problem that exists in the use of dummy variables in decompositions where the number of categorical dummies exceeds one (Oaxaca and Ransom, 1999). Specifically, it is not possible to estimate the relative effects of any particular dummy variable, as the impacts will change depending on the reference category used. To deal with this issue, we follow Gardeazabal and Ugidos (2004) and estimate the decompositions imposing a normalising restriction on each set of dummy variables. The normalisation of the restriction on the coefficients can be written as follows:
j
兺
βjg= 0j=1
IV RESULTS
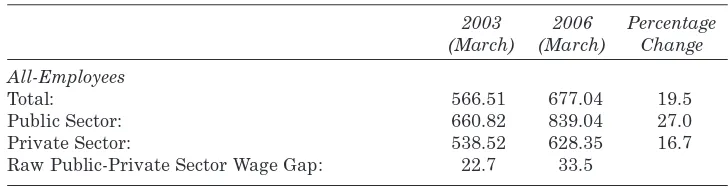
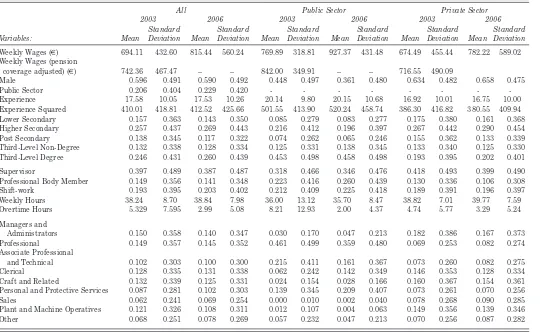
From Table 2 we can see that between 2003 and 2006, public sector workers weekly earnings grew by 27 per cent, while weekly wages in the private sector increased by approximately 17 per cent. In terms of the wage gap in weekly earnings between both sectors, this increased from 23 per cent in 2003 to 34 per cent in 2006. While these figures seem to indicate that there has been a substantial growth in the wage gap between 2003 and 2006, a comparison of average weekly earnings like this can be misleading because of underlying differences in the composition of the two sectors, for example, differences in levels of education, occupation structure and length of work experience. The descriptive information from the 2006 NES sample, which is available in Table A1 in the Appendix, illustrates that there are variations in the structure of both sectors.39On average, public sector workers tend to be better qualified, with 60 per cent holding some type of third-level qualification compared to 33 per cent of workers in the private sector. Public sector workers also have more work experience, an average of 20 years compared to 17 years for private sector workers. In addition, a higher proportion of public sector workers are in professional and associate professional occupations. All these factors would support public sector workers having higher earnings. Other noteworthy differences between the two sectors include hours worked – private sector workers were found to work longer hours (approximately 40 hours per week compared to 36 hours in the public sector). Furthermore, workers in the private sector were also more likely to undertake supervisory responsibilities. In terms of gender, 64 per cent of public sector workers were female compared to just 34 per cent in the private sector. Thus, given these characteristic differences between the two sectors, there are certainly grounds
Table 2: Change in Mean Weekly Earnings Between March 2003 and 2006*
2003 2006 Percentage (March) (March) Change All-Employees
Total: 566.51 677.04 19.5
Public Sector: 660.82 839.04 27.0
Private Sector: 538.52 628.35 16.7
Raw Public-Private Sector Wage Gap: 22.7 33.5
Note: * Public Sector includes semi-state companies.
Source:Constructed with data from the Central Statistics Office’s National Employment Surveys, 2003 and 2006.
to expect average earnings to differ across the public and private sectors. By adopting a multivariate estimation strategy, we can assess the extent to which higher earnings in the public sector go beyond the level that can be attributed to characteristic effects i.e. the framework allows us to accurately estimate the extent of any public sector wage premium, controlling for differences in educational levels, work experience and so on.
4.1 Did the Public Sector Premium Grow Between 2003 and 2006?
Public sector workers account for approximately 21 per cent of the 2003 sample data and 23 per cent of the 2006 data. As indicated previously, we use gross weekly wages as our dependant variable, which is in line with the Ernst & Young and Murphy (2007) study. While our sample has been constructed in line with the 2007 PSBB econometric study, our empirical specification differs slightly. In particular, in Ernst & Young and Murphy (2007) the right hand side variables included age, age squared and experience; however, age is generally only included in econometric models of earnings as a proxy measure of labour market experience.40As actual experience is available to us, the age variable is excluded; thus, we include only experience and experience squared in our specification.41 This difference aside, the variables included in our models as controls are in line with those adopted in the PSBB econometric study and follow international best practice. Thus, in addition to experience we also control for educational attainment, membership of professional bodies, supervisory roles, working hours and overtime, shift-work and nine occupational categories.
Table 3 presents the results generated by our models using both the 2003 and the 2006 data. As indicated earlier, the models are estimated for all workers (i.e. both males and females) and then separately according to gender. The public sector premium for all employees was estimated at 9.7 per cent in the 2003 data. The premium was estimated to be 13.8 per cent among females and 5.3 per cent among males. Interestingly, our results are broadly in line with the weighted results produced by Ernst & Young and Murphy (2007).42 However, it is important to note from the outset that our results will not exactly correspond to those of Ernst & Young and Murphy (2007) due to differences in the choice of specification. Nevertheless, our initial estimates fall within the range reported in Ernst & Young and Murphy using a
40Boyle et al. (2004) included age in their study because their experience variable only captured years worked by an individual in his/her current job i.e. tenure.
41Both age and experience are highly correlated; thus, if both variables were simultaneously included in an earnings equation it may lead to biased results.
Table 3: Weekly Wage OLS Regression Models
2003 2006 2003 2006 2003 2006
All All Males Males Females Females
Constant 3.062*** 3.005*** 3.248*** 2.956*** 3.040*** 3.232***
(0.040) (0.037) (0.064) (0.052) (0.054) (0.053)
Male 0.155*** 0.184*** – – – –
(0.0050 (0.005) – – – –
Public Sector 0.097*** 0.216*** 0.053*** 0.225*** 0.138*** 0.214*** (0.007) (0.006) (0.010) (0.010) (0.009) (0.008)
Experience 0.028*** 0.024*** 0.032*** 0.027*** 0.020*** 0.019***
(0.001) (0.001) (0.001) (0.001) (0.001) (0.001) Experience Squared 0.000*** 0.000*** –0.001*** 0.000*** 0.000*** 0.000***
(0.000) (0.000) (0.000) (0.000) (0.000) (0.000)
Education Level (Ref=Primary or Less)
Lower Secondary 0.060*** 0.045*** 0.051*** 0.074*** 0.060*** –0.027* (0.010) (0.009) (0.012) (0.012) (0.019) (0.017) Higher Secondary 0.139*** 0.103*** 0.133*** 0.120*** 0.140*** 0.065***
(0.010) (0.009) (0.012) (0.011) (0.018) (0.015) Post Secondary 0.191*** 0.142*** 0.195*** 0.177*** 0.153*** 0.045***
(0.011) (0.010) (0.013) (0.012) (0.020) (0.017) Third-Level
Non-Degree 0.249*** 0.185*** 0.250*** 0.187*** 0.232*** 0.153***
(0.011) (0.010) (0.015) (0.014) (0.019) (0.016) Third-Level Degree 0.473*** 0.347*** 0.465*** 0.353*** 0.455*** 0.309***
(0.011) (0.010) (0.014) (0.013) (0.019) (0.016)
Supervisor 0.096*** 0.090*** 0.099*** 0.092*** 0.101*** 0.088***
(0.005) (0.005) (0.007) (0.006) (0.007) (0.007) Professional Body
Member 0.152*** 0.131*** 0.135*** 0.149*** 0.176*** 0.114***
(0.007) (0.007) (0.009) (0.010) (0.010) (0.009)
Shift-work –0.009 0.035*** 0.000 0.050*** –0.018* 0.010
(0.006) (0.006) (0.008) (0.007) (0.009) (0.009) Weekly Hours (ln) 0.683*** 0.767*** 0.680*** 0.816*** 0.696*** 0.704***
(0.011) (0.010) (0.017) (0.014) (0.013) (0.014) Overtime Hours (ln) 0.014*** –0.007** 0.020*** –0.010*** –0.015*** –0.012**
(0.003) (0.003) (0.004) (0.004) (0.005) (0.005)
Observations 29,232 32,239 16,729 18,651 12,503 13,588
R2 0.4759 0.4733 0.4147 0.4549 0.5223 0.4841
F statistic 1205.57 1316.15 563.77 740.37 649.88 606.10
Note: Standard errors in parentheses.
baseline model.43 The other covariates in our model behave according to expectations.
When we re-estimate the model using the 2006 NES data we see that most of the covariates remain relatively constant in terms of their marginal effects. However, one point to note is the fall in the rates of return to education between 2003 and 2006. For example, the return to a third-level degree for males declined from 47 to 35 per cent, while female graduates experienced approximately a 15 percentage point decline to 31 per cent. Although provision of explanations for such changes in the returns to schooling is outside the scope of this paper, two obvious reasons for the observed decline lie in the growth in immigration and continued wage expansion in the construction sector that took place between 2003 and 2006. We undertook some preliminary sensitivity tests by assessing the impact on rates of return to education when immigrants and construction sector workers were excluded from our 2006 sample. The results suggest that such factors account for most of the fall in the return to male graduates and approximately a third of the decline to females. It is likely that changes in female labour market participation between 2003 and 2006 will account for a substantial proportion of what is left unexplained for females; however, this is a matter for future research.44
In terms of our variable of interest, the overall public sector premium increased dramatically from 9.7 to 21.6 per cent between 2003 and 2006. There was also a good deal of convergence with respect to the male and female positions, with the public sector advantage for both genders approximating the average at 22 per cent in 2006. Thus, the results suggest that the initial rounds of Benchmarking and Review Body pay increases under Reports No. 40 and 41, along with the national pay deals agreed between 2003 and 2006, substantially enhanced the position of public sector workers relative to their private sector counterparts. In fact, the pay premium increased by a factor of 1.6 for females and a staggering 4.2 for males.
It might be suggested that selection-bias (i.e. unobserved heterogeneity bias) is a potential issue in this public-private sector pay gap study. Such a bias might occur if public and private sector employees differed in some unobservable respect that cannot be measured and, thus, specified in the wage equations but that nonetheless influenced earnings. Differences in innate ability and motivation are two sources of such bias. However, using 2003 NES
43See Appendix 2, Table 1a (Ernst & Young and Murphy, 2007).
data, Ernst & Young and Murphy (2007) did not find any statistically significant selection effects when they estimated earnings equations with Heckman (1979) selection effects. Furthermore, Ernst & Young and Murphy (2007) estimated their earnings’ models using propensity score matching techniques to deal with any potential selection-bias but found that their OLS results were broadly in line with the propensity score matching model results. On this basis, the evidence suggests, in the Irish context at least, that unobserved heterogeneity bias is not an issue with respect to the public-private sector wage gap.
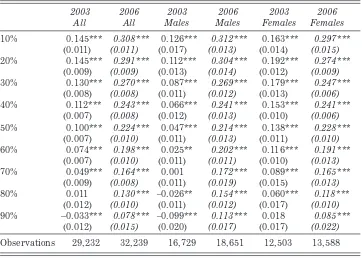
Ernst & Young and Murphy (2007), using quantile regression, also found evidence of a discount to the most senior public sector workers. It is reasonable to assume that this finding had some influence on the recommendations made by the PSBB in its second report to further increase the pay levels of some 15 senior public sector grades. Table 4 again replicates this analysis using both the 2003 and 2006 NES datasets. In line with Ernst & Young and Murphy (2007) we find evidence of a discount for the most senior public sector workers in 2003, as measured by their position in the earnings distribution, with the effect most pronounced for males. However, by 2006 these effects had been reversed with the most senior public sector workers receiving premiums of approximately 8 per cent (11 and 9 per cent for males and females respectively). The quantile regression results also indicate that the public sector advantage is even greater for employees at the lower end of the income distribution, with those in the lowest public sector grades earning between 24 and 31 per cent more than their private sector counterparts. Thus, these results raise serious questions with respect to the justification for any further boosts to the pay levels of public sector employees.
4.2 Decomposing the 2006 Public-Private Sector Pay Gap
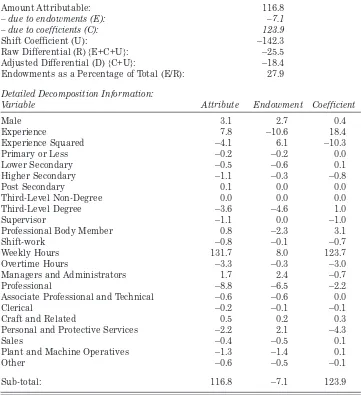
In order to look at the relative importance of different observable characteristics, in terms of the explained public-private sector pay gap, we estimate an Oaxaca-Blinder decomposition using the 2006 NES.45 The raw wage gap, also referred to as the unadjusted pay gap, was –25.5 per cent in 2006 (Table 5).46The adjusted differential, which is the proportion of the raw wage gap that remains unexplained by differences in observable characteristics between public and private sector employees, was –18.4 per cent.47As the private sector is taken as the reference point, the adjusted pay
45The public and private sector OLS models that underpin the 2006 decomposition are presented in Table A2 in the Appendix. The 2003 results are available from the authors on request. 46In 2003, the unadjusted wage gap was –23.7 per cent. The 2003 NES decomposition results are available from the authors on request.
gap relates to a private sector penalty of –18.4 per cent, which is comparable to the public sector premium of 21.6 per cent generated in our OLS analysis. Differences in observable characteristics (e.g. different levels of educational attainment, experience, etc.) have a relatively small impact on the public-private sector pay gap, accounting for just 27.9 per cent of the total raw gap.49 As expected, public sector pay is increased as a result of a superior concentration of graduates and individuals holding professional occupations. Higher levels of labour market experience also boost public sector pay. Conversely, private sector wages are increased by virtue of longer working hours, and also some minor occupational differences. Based on observable characteristics alone, public sector workers should, in fact, only earn some 7.1 per cent more than their private sector counterparts.50Thus, most of the pay Table 4:Public Sector Weekly Wage Quantile Regression Models48
2003 2006 2003 2006 2003 2006
All All Males Males Females Females
10% 0.145*** 0.308*** 0.126*** 0.312*** 0.163*** 0.297***
(0.011) (0.011) (0.017) (0.013) (0.014) (0.015)
20% 0.145*** 0.291*** 0.112*** 0.304*** 0.192*** 0.274***
(0.009) (0.009) (0.013) (0.014) (0.012) (0.009)
30% 0.130*** 0.270*** 0.087*** 0.269*** 0.179*** 0.247***
(0.008) (0.008) (0.011) (0.012) (0.013) (0.006)
40% 0.112*** 0.243*** 0.066*** 0.241*** 0.153*** 0.241***
(0.007) (0.008) (0.012) (0.013) (0.010) (0.006)
50% 0.100*** 0.224*** 0.047*** 0.214*** 0.138*** 0.228***
(0.007) (0.010) (0.011) (0.013) (0.011) (0.010)
60% 0.074*** 0.198*** 0.025** 0.202*** 0.116*** 0.191***
(0.007) (0.010) (0.011) (0.011) (0.010) (0.013)
70% 0.049*** 0.164*** 0.001 0.172*** 0.089*** 0.165***
(0.009) (0.008) (0.011) (0.019) (0.015) (0.013)
80% 0.011 0.130*** –0.026** 0.154*** 0.060*** 0.118***
(0.012) (0.010) (0.011) (0.012) (0.017) (0.010)
90% –0.033*** 0.078*** –0.099*** 0.113*** 0.018 0.085***
(0.012) (0.015) (0.020) (0.017) (0.017) (0.022)
Observations 29,232 32,239 16,729 18,651 12,503 13,588
Note:Standard errors in parentheses.
* significant at 10%; ** significant at 5%; *** significant at 1%.
48Results on the other covariates included in the quantile regression models are available from the authors on request.
49Differences in observable characteristics accounted for just over 50 per cent of the total raw pay gap in 2003.
advantage of public sector workers does not relate to variations in observable characteristics between the two sectors (the endowment effect in Table 5) but to differences in unobservables (the shift coefficient effect in Table 5). Examples of such unobservable factors might include differences in individual characteristics, such as unobserved ability, motivation, etc., or job characteristics not controlled for in our analysis, such as relative job risk or variations in pay determination mechanisms between the two sectors. Table 5: Decomposition of the 2006 Public-Private Sector Pay Gap
Decomposition Summary:
Amount Attributable: 116.8
– due to endowments (E): –7.1
– due to coefficients (C): 123.9
Shift Coefficient (U): –142.3
Raw Differential (R) {E+C+U}: –25.5
Adjusted Differential (D) {C+U}: –18.4
Endowments as a Percentage of Total (E/R): 27.9
Detailed Decomposition Information:
Variable Attribute Endowment Coefficient
Male 3.1 2.7 0.4
Experience 7.8 –10.6 18.4
Experience Squared –4.1 6.1 –10.3
Primary or Less –0.2 –0.2 0.0
Lower Secondary –0.5 –0.6 0.1
Higher Secondary –1.1 –0.3 –0.8
Post Secondary 0.1 0.0 0.0
Third-Level Non-Degree 0.0 0.0 0.0
Third-Level Degree –3.6 –4.6 1.0
Supervisor –1.1 0.0 –1.0
Professional Body Member 0.8 –2.3 3.1
Shift-work –0.8 –0.1 –0.7
Weekly Hours 131.7 8.0 123.7
Overtime Hours –3.3 –0.3 –3.0
Managers and Administrators 1.7 2.4 –0.7
Professional –8.8 –6.5 –2.2
Associate Professional and Technical –0.6 –0.6 0.0
Clerical –0.2 –0.1 –0.1
Craft and Related 0.5 0.2 0.3
Personal and Protective Services –2.2 2.1 –4.3
Sales –0.4 –0.5 0.1
Plant and Machine Operatives –1.3 –1.4 0.1
Other –0.6 –0.5 –0.1
4.3 Comparison of Public and Private Sector Employees Earnings Distributions
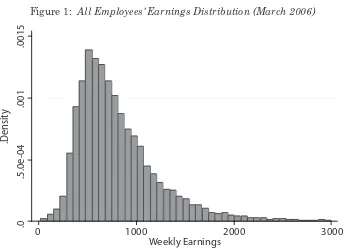
Figure 1 plots the earnings distribution for all employees in 2006, while Figures 2 and 3 plot the wage distributions in the public and private sectors respectively.51 The distributions for both sectors appear slightly different in that modal earnings are somewhat higher in the public sector. In addition, there are higher proportions of private sector workers earning very low wages. Nevertheless, the private sector distribution has a longer right-hand tail indicating a more generally dispersed distribution.
4.4 An Estimate of the Impact of Pension Coverage on the Pay Differential The 2003 NES contains sufficient information that allows us to make some adjustment for the impact of pension coverage on earnings. Specifically, employers were asked to provide information on the percentage of workers covered by an employer-based pension plan. We reasonably assume any worker located in a firm with a pension coverage rate exceeding 80 per cent to be in receipt of pension benefits and, as a consequence, we inflated their weekly wage by a factor of 10 per cent to reflect the additional employer contribution. Unfortunately, this question was not asked in the 2006 NES so we were unable to replicate the adjustment using that dataset.
.0015
.001
.Densit
y
.5.0e
-04
.0
0 1000
Weekly Earnings
2000 3000
Figure 1: All Employees’ Earnings Distribution (March 2006)
.0015
.001
Densit
y
.5.03-04
.0
0 1000 2000
Weekly Earnings
3000 Figure 2: Public Sector Employees’ Earnings Distribution (March 2006)
.0015
.001
.Densit
y
5.0e
-04
0 1000
Weekly Earnings
2000 3000
Table 6: 2003 Weekly Wage OLS Regression Models: Pension Effect
Pension Pension Pension
All All Males Males Females Females
Constant 3.062*** 3.112*** 3.248*** 3.297*** 3.040*** 3.102***
(0.040) (0.041) (0.064) (0.065) (0.054) (0.054)
Male 0.155*** 0.156*** – – – –
(0.0050 (0.005) – – – –
Public Sector 0.097*** 0.129*** 0.053*** 0.085*** 0.138*** 0.171*** (0.007) (0.007) (0.010) (0.010) (0.009) (0.009)
Experience 0.028*** 0.028*** 0.032*** 0.033*** 0.020*** 0.019***
(0.001) (0.001) (0.001) (0.001) (0.001) (0.001) Experience Squared 0.000*** 0.000*** –0.001*** –0.001*** 0.000*** 0.000***
(0.000) (0.000) (0.000) (0.000) (0.000) (0.000)
Education Level (Ref=Primary or Less)
Lower Secondary 0.060*** 0.059*** 0.051*** 0.049*** 0.060*** 0.062*** (0.010) (0.010) (0.012) (0.013) (0.019) (0.019) Higher Secondary 0.139*** 0.139*** 0.133*** 0.131*** 0.140*** 0.145***
(0.010) (0.010) (0.012) (0.012) (0.018) (0.018) Post Secondary 0.191*** 0.194*** 0.195*** 0.197*** 0.153*** 0.157***
(0.011) (0.011) (0.013) (0.013) (0.020) (0.020) Third-Level
Non-Degree 0.249*** 0.248*** 0.250*** 0.248*** 0.232*** 0.235***
(0.011) (0.011) (0.015) (0.015) (0.019) (0.019) Third-Level Degree 0.473*** 0.473*** 0.465*** 0.465*** 0.455*** 0.457***
(0.011) (0.011) (0.014) (0.015) (0.019) (0.019)
Supervisor 0.096*** 0.092*** 0.099*** 0.094*** 0.101*** 0.099***
(0.005) (0.005) (0.007) (0.007) (0.007) (0.008) Professional Body
Member 0.152*** 0.153*** 0.135*** 0.135*** 0.176*** 0.178***
(0.007) (0.007) (0.009) (0.010) (0.010) (0.010)
Shift-work –0.009 –0.007 0.000 0.006 –0.018* –0.024**
(0.006) (0.006) (0.008) (0.008) (0.009) (0.009) Weekly Hours (ln) 0.683*** 0.683*** 0.680*** 0.681*** 0.696*** 0.695***
(0.011) (0.011) (0.017) (0.017) (0.013) (0.013) Overtime Hours (ln) 0.014*** 0.013*** 0.020*** 0.019*** –0.015*** –0.015***
(0.003) (0.003) (0.004) (0.004) (0.005) (0.006)
Observations 29,232 29,232 16,729 16,729 12,503 12,503
R-squared 0.4759 0.4761 0.4147 0.4131 0.5223 0.5276
F statistic 1205.57 1206.38 563.77 559.88 649.88 663.69
Note: Standard errors in parentheses.
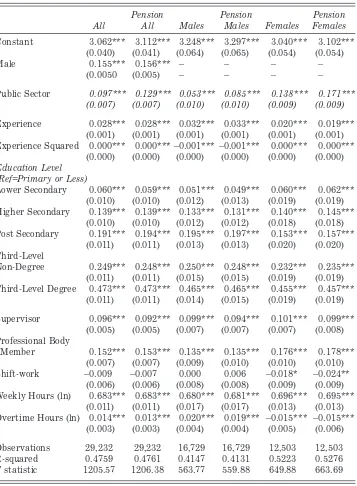
Approximately 96.4 per cent of public sector employees in our data were deemed to be in receipt of an employer-sponsored pension compared to just 61.5 per cent of private sector workers. While our analysis explicitly accounts for the different rates of pension coverage across the public and private sectors, it makes no adjustment for the substantial difference in value between public and private sector pensions (PSBB, 2007; Review Body on Higher Remuneration in the Public Sector, 2007). In particular, public sector pensions are index-linked to earnings growth in the public sector whereas private sector pensions are generally substantially less favourable. Therefore, our estimates of the pension impact should be treated as partial and conservative. Despite this, our adjustment makes a significant impact on the public-private sector wage differential with the public sector premium increasing from 9.7 per cent to 12.9 per cent in 2003 (Table 6). Similar percentage point increases were observed when the models were estimated according to gender.
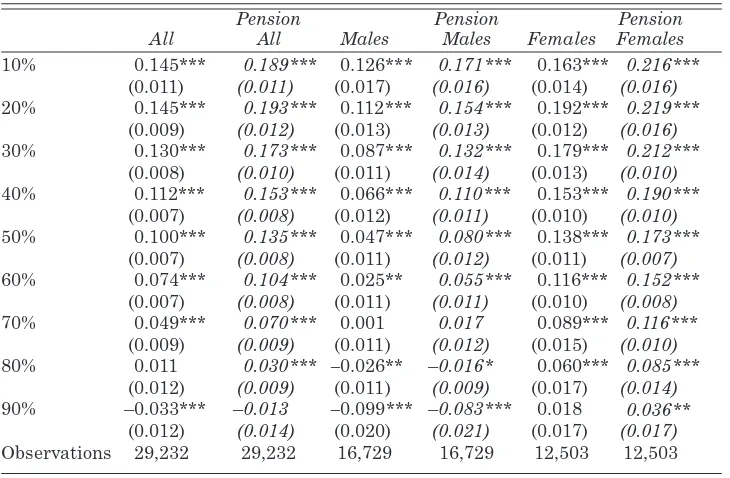
Table 7 reveals that, with respect to the impact of the pension adjustment across the earnings distribution, the effect was relatively constant with the Table 7: 2003 Public Sector Weekly Wage Quantile Regression Models: Pension Effect52
Pension Pension Pension
All All Males Males Females Females
10% 0.145*** 0.189*** 0.126*** 0.171*** 0.163*** 0.216***
(0.011) (0.011) (0.017) (0.016) (0.014) (0.016)
20% 0.145*** 0.193*** 0.112*** 0.154*** 0.192*** 0.219***
(0.009) (0.012) (0.013) (0.013) (0.012) (0.016)
30% 0.130*** 0.173*** 0.087*** 0.132*** 0.179*** 0.212***
(0.008) (0.010) (0.011) (0.014) (0.013) (0.010)
40% 0.112*** 0.153*** 0.066*** 0.110*** 0.153*** 0.190***
(0.007) (0.008) (0.012) (0.011) (0.010) (0.010)
50% 0.100*** 0.135*** 0.047*** 0.080*** 0.138*** 0.173***
(0.007) (0.008) (0.011) (0.012) (0.011) (0.007)
60% 0.074*** 0.104*** 0.025** 0.055*** 0.116*** 0.152***
(0.007) (0.008) (0.011) (0.011) (0.010) (0.008)
70% 0.049*** 0.070*** 0.001 0.017 0.089*** 0.116***
(0.009) (0.009) (0.011) (0.012) (0.015) (0.010)
80% 0.011 0.030*** –0.026** –0.016* 0.060*** 0.085***
(0.012) (0.009) (0.011) (0.009) (0.017) (0.014)
90% –0.033*** –0.013 –0.099*** –0.083*** 0.018 0.036**
(0.012) (0.014) (0.020) (0.021) (0.017) (0.017)
Observations 29,232 29,232 16,729 16,729 12,503 12,503
Note:Standard errors in parentheses.
* significant at 10%; ** significant at 5%; *** significant at 1%.
public sector premium increasing, on average, by between 3 and 5 percentage points in each quantile. Following the adjustment, the discount to the most senior public service employees became insignificant. In relation to the gender impact from the pension adjustment, the premium to the most senior public sector females switched from being an insignificant to a significant premium (3.6 per cent), while for males the discount was reduced slightly but remained significant.
V SUMMARY AND CONCLUSIONS
This paper uses data from the 2003 and 2006 National Employment Surveys to assess the impact of the pay increases under the first report of the Public Sector Benchmarking Body, those made by the Review Body on Higher Remuneration in the Public Sector, Reports No 40 and 41, as well as two national pay deals, on the public-private sector pay gap. The study’s central aim was to track changes in the relationship between pay in the public and private sectors following these pay setting rounds. A secondary objective of the study was to examine the likely impact of pension coverage on the public-private wage differential.
Our analysis shows that the overall public sector pay premium increased from less than 10 per cent in 2003 to almost 22 per cent in 2006, controlling for human capital and other relevant pay determining characteristics. The earnings gap increased from 5 to 23 per cent for males and from 14 to 21 per cent for females.
also suggest that if such increases were to be awarded then this would further undermine Ireland’s current drive to regain its competitiveness.
The approach adopted in this study differs fundamentally from that of the Benchmarking review body which relied on job evaluation techniques. Arguably the process of job evaluation is open to question regarding the extent to which public sector workers can be effectively benchmarked with private sector equivalents on the basis of job content. Furthermore, there is little theoretical or empirical grounding to the apparent assumption that wages will be primarily determined by job characteristics. However, the approach adopted here largely ignores job content and compares the earnings of public sector workers with their private sector counterparts that are equipped with the same human capital characteristics. Within economics it is widely accepted that accumulated human capital is the principal factor determining an individual’s productivity and, hence, their earnings. As such, we believe that the methodology adopted here, which is standard within the international literature, is the most appropriate means of assessing the magnitude of the public sector wage premium.
The research also highlights the importance of adjusting for pension coverage when making any assessment of the public sector pay gap. After correcting for the fact that employer-based pensions are more widespread in the public sector, the public sector premium, estimated using the all employee 2003 sample, increased from 9.7 to 12.9 per cent. The impacts of the pension coverage adjustment were relatively constant with respect to the earnings distribution with the premium increasing by between 3 and 5 percentage points in each quantile. The results imply that had the impact of differences in pension coverage been incorporated into the PSBB’s econometric assessment based on the 2003 NES data, then the observed wage discount found among senior public sector workers would have been negligible. While data constraints prevent us from replicating the analysis of the impact of pension coverage in respect of the 2006 data, it is unlikely that the impact of pension coverage on the public sector premium would have declined between 2003 and 2006.
Finally, it is important to note that despite adjusting our data for differences in pension coverage, it is likely that our estimates of the public-private sector pay differential will still contain a downward bias. This is due to the fact that the current study makes no adjustment for the higher relative value of public sector pensions, nor does it make any assessment of the potential value of increased job security within the public sector53 or
variations in the number of days worked between both sectors. Furthermore, a number of additional payments have taken place under the various wage determination mechanisms discussed that fall outside the data capture period of this study. While these factors will be counteracted, to some extent, by a higher proportion of private sector workers receiving benefit-in-kind,54 it is still likely that the public-private sector pay gap estimates derived in this paper are biased downwards.
REFERENCES
ADAMCHIK, V. A. and A. S. ARJUN, 2000. “Wage Differentials Between the Public and the Private Sectors: Evidence from an Economy in Transition”, Labour Economics, Vol. 7, No. 2, pp. 203-224.
BARRETT, A., T. CALLAN and B. NOLAN, 1999. “Rising Wage Inequality, Returns to Education and Labour Market Institutions: Evidence from Ireland”, British Journal of Industrial Relations, Vol. 37, No. 1, pp. 77-100.
BOYLE, G., R. MCELLIGOT and J. O’LEARY, 2004. “Public-Private Wage Differen tials in Ireland, 1994-2001”, ESRI Quarterly Economic Commentary, Special Article. Summer 2004. Dublin: The Economic and Social Research Institute.
CAI, L. and A. Y. C. LIU, 2008. “Public-Private Wage Gap in Australia: Variation Along the Distribution”, Centre for Economic Policy Research Discussion Paper No. 581 (June), Canberra, Australia: The Australian National University.
DEPARTMENT OF FINANCE, 2003-2008. Various Circulars on Application of Pay Increases to Public Sector Workers From Benchmarking, Higher Remuneration and National Social Partnership Pay Deals (http://www.finance.gov.ie/).
DEPARTMENT OF FINANCE, July 2008. Analysis of Exchequer Pay and Pensions Bill, Dublin: Stationery Office.
DEPARTMENT OF THE TAOISEACH, February 1994. Programme for Competitive -ness and Work, Dublin: Stationery Office.
DEPARTMENT OF THE TAOISEACH, February 2000. Programme for Prosperity and Fairness, Dublin: Stationery Office.
DEPARTMENT OF THE TAOISEACH, February 2003. Sustaining Progress: Social Partnership Agreement 2003-2005, Dublin: Stationery Office.
DEPARTMENT OF THE TAOISEACH, June 2004. Mid-Term Review of Part Two of Sustaining Progress: Pay and the Workplace,Dublin: Stationery Office.
DEPARTMENT OF THE TAOISEACH, June 2006. Towards 2016: TenYear Frame -work Social Partnership Agreement 2006-2015, Dublin: Stationery Office.
DEPARTMENT OF THE TAOISEACH, September 2008. Towards 2016: Review and Transitional Agreement 2008-2009. Dublin: Stationery Office.
DISNEY, R. and A. GOSLING, 1998. “Does it Pay to Work in the Public Sector?” Fiscal Studies,Vol. 19, No. 4, pp. 347-374.
ERNST & YOUNG and MURPHY, 2007. “An Econometric Study of Earnings Based on National Employment Survey 2003 Data”.
FITZ GERALD, J., 1999. “Wage Formation and the Labour Market” in F. Barry (ed.),
Understanding Ireland’s Economic Growth, London: Macmillan.
GARDEAZABAL, J. and A. UGIDOS, 2004. “More on Identification in Detailed Wage Decompositions”, The Review of Economics and Statistics, Vol. 86, No. 4, pp. 1034-1036.
GREGORY, R. G. and J. BORLAND, 1999. “Recent Developments in Public Sector Labour Markets” in O. Ashenfelter and D. Card (eds.), Handbook of Labor Economics, Volume 3C, North Holland: Elsevier.
HECKMAN, J., 1979. “Sample Selection Bias as a Specification Error”, Econometricia, Vol. 47, No. 1, pp. 153-161.
INTERNATIONAL MONETARY FUND, 2009. Ireland: 2009 Article IV Consultation-Staff Report; and Public Information Notice on the Executive Board Discussion. Washington: International Monetary Fund Publication Services.
JÜRGES, H., 2002. “The Distribution of the German Public-Private Wage Gap”,
Labour, Vol. 16, No. 2, pp. 347-381.
LUCIFORA, C. and D. MEURS, 2006. “The Public Sector Pay Gap in France, Great Britain and Italy”, Review of Income and Wealth,Vol. 52, No. 1, pp. 43-59. MELLY, B., 2005. “Public-Private Sector Wage Differentials in Germany: Evidence
from Quantile Regression”, Empirical Economics,Vol. 30, No. 2, pp. 505-520. MUELLER, R. E., 1998. “Public-Private-Sector Wage Differentials in Canada:
Evidence from Quantile Regressions”, Economic Letters, Vol. 60, No. 2, pp. 229-235.
MUELLER, R. E., 2002. “Public- and Private-Sector Wage Differentials in Canada Revisited”, Industrial Relations: A Journal of Economy and Society,Vol. 39, No. 3, pp. 375-400.
MCGUINNESS, S., E. KELLY, and P. O’CONNELL, 2008. “The Impact of Wage Bargaining Regime on Firm-Level Competitiveness and Wage Inequality: The Case of Ireland”, ESRI Working Paper No. 266 (December), Dublin: The Economic and Social Research Institute.
O’CONNELL, P. J. and H. RUSSELL, 2006. “Does it Pay to Go Public? Public-Private Wage Differences Among Recent Graduates in Ireland”, ESRI Quarterly Economic Commentary, Special Article. Autumn 2006, Dublin: The Economic and Social Research Institute.
O’LEARY, J., 2002. “Benchmarking the Benchmarkers”, ESRI Quarterly Economic Commentary, Policy Discussion Forum. Winter 2002, Dublin: The Economic and Social Research Institute.
OAXACA, R. and M. RANSOM, 1999. “Identification in Detailed Wage Compositions”,
The Review of Economics and Statistics, Vol. 81, No. 1, pp. 154-157.
PUBLIC SERVICE BENCHMARKING BODY, June 2002. Report of the Public Service Benchmarking Body, Dublin: The Stationery Office.
PUBLIC SERVICE BENCHMARKING BODY, December 2007. Report of the Public Service Benchmarking Body, Dublin: Stationery Office.
REVIEW BODY ON HIGHER REMUNERATION IN THE PUBLIC SECTOR, June 2005. Report No. 40 to The Minister for Finance, Dublin: Stationery Office. REVIEW BODY ON HIGHER REMUNERATION IN THE PUBLIC SECTOR,
REVIEW BODY ON HIGHER REMUNERATION IN THE PUBLIC SECTOR, September 2007. Report No. 42 to The Minister for Finance on the Levels of Remuneration Appropriate to Higher Posts in the Public Sector, Dublin: Stationery Office.
REVIEW BODY ON HIGHER REMUNERATION IN THE PUBLIC SECTOR, July 2008.Report No. 43 to The Minister for Finance on The Levels of Remuneration Appropriate to Posts in the Labour Court, the Chief Executive of the Labour Relations Commission, State Solicitors and Certain Posts in Universities, Dublin: Stationery Office.