CHAPTER III
RESEARCH METHOD
This part discusses the type of the study, design of the study, population and sample of the study, research instrument, instrument try-out, validity of instrument, reliability of instrument, data collecting procedure, data analysis procedures.
A. Type of the Study
This study was quantitative research. Quantitative research is deals with questions of relationship, cause and effect, or current status that researchers can answer by gathering and statistically analyzing numeric data.1A quantitative study, consistent with the quantitative paradigm, is an inquiry into a social or human problems based on testing a theory composed of variables, measured with numbers, and analyzed with statistical procedures, in order to determine whether predictive generalizations of the theory hold true.2
B. Design of the Study
In this study, the writer usedquasi-experimental design. Quas-experimental design is similar to randomized Quas-experimental research in that involve manipulation of an independent variable but differ in that subjects are not randomly assigned to treatment group.3 There are many situations in educational
1
Donald Ary,Introduction to Research in Education, Eight Edition,USA:Wadsworth, 2006,p.316
2
John W. Creswell, Qualitative and Quantitative Approach, 1994, California: SAGE Publications, Inc, 1994, p.2
3
Donald Ary,Introduction to Research in Education, Eight Edition,USA:Wadsworth, 2006,p.316
research in which is not possible to conduct a true experiment. Neither full control over the scheduling of experimental conditions nor the ability to randomize can be always realized.4
The writer used nonrandomized control group pre-test, post-test design with Context clues treatment. There were two groups in this model, experiment group and control group. Both groups were given pre-test to measure the score of
students’ treatment given. The treatment gave for experiment group. Post-test gave for both groups to measure the students score after treatment is given.
Table 3.1. The Description of the Quasi-Experimental Design
Group Pre-test Treatment Post-test
Experiment Group Y1 X Y1
Control Group Y2 - Y2
In this experiment, the writer taught the students directly with the same material. Therefore, the use of context clues was applied on experiment group only, and for the control group the writer applied non-context clues. Meanwhile, the control group was not given the treatment. The writer implemented context clues for the experiment group in reading class. The writer provided the teaching learning by context clues for students to get involved in the class and real life task with some procedures. The control group worked with conventional method learning in reading.
4
C. Population and Sample 1. Population
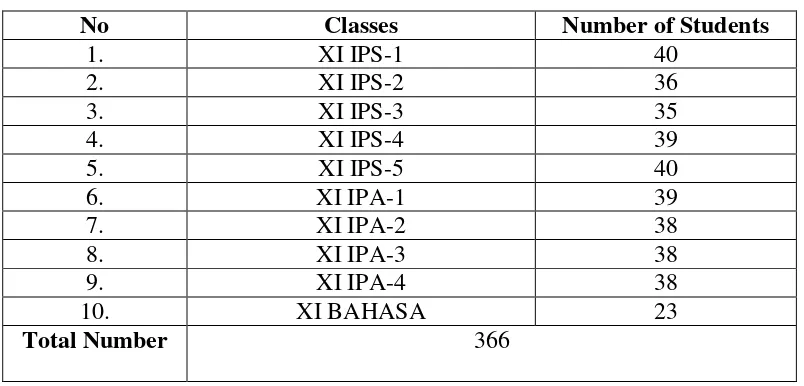
A population is defined as all members of any well-defined class of people, events, or objects.5 The population of the study was all of the eleventh grade students at SMA Negeri 3Palangka Raya. Numbers of population were about 374 students. It was classified into ten classes.
Table 3.2. The Population of Study
No Classes Number of Students
1. XI IPS-1 40 adalah bagian dari jumlah dan karakteristik yang dimiliki oleh populasi
tersebut.7 The writer used cluster sampling to take the sample.Cluster sampling is used if the population does not consist of individuals, but groups
5
Donald Ary,Introduction to Research in Education, Third Edition,USA:Wadsworth, 2006, p.138
6Ibid
, p.148
7
or cluster8. The writer determined the two classes into two groups. They were 40students as experimental group and 36 students as control group. A total of 76 students in the eleventh grade students at SMA Negeri 3 Palangka Raya werechosen to be the sample in this study.
Table 3.3. The Sample of Study
No Classes Group Number of Students
1. XI IPS-1 Experimental 40
2. XI IPS-2 Control 36
Total number of the students 76
D. Research Instrument 1. Test
A test is a set of stimuli presented to an individual in order to elicit responses on the basis of which a numerical score can be assigned. This score,
based on a representative sample of the individual’s behavior, is an indicator of
the extent to which the subject has the characteristic being measured.”9
The writer used a test as an instrument to collect data of this study because the students’ reading scores could be known by using test.
a. Pre-test
Pre-test gives to the experiment class and the control class before giving the treatment.
8
Nurul Zurich, MetodologiPenelitianSosialdanPendidikan (TeoriAplikasi), Jakarta: BumiAksara, 2006, p. 124.
9
a. Post-test
Post-test gives to the experiment class and the control class after
receiving treatment. It purposes to know the improvement of students’ reading
score.
2. Documentation
The writer used documentation as the second instrument of the study.
Arikunto’s opinion states that “there are three kinds of source namely paper,
place, and people”. This technique used to collect the data in the form of
document on the study place. The data that needed such as:
a) The amount, the name, and the student’s registration number of the school
b) The syllabus of reading subject c) The student’s score of reading According Ridwan states that:
Dokumentasiadalahditunjukkanuntukmemperoleh data langsungdaritempatpenelitian, meliputibuku-buku yang relevan, peraturan-peraturan, laporankegiatan, foto-foto, film documenter, data yang relevandenganpenelitian.10 (Documentation is indicated to get the data directly from thelocation of the research, include relevant books, rules, a report of activities,pictures, documenter film and the relevant data in the study).
E. Instrument of Try-Out
The try out to the test instrument before it applied to real sample in this study. The test type was reading multiple choice tests and the try out test gave to
10
the XI IPS-3 of the eleventh grade students at SMA Negeri 3Palangka Raya. The purpose of instrument try out was in order to validity and reliability of the test item. The writer used procedures of instrument try out as follow:
a. The writer prepared the test instrument try out b. The writer gave the test items of try out. c. The writer gave score.
d. The writer analyzed the data to know the instrument validity and reliability. F. Validity of Instrument
Validity is defined as the degree to which evidence and theory support the interpretations of test scores entailed proposed uses of test.11
Validity is concerned with the extent to which an instrument measures what one thinks it measuring.12
Every test, whether it is a short, informal classroom test or a public examination, should be a valid a constructor can make it. The test must aim to provide a true measure of a particular skill which it is intended to measure, to the extent that is measures external knowledge and other skills at the same time, and it will not be a valid test.
Validity on this study is distinguished into some kinds as follows:
a. Face Validity
Face validity is an estimate of whether a test appears to measure a certain criterion; it does not guarantee that the test actually measures phenomena in
11
Donald Ary,Introduction to Research in Education, Third Edition,USA:Wadsworth, 2006, p.225.
12
that domain. The test is intended to measure the students’ reading scores in
the eleventh grade student. b. Content Validity
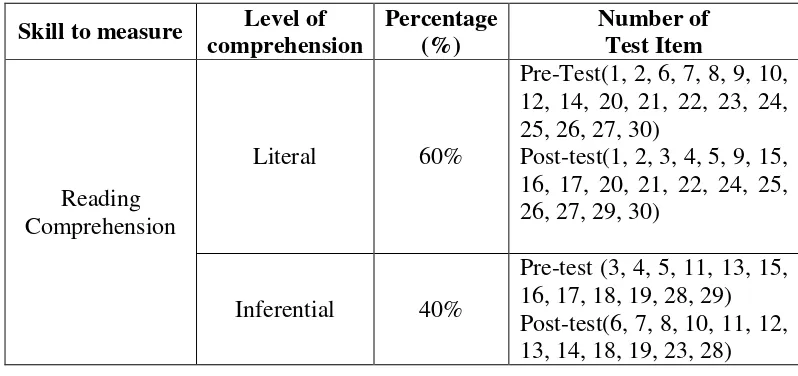
The kind of validity depends on a careful analysis of the language being tested and of the particular course objective. The test should be so constructed as to contain a representative sample of the course, the relationship between the test and the course objective always being apparent.13 In the present study,
the test about context clues in order to measure the students’ reading score in
reading.
Table 3.4Content Specificationof Items Research Instruments
assumes the existence if certain learning theories of constructs underlying the acquisition of abilities and skills.15
To measure the validity of the instrument, the writer uses the formulation of Product Moment by Pearson as follows.
rxy = ___ N∑XY-(∑X)( ∑Y)_______
{N∑X²-(∑X) ²}{N∑Y²-(∑Y) ²} Where:
rxy : Total coefficient of correlation
∑X : Total Value of Score X
∑Y : Total Value of Score Y
∑XY : Multiplication Result between Score X and Y
N : Number of students
G. Reliability of Instrument
Reliability is the extent to which the test is consistent in measuring whatever and to which an individual scores nearly the same in repeated measurements, as indicated by a high reliability coefficient.16
A test is reliable to extent than the scores made by an individual remain nearly the same in repeated measurements.17 In this study the researcher uses inter-rater reliability. Inter-rater reliability estimates the reliability of two scores
15Ibid,
P.231.
16Ibid
p. 259.
17
which are gained from two testers for the same subjects of the test.18The reliability by usingKuder Richardson (KR-21) formula:
𝑟11 =
𝑟11: Reliability of instrument 𝑁 : The number of items in test
m : The mean score on the test for all the testees.
x : The standard deviation of all the testees’ scores.
The steps in determining the reliability of the test were: a. Making tabulating of testees’s scores.
b. Measuring the mean of the testees’s scores with the formula: M=
N X
c. Measuring the total variants with the formula: Nx2=
N
= the square of score total N = the number of testes
d. Calculating the instrument reliability using KR-21. e. The last decision is comparing the value of11andt
18
f. To know the level of reliability of instrument, the value of was interpreted based on the qualification of reliability as follows:
0.800- 1.000 : Very High Reliability 0.600-0.799 : High Reliability
0.400-0.599 : Fair Reliability 0.200-0.399 : Poor Reliability 0.000-.0199 : Very Poor Reliability
From the measurement of instrument try out reliability it is known that the whole numbers of test items are reliable and can be used as the instrument of the study.
11
>table = Reliable
11
H. Data Collecting Procedures
Teaching Reading Narrative text using Context Clues On The Eleventh Grade Students of SMA Negeri 3
Palangkaraya
Pre-test
Experiment Group (EG)
Control Group (CG)
Teaching without Context Clues Teaching using
Context Clues
Discussion and Conclusion Analyzing The Data Using T-test
Based on the figure above, the data collecting procedure explain as follows:
1. The writer observed the classes. The writer directly didobservation in the field where the place taken. It wasdone to observe the class condition in
learning English, to know how the students’ attitude while teaching learning process going on.
2. The observation was purposed to get specific data, they were: a. The general description of the location of the study. b. The syllabus and lesson plan of the school.
c. The number of class.
d. The number of students and students’ name. e. The number of the English Teacher.
f. The process of teaching learning English. The writer did it once. 3. Grouping the students into experimental group and control group. 4. Giving pre-test to the experimental group and control group.
5. Teaching English Reading for three times to students in the experimental group by implementing the context clues and teach English reading to students in the control group without by implementing the context clues. 6. Giving post-test to the experimental group and control group.
I. Data Analysis Procedures
The writer used statistical ttest to answer the problem of the study. In Order to analyze the data, the writer does some way procedures:
1. Gave the tests to the students of the eleventh grade students at SMA Negeri 3 Palangka Raya.
2. Collected the data of the students’ worksheet tests result. 3. Gave score to the students’ test result by using formula:
𝑆𝑐𝑜𝑟𝑒= 𝐵
𝑁 × 100%
B : Frequency of the correct answers N : Number of test items
4. Tabulated the students’ score into distribution of frequency in the table, then
find out the mean of students’ score, standard deviation, and standard error of
variable X 1 (Experiment Group) and X 2 (Control Group). 5. Normality Test
Itisusedtoknowthenormalityofthedatathatisgoingtobe analyzed whether both groups have normal distribution or not.
6. Homogeneity Test
It isusedtoknowwitherexperimentalgroupandcontrolgroup,
thatweredecided,comefrompopulationthathasrelatively samevariantor not. 7. Calculate the data by using T-test to test the hypothesis of the study, whether
between two of Sample Mean taken randomly from the same population, there is no significant different.19 T-test is used to measure whether context clues give effect to the students reading narrative text score using formula as follows: 20
to=
𝑴𝟏−𝑴𝟐 𝑺𝑬𝒎𝟏−𝑺𝑬𝒎𝟐
M1- M2 : The difference of two means
SEm1 – SEm2 : The standard error of the difference between two means To know the hypothesis is accepted or rejected using the criterion:
If t-test (the value) ≥ ttable, it means Ha is accepted and Ho is rejected. If t-test (the value) ≤ ttable, it means Ha is rejected and Ho is accepted.
8. Interpret the result of t-test. Previously, the writer count the degrees of freedom (df) with the formula:21
df = (N1 + N2– 2)
After that, the value of ttest is consulted on the ttableat the level of significance 1% and 5%. In this research, the writer uses the level of significance at 5%. If the result or t-test is higher than ttable, it means Ha is accepted.
19
AnasSudijono, PengantarStatistikPendidikan, Jakarta: Raja GrafindoPersada, 1987, p.278.
20Ibid,
p. 284.
21
9. The writer made the conclusion of data analysis obtained.