58
and sample of the study, research instruments,research instruments try out, research instruments validity, research instruments reliability, data collection procedures, and data analysis procedures.
A.Research Design
The design of this study was experimental design. Experimental design is a plan for an experiment that specifies what independent variables was applied, the number of levels of each, how subjects are assigned to groups, and the dependent variable.1 The writer used the experimental design because the writer wanted to measure the effect of using mnemonic device in learning English vocabulary process at the second grade of MTsNMaliku.
The type of this study was quasi-experimental study. Quasi-Experimental design are similar to randomized experimental designs in that they involved manipulation of an independent variable but different in those subjects in that they involve manipulation of an independent variable but different in that subjects are not randomly assigned to treatment groups.2 The writer used quasi experiment
1
DonalAry, Introduction to Research in Education (Eight edition), United State: Wadsworth (engange learning), 2010, p. 641.
2
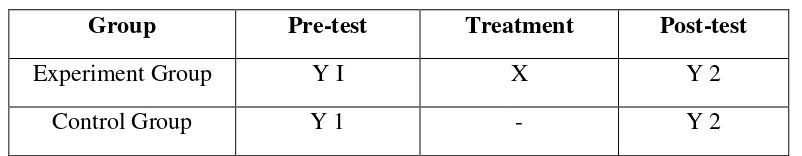
because it was not based on random assignment of subjects to experiment and control group. The writer used quasi experiment by nonrandomized control group, pre test–post test design. There were two groups in this design; they were experiment group and control group. Pre-test was given to both groups to measure the score of students before treatment was given. Experiment group was given treatment with using mnemonic device and control group was taught without using mnemonic device notes (handout). Post-test was given to both groups to measure the score of students after treatment was given. The scheme of this design was:
Table 3.1
Design of pre-test and post-test
Group Pre-test Treatment Post-test
Experiment Group Y I X Y 2
Control Group Y 1 - Y 2
B.Time and Place
The place of study was MTsNMalikuBaru. It located at MalikuPermai Street no. 57, PulangPisau district. In this study, the writer conducted research two months to collect the data. It was begun on April 27th until 2nd June 2016.
C.Population and Sample of the Study
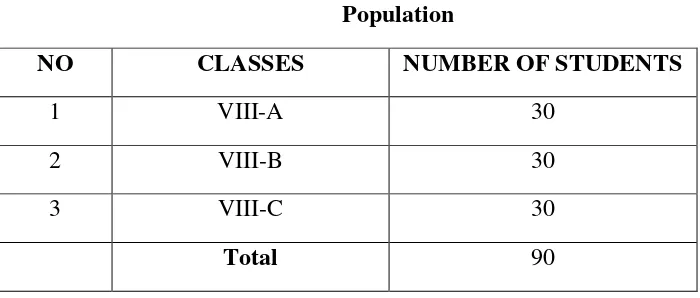
A population is defined as all members of any well-defined class of people, events, or objects.3 The population of this study was second grade students at MTsNMaliku, there were three classes and the number of students were:
Table 3.2
Population
NO CLASSES NUMBER OF STUDENTS
1 VIII-A 30
2 VIII-B 30
3 VIII-C 30
Total 90
2. Sample
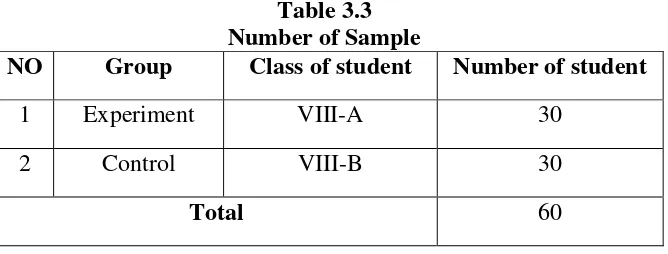
A sample is a portion of a population.4 In this study, the writer took two classes to be the sample. The first A class was experiment group. This class was treatment with using mnemonic device. The second B class was control group. This class was taught with using handout. The sample of this study was VIII-A as experiment class and VIII-B as control class which each class consist of 30 students. The number of student was 60 students.In this study, the writer used
3
Ibid, p. 148 4
cluster sampling because the unit chosen is not an individual but a group of individuals who are naturally together or grouped by the school.5
Table 3.3 Number of Sample
NO Group Class of student Number of student
1 Experiment VIII-A 30
2 Control VIII-B 30
Total 60
D.Research Instruments
To get the data, the writer used test in this study.
1. Test
A test is a set of stimuli presented to an individual in order to elicit responses on the basis of which a numerical score can be assigned.6 According to
H Brown Douglas, test is method of measuring a person‟s ability or knowledge
5
Ibid, p. 154 6
in a given domain.7 To get the data, the writer did the test; it consisted of pre test andpost test. The function of pre-test was to know pre-ability students‟ vocabulary before they used mnemonic device. And the function of post test was to know post-ability students‟ vocabulary after they used mnemonic device. The
test was used to see the result of students‟ vocabulary. The score of the test was used to measure the effect of mnemonic device in learning English Vocabulary process at the second grade of MTsNMaliku.
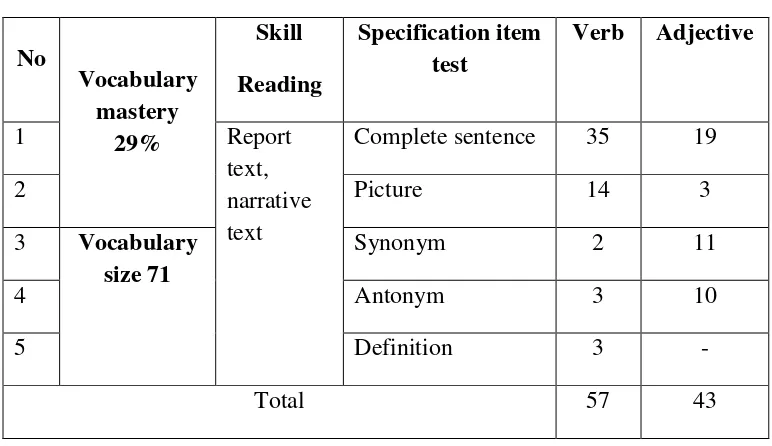
The writer made test based on the material and was appropriated with syllabus that used by the school. The form of test was multiple-choices. The test item was constructed in form of multiple choices, because multiple choices was objective test. Objective test was made just as easy or as difficult as the test constructor wishes.8 In this study, the students tested with multiple choices test these are synonym, antonym, and complete the sentence. So, the test will really
measure students‟ vocabulary . The test was constructed in the form of multiple
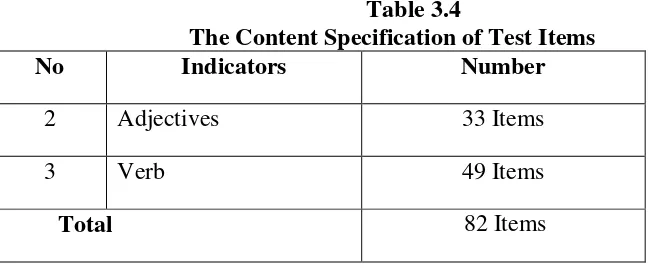
choices which consisted of 82 items, 41 items for pre test and 41 items for post test . 33 items test of adjectives, and 49 items test of verb as were showed in table 3.4. The writer took these two kinds of vocabulary because they were included as
7
H Brown Douglas, Teaching by Principles, p. 384. 8
two main forms of word. Two main forms of word consist of , verb, and adjectives.9
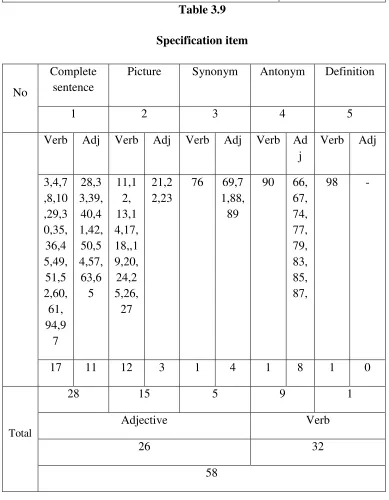
Table 3.4
The Content Specification of Test Items
No Indicators Number
2 Adjectives 33 Items
3 Verb 49 Items
Total 82 Items
2. Research Instrument Try Out
The writer gave test of try out to second grade students at MTsNMaliku. It was conducted on Wednesday, February 10th, 2016, at 08.20 – 09.40 am; in VIII-C rooms with the number of student were 30 students. To get the data of try out, the writer used some procedures as follows:
a. The writer made and prepared test of try out. b. The writer gave test of try out to the students c. The writer asked the students to do test of try out. d. The writer collected the student‟s answer.
e. The writer calculated and gave score to the students‟ answer.
f. The writer analyzed the result of try out to know valid of test try out.
9
g. If the results were valid, it meant that the test items as the instrument of this study is suitable to be give.
3. Scoring Method
To give the score of the students‟ test, the writer will use the formula10
as follow :
𝑺 = 𝑭
𝑵 ×𝟏𝑶𝑶
Where :
S = Score
F = Frequency of right answer N = Total item
For the data instrument of try out, it can be seen in appendix 9.
4. The test construction
In this study the writer used multiple choice. They are for measuring the student vocabulary mastery. The writer was construct the test for measuring the
students‟ master vocabulary. Each of the tests has different purpose. That is a form of questions, which to students before this given before a lesson. Test is
10
intended to get information about students understanding about their mastery of vocabulary after the treatment given to them.
In this study the writer used multiple choice. There are many type of multiple choice, here the writer choose multiple choice by consist of sentence, definition, meaning, and picture. It is useful to distinguish between the following two major kinds of multiple choice vocabulary items
And then from the result of post-test, the writer determine whether the treatment that was be given to the students is significant or not based on the differences or mean score between pre-test and post-test. Based the explanation above, so the writer geve specification item of the tests thse are, complete sentence, picture, synonym, antonym, and by definition.
100
Picture Synonym Antonym Definition
𝐷
=
(𝑁−𝑅𝐼
)(𝑂−1)
X 100%
Were : D : Distractor analyzes
I : The number of students incorrect option
N: The number of students taking the test
R: The number of students correct answer
O: Option of the test item
1: Konstanta
E.Research Instrument Validity
1. Instrument Validity
Validity of a test is the extent to which the test measures what is intended to measure.11 There were three types of validity:
a. Face Validity
Face validity is if a test item looks right to other testers, teachers, moderators, and testes.12 Narrative Text was the learning material in the second
11
semester at Junior High School. The writer made the type of test items suitable to the same level in the second year students at MTsNMaliku. The face validity of the test items as follow:
1. The kind of test was Vocabulary Test.
2. The form of test items was Multiple Choices. 3. The language of items used English.
4. The test items were suitable to the Junior High School b. Content Validity
This kind of validity depends on a careful analysis of the language being tested and of the particular course objectives. The test should be so constructed as to contain a representative sample of the course, the relationship between the test items and the course objectives always being apparent.13 In making the test, the writer tried to match each of the test items with the syllabus that used by MTsNMaliku. The writer made the test content (question) was related with material was taught to the students.
Table 3. 13
Specification of Content Validity
No Contents Type of test Items
12
J. B. Heaton, Writing English Language Tests, Longman, 1975, p. 153. 13
1 “Narrative Text” Multiple Choice
82
c. Construct Validity
If a test has construct validity, it is capable of measuring certain specific characteristics in accordance with a theory of language behavior and learning.14 Type of test was vocabulary test; the form of test was multiple choices, and the test was written test.
To measure the validity of the instrument, the writer used the formulation of product moment by Pearson as follows:15
rxy =
𝑁 𝑋𝑌 − 𝑋 𝑌
𝑁. 𝑋2− 𝑋 ² 𝑁. 𝑌2 − 𝑌 ²
Where:
rxy : Numeral of index correlation „r‟ product moment
N : Total of sample
∑XY : Amount of the product between X score and Y score
∑X : Amount of the x score
14
Ibid, p. 154. 15
∑Y : Amount of the y score
Furthermore, it was calculated using test t calculation as follow:
t observe =𝑟 𝑛 −2
1− 𝑟²
Where:
t : The value of t observed
r : The coefficient of correlation of the result of r observed
n : Number of students
The distribution of t table at alpha 5% and degree of freedom (n-2) with the measurement of validity using these criteria:
t observed ˃ t table = valid
t observed ˂ t table = invalid
To know the validity level of the instrument, the result of the test was interpreted to the criteria below:16
0,800 - 1000 = very high validity
0,600 - 0,799 = high validity
16
0,400 - 0,599 = fair validity
0,200 - 0,399 = poor validity
0,00 - 0,199 = very poor validity
From the measurement of validity of the try out that was consisted 100 items was known that there were 82 valid items (item ,2, 3, 4, 5, 6, 7, 8, 9, 10, 11, 12, 13, 14, 15, 16, 17, 18, 20, 21, 22, 23, 24, 25, 26, 27, 28,31, 32, 33, 34, 35, 37, 38, 39, 40, 41, 42, 43, 44, 46, 46, 50, 52, 53, 54, 56, 57, 58, 59, 60, 61, 62, 63, 64, 65, 66, 67, 68, 70, 71, 72, 73, 74, 75,76, 77,78, 81, 82, 83, 84, 85, 87, 88, 89, 90, 91, 92, 93, 94, 96, and 100), and there were 18 invalid items (item 1, 19, 29, 30, 36, 45, 47, 48, 49, 51, 69, 79, 80, 86, 95, 97, 98 and 99).
d. Index difficulty
The index of difficulty (or the facility value) of an item simply shows how easy or difficulty the particular item proved in the test. The index of difficulty (F.V) is generally expressed as the fraction (or percentage) of the students who answered the item correctly. It was calculated by using the formula:17
𝐹.𝑉 = 𝑅
𝑁
Where:
17
F.V : Facility Value.
R : Represents the number of correct answer.
N : The number of students taking the test.
The result of the test was interpreted to the criteria below:18
0,00 – 0,30 = Difficult
0,31 – 0,70 = Fair
0,71 – 1,00 = Easy
The result of index difficulty measurement of the try out showed that there were 2 difficult items( item 15 and 68). There were 25easy items( item 5,8,10, 16, 21, 23, 30, 36, 37, 38, 41, 51, 52, 61, 62, 66, 67, 71, 76, 81, 87, 88,92, and 92). There were 19 very easy items (item 11,12,13, 14, 18,19, 20, 22, 24,25, 26, 27, 35, 69, 73, 74, 91, 98 and 100,). There were 54 items moderate ( item 1, 2, 3, 4, 6, 7, 9, 17, 28, 29, 31, 32, 33, 34, 39, 40, 42, 43, 44, 45, 46, 47, 48, 49, 50, 53, 54, 55, 56, 57, 58, 59, 60, 63, 64, 65, 70, 72, 75, 77, 78, 80, 82, 83, 84, 85, 86, 89, 90, 93, 94, 95, 96, and 97).
F. Research Instrument Reliability
Reliability also means the consistency with which a test measures the same thing all the time. Reliability of a test refers to its consistency with which it yields the same
18
rank for an individual taking the test several times.19 The reliability of the whole test can be estimated by using the formula KR 2120
𝑟11 = The interpretation of reliability as follows:21
The criteria of reliability are : 0.90 – 100 = excellent reliability measurement of reliability of the try out.
19
Norman E. Gronlund, Measurement And Evaluation In Teaching (Fifth Edition), New York: Macmilan Publishing Company, 1985, p. 14.
20
Riduwan, MetodedanTeknikMenyusunTesis, Bandung: Alfaberta, 2010. p. 119. 21
G. Data Collection Procedure
To get the data, the writer used some procedures as follows:
1. The writer chose the place of the study.
2. The writer determined two groups, the first group was experiment group and the second group was control group.
3. The writer gave pre test to both classes (experiment group and control group). 4. The writer checked the result of pre test.
5. The writer gave treatment (teaching) to the experiment group using mnemonic device and the writer taught the control group using handout.
6. The writer gave post test to both classes. 7. The writer checked the result of post test.
8. The writer gave score to students‟ answer (pre test and post test).
H. Data Analysis procedure
To analyze the data has been collected; the writer used some procedures in this study:
1. The writer gave test to the students of the second grade students at MTsNMaliku. 2. The writer collected the data of the students‟ test result.
3. The writer gave score the students‟ test result by using the formula:22
22
Score = 𝐵
𝑁 × 100
Where:
B : Frequency of the correct answer N : Number of test items
4. The writer tabulated the data into the distribution of frequency of score table, then looking for the mean, median, modus, standard deviation, and standard error of experiment group and control group.
Formula of mean, median and modus:23 a. Mean
𝑀𝑥= 𝑓𝑥
𝑁
Where:
Mx : Mean
Fx : Total result product between each score with frequency
N : Number of case
b. Median
𝑀𝑑𝑛= 1 +
1 2
𝑁 − 𝑓𝑘𝑏
𝑓𝑖 ×𝑖
23
Where:
Mdn : Median
N : Number of case
Fkb : Cumulative frequency located in under interval contain median
Fi : Authentic frequency (frequency of score contain median)
i : Interval class
c. Modus
𝑀𝑜= 1 + 𝑓𝑎
𝑓𝑎+𝑓𝑏×𝑖
Where:
Mo : Modus
Fa : frequency located in above interval contain modus
Fb : frequency located in under interval contain modus
i : Interval class
Formula of standard deviation and standard error:24 d. Standard Deviation
24
𝑆𝐷= 𝑓𝑥²
𝑁
Where:
SD : Standard Deviation
i : Interval
N : Number of students
e. Standard Error
𝑆𝑒𝑚= 𝑠𝑑
𝑛 −1
Where:
Sem : Standard Error Sd : Standard Deviation N : Number of students
5. The writer calculated normality and homogeneity. a. Normality
Itwasusedtoknowthenormalityofthedatathatisgoingtobe analyzed whether both groups have normal distribution or not. Chi square was used here:25
25
2 = ( fo−fh )2 fh
Where:
𝟐 = Chi square
fo = frequency from observation fh= expected frequency
Calculationresultof𝟐wascomparedwithxtableby5%degreeof
significance. If 𝟐was lower than x table, so the distribution list was normal.
b. Homogeneity
It wasusedtoknowwhetherexperimentalgroupandcontrolgroup, thataredecided,comefrompopulationthathasrelatively samevariantor not. The formula is:26
F = Bigger Variant
Smaller Variant
Where: F :Frequence
The hypotheses in homogeneity:
Fvalue≤ Ftable, means both of variants are homogeneity. Fvalue>Ftable, both of variants are homogeneity.
IfcalculationresultofFwaslowerthanFtableby5%degreeof significance so Ho was accepted, it meant both groups have same variant.
26
I. Data Analysis Procedure
To answer the problem of the study about whether the mnemonic give
effect or not give effect on the students‟ vocabulary of the eight grade students at
MTsNMaliku, the writer analyzes the obtained data t-test, as follows:
𝑀1− 𝑀2
𝑆𝐸𝑚1− 𝑚2
Where:
M1-M2 : The difference of two mean.
SEm1-m2 : The standard error of difference between two mean.
With the criteria :
If ttest>ttables. Ha is accepted and Ho is rejected. If ttes<ttable, Ha is rejected and Ho is accepted
The writer uses the level of significansesalpa = 0,05. If the result of ttestis higher than ttable, it means Ha is acepted but if the result of ttesis lower thanttable. It mean Ho is accepted.
The analyze uses t-test to conclude the answer of the question in the research.
Test “t” or “t” test, is one of statistic test which is used to examine
the truth or the false of nil hypothesis that states if the two Mean Sample which is taken randomly from the same population, there is no significance difference.27
27
1. If the tois equal or greater than t value in the table ( withtt sign ), so the nil hypothesis stating that there is no Mean difference from the both sample is refused. It means the difference is significant.
2. If the to is less than tt it means the nil hypothesis stating that there is no Mean difference from the both sample is accepted.28 It means the difference is not significant.
3. The writer interpreted the result of t-test. The writer accounted degree of freedom (df) with the formula as follows:29
𝑑𝑓 = (𝑁1 +𝑁2−2)
Where:
df : Degree of freedom
N1 : Number of subject group 1 N2 : Number of subject group 2 2 : Number of variable
1. The writer discussed and concluded the result of data analysis.
J. Summary
To sum up, the steps in collecting, analyzing, and testing hypothesis could was described below. In the first step, the writer chose the place of the study. Second step, the writer gave test of try out (Try out class). Third step, the writer divided subjects
28
Ibid 29
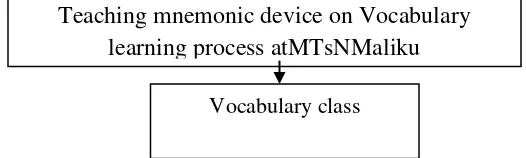
into two groups; experimental group and control group.Fourth step, the writer gave pre-test to the students and the writer gave score (experimental group and control group). Fifth step, the writer was given treatment using mnemonic device for experiment group and the writer was taught using handout for control group. Sixth step, the writer gave post-test and the writer gave score (experimental group and control group). Seventh step, before testing the hypothesis, the writer calculated normality and homogeneity test using SPSS program. Eighth step, the writer tested hypothesis to answer the research problem using t-test formula with manual calculation. Lastly, discussion on the results was made to clarify the finding, as described in figure below:
Figure 3.1 Steps of collecting, data analysis procedure and testing hypothesis
Teaching mnemonic device on Vocabulary learning process atMTsNMaliku
Experiment Group
Control Group
Give Treatment: Teach by using mnemonic device
Teach without using mnemonic device
Post-test
Analyzing: Testing Hypothesis using ttest
Score
Conclusion
Post-test