41
In this part, the writer described research methodology used in conducting
the research. It was purposed to answer the problem of the study. This chapter
consist of research type, research design, population and sample, instruments of
the study, instruments of try out, data collection procedures and data analysis
procedures.
A.Research Type
Considering the purposes of the research and the nature of the problems,
the type of research was quantitative research using cluster sampling. The
researcher took two classes as experiment and control class. Each class divided
into two groups; low and bright students. Low students group were those who
did not fulfill the minimum mastering score. Meanwhile, high students group
were students who fulfilled the minimum mastering score. The minimum score
was 60. Experiment class was sample class that gave treatment which the
teaching learning process used picture in teaching writing descriptive text. In
the other hand control class was class that the teaching learning process did not
use picture in teaching writing descriptive text.
B.Research Design
The research design of this study is factorial - experimental design using
two-ways ANOVA to analyze the data. Factorial Experimental design is one in
which the writer manipulates two or more variables simultaneously in order to
as the effects caused by interactions among the several variables.63 Two-ways
ANOVA is two independent variables are investigated.64
Experimental research involves a study of the effect of the systematic
manipulation of one variable on another variable. The manipulated variable is
called the experimental treatment or the independent variable (picture as
instructional media in teaching descriptive writing). The observed and
measured variable is called the dependent variable (low and bright students’
score in writing descriptive text).65
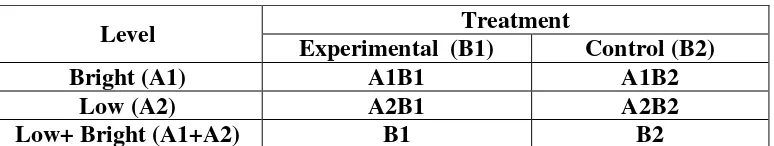
Table 3.1
The schema of factorial design
Level Treatment
Experimental (B1) Control (B2)
Bright (A1) A1B1 A1B2
Low (A2) A2B1 A2B2
Low+ Bright (A1+A2) B1 B2
Note:
A1: Bright Students
A2: Low Students
B1: Experiment Class
B2: Control Class
A1B1: Bright Students of Experiment class.
A2B1: low Students of Experiment Class.
A1B2: Bright Students of Control Class.
A2B2: Low Students of Control Class.
63
Donald Ary, Lucy Cheser Jacobs, Chir Sorense, Asghar Razavieh, Introduction to Research in Education, 8th Ed., USA: Wadsworth Cengage Learning, 2010, p. 311.
64Ibid
, p. 184. 65Ibid
C.Variable of The Study
Variable is a property or characteristic which may differ from individual
to individual or from group to group. A great deal of research is carried out in
order to identify or test the strength of relationships between variables. When
one variable influences or affects a second variable, the first variable is called
an independent variable, and the second is called a dependent variable. The
study included the following variables:
1. Independent variable: using picture media in teaching writing descriptive
text (X).
2. Dependent variable :
a. Writing score of bright students (Y1)
b. Writing score of low students (Y2).
The research had three variables that an independent variable (X) and
two dependent variables (Y1 and Y2). Independent Variable is using picture
media. Dependent Variable is (a).writing score of bright students (Y1) and
(b).writing score of low students (Y2)
D.Population And Sample 1. Population
A population is defined as all members of any well defined class of
people, events, or objects. If someone wants to research all of the elements in
research area, his/her research is called population research on census study.66
66Ibid
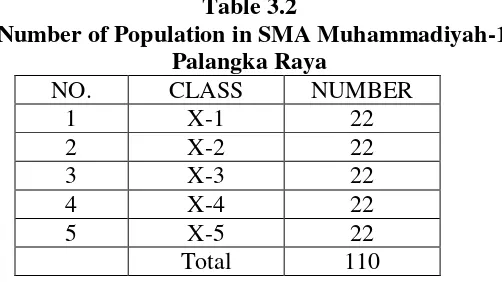
The Population of the study were all the students of first year students of
SMA Muhammadiyah-1 Palangka Raya, amount 110 Students in five classes
X1-X5 which each class consists of 22 students.
Table 3.2
Number of Population in SMA Muhammadiyah-1 Palangka Raya
NO. CLASS NUMBER
1 X-1 22
2 X-2 22
3 X-3 22
4 X-4 22
5 X-5 22
Total 110
2. Sample
Sample is a subset of individuals or case from within a population.67
Based on the population which is grouped into classes, the sample of this study
was class or cluster. In this case, class was considered as a unit or group. In this
study, there was two samples based on purposive technique. The sample was
class X-4 and X-1. Class X-4 was as experimental class, X-1 was as control
class. Whereas X-2 will be as try out class. The writer chose class X-4 and X-1
as sample because these two classes were considering having similar number
of students and similar writing ability who representative whole students’
writing ability.
67
E.Research Instrument 1. Test Type
The type of the test used to collect the data was in the form of writing
test, especially descriptive writing test using and without picture as teaching
media. The test consists of the instructions and statement the subjects
addressed in their writing and the alternative topics to be chosen. In this sense,
the students were assigned to choose one of topics that interest. They asked to
develop the topic into a text containing about 100-150 words. The allocated
time to do each writing test was 90 minutes.
2. Test Construction
The construction was based on the objective of the study. The study was
aimed at finding the effectiveness of using picture media toward bright and low
level students’ achievement in writing descriptive text at first year students at
SMA Muhammadiyah-1 Palangka Raya. To investigate the effectiveness of
using picture media toward bright and low level students’ achievement in
writing descriptive text at first year students at SMA Muhammadiyah-1
Palangka Raya, the subjects were assigned to write descriptive text. The result
of two tests were investigated using statistical analysis and the outcomes were
compared to see the effects of using picture media toward bright and low level
of students’ achievement.
To gain the appropriate writing test for the aim of this study, the writer
trying out (pre-test) the test and analyzing the result, and (d).carrying out the
test.
a. Planning the writing test
To produce a good writing test, the writer made plan on the test
construction. In this sense, the objective of the test was determined. Then, the
writer decided the appropriate type of test. The test type and test objectives
were very close. The test objective cannot be achieved without having
appropriate test type. Then, the writer care for the adequacy of the content. The
test content should match with test types and objectives. Lastly, the time
allocation for the test administration plans as well as the instrument try out.
b. Preparing The Writing Test
The writing test was used to elicit the data covering direction and
instructions of what the subjects have to do. To make the instruction clear and
understood by the students, the instructions must be simple. The instruction
was accompanied with several alternative topics. The topics were the ones the
students familiar and could develop into composition.
In Sabarun thesis, to construct the directions, the writer took into account
the guidelines applied by Clouse as follow: (1).The question should be clear,
(2). The question should be brief, (3).The question should be definite, (4).
Avoid question requiring yes or no answers, (5).Average students should be
able to write answer to the questions, (6). The vocabulary used and the
to understand immediately, (7). The instructions should provide an organizing
principle for composition.68
The writing instructions were designed to measure the students’ writing
ability. The students’ ability was scored on the basis of the marking scheme
that contains some features or component of writing such as content,
organization, sentences structure, and grammar, usage and mechanics of the
students’ writing.
c. Test Try Out
In order to prove the test was suitable to the students who were the
sample of this study, the writer conducted a try out test. Then the writer chose
student in the some school but different class to try out the test. The try out test
conducted at SMA Muhammadiyah Palangka Raya. XI -2 was the try out class
with 22 students. The result was valid, it meant that the test item as the
instrumentation of this study was suitable to be given.
3. Research Instrument Reliability
Reliability is a necessary characteristic of any good test for it to be valid
at all. A test must first be reliable as a measuring instrument. It is the degree of
consistency with which it measures whatever it is measuring.69 Similarly,
Sekaran stated that reliability is the extent of consistency and stability of the
measuring instrument. In this case, to score composition as fairly and
consistently as possible. Reliability refers to the consistency with which a test
68
Sabarun, The Effectiveness of Using Clustering Technique in Writing Expository Essays of the Fourth Semester English Department Students of Palangka Raya, Unpublished Individual Research Proposal, Palangka Raya: STAIN Palangka Raya, 2013, p. 37.
69
measured whatever it measured.70 In this study, reliability of the writing test
mainly focuses on the rater reliability since the score are obtained from the
judgment of two different raters. Here, the consistency in rating score is very
important in measuring the students’ writing skill. The consistency can be
achieved through rater training.
In rather reliability, there are inter-rater reliability and intra-rater
reliability. Inter-rater reliability is the consistency of the judgment of several
raters on how they see a phenomenon or interpreted the responses of the
subject. It indicates accuracy in scoring composition of two different raters.
Meanwhile, intra-rater reliability referred to the consistency of the rater in
scoring the same paper at two different points of time. It points out an
individual accuracy in scoring a particular composition.71
In this study, the writer applied inter-rater reliability; two raters would
employed to score the students’ writing. The two raters were the writer self and
one of English teacher of SMA Muhammadiyah-1 Palangka Raya.
One important thing in using the inter rater method in rating process was
focused with the training of the raters. It can maximize the accuracy of the
writing assessment. This made the raters be consistent in scoring and avoid
subjectivity of the raters in scoring. For this purpose, the training was done to
get inter rater agreement in order to give reliable scores to students’ writing
product.
70
Hopkins, C.D & Richard, L.A, Classroom Measurement and Evaluation. Illinois: F.E. Peacock Publisher, Inc, 1990, p. 295.
71
Relevant to this, Nunan stated that the acceptance reliability on
composition score is possible to get through careful training of raters.72
Furthermore, Latief argue that reliability on composition is affected by both
raters and writers of the text. Raters’ reliability refers to the accuracy of the
raters judgment. Meanwhile, writers’ reliability refers to the accuracy of the
writers’ performance.73
To obtain inter- rater reliability, the score of two raters were correlated
using SPSS program. Then the writer got the interpretation of coefficient
correlation, whether they belong to high, moderate, or positive weak negative
inter rater reliability category. The obtained coefficient should indicate that the
students’ writing products both using picture media and without using picture
media have achieved the acceptable level of reliability. Calculation result of
was compared with r table by 5% degree of significance with df= N-2. If
was higher than r table so it meant reliable and if r was lower than r table so it
meant unreliable. In this case, the writer applied the coefficient correlation and
the interpretation of inter-rater reliability proposed by Winkle et al as shown in
table 3.3. 74
72
David Nunan, Research Methods in Language Learning,Cambridge: Cambridge University Press,1992 , p. 56.
73
M . Latief Adnan, Reliability of Language Skill Assessment Result, Jurnal Imu Pendidikan VIII No. 3, 214-224, 2010.
74
Table 3.3
Inter-Rater Coefficient Correlation and Interpretation
Correlation Coefficient Interpretation
.90 to 1.00 or -.90 to -1.00 Very high positive or negative correlation .70 to .89 or -.70- to -.89 High positive or negative correlation .50 to .69 or -.50 to -.69 Moderate positive or negative correlation .30 to .49 or -.30 to -.49 Low positive or negative correlation .00 to .29 or -.00 to -.29 Little if any correlation
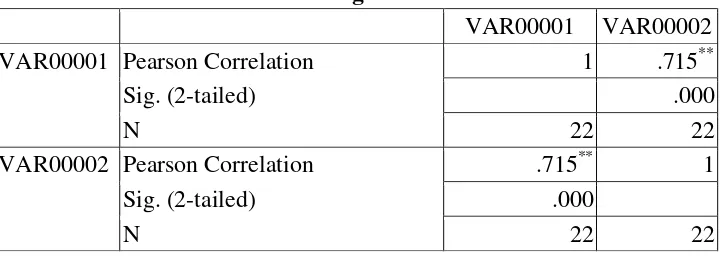
Table 3.4 Testing of Correlations
VAR00001 VAR00002
VAR00001 Pearson Correlation 1 .715**
Sig. (2-tailed) .000
N 22 22
VAR00002 Pearson Correlation .715** 1
Sig. (2-tailed) .000
N 22 22
**. Correlation is significant at the 0.01 level (2-tailed).
Based on the calculation above used SPSS program, the r was 0.715. Then it was consulted with r table of Product Moment with df= 22-2= 20, the level of significance 5% so r table = 0.4227. Because r =0.715 > r table= 0.4227. It could be concluded that the try out was reliable.
Based on the Result of Instrument Reliability above, it was known that
the coefficient of reliability was 0.715 with the Criteria High positive
Reliability. It meant that the instrument could be used as the Instrumentation of
4. Research Instrument Validity
Validity is a measurement which shows the grades of number of an
Instrument. A valid Instrument must have high validity, it means that an
Instrument which lacks validity is said to be Invalid instrument.
An instrument is called a valid one when it can measure something which
is wanted by covering the variable studied exactly. The method used in
measuring the validation of the instrument is called content validity. A test or a
measurement can be called a content test when it measures the special purpose
which is equal with the material or content given.
a. Face Validity
The types of face validity, if the test items look right to other testers,
teacher, indicators and test. The types of test items, which would use in this
research, can be suitable to the others at the same level was Senior High
school. 75
For face validity of the test items as follow:
1) The test used written test in writing test instruction.
2) The evaluation by written test based on scoring system.
3) Kind of the written test was writing descriptive text.
4) The Language of items used English
5) The written test was suitable with syllabus of English writing for first year
students at SMA Muhammadiyah-1 Palangka Raya.
75
b. Content Validity
This kind of validity depends on a careful analysis of the language being
tested being testes and of the particular course objective. The test should be so
constructed as to contain a representative sample of the course, the relationship
between the test items and the course objective always being apparent.76 The
instrument which used test, the tasting of content validity is done by asking the
opinion of the judgment experts about the instrument is able to try out or not.
F. Data Collection
To answer the research problems: (1).Does teaching picture media give
effect on bright students in writing descriptive text at first year Students at
SMA Muhammadiyah-1 Palangkaraya ? (2). Does teaching picture media give
effect on low students in writing descriptive text at first year Students at SMA
Muhammadiyah-1 Palangkaraya ? (3). Does teaching picture media give effect
on low and bright students in writing descriptive text at first year Students at
SMA Muhammadiyah-1 Palangkaraya ?
To collect the accurate data in this study, the writer selects the
instruments that appropriated for the problem statement:
1. Documentation
Documentation method is used to look for the data concerning matters or
the variable that are taken in the form of the note, transcript, book, newspaper,
magazine, inscription, notulen, lengger, agenda, etc. it refers to the archival
data that help the writer to collect the needed data. In this study, this method is
76
used to get the data that related to the object of research such as students’ name
list which are included in the population. In this case, the data was gained by
the help of the English teacher.
2. Test
Test is a set of questions or exercises and other tools which are used to
measure skill, intelligence, knowledge, and ability those are had by individual
or group.77 This method is used to get data about score of the pre-test and
post-test that was given for both of groups. The post-test in this study was writing post-test.
The students were given a free chance to think as much as possible. They could
freely express and organize their ideas in written form.
a) Pre- test
Before the writer taught new material by using picture, the writer
gave a test to the students. Pre-test was given to the experiment class and the
control class. This test was given before the experiment applied.
b) Post- test
Post-test was given to the experiment class and the control class. The
test was given in order to know the improvement of students’ ability in
writing descriptive text. The post-test gave to the experiment class and
control class after receiving treatment. The experimental groups taught
descriptive writing through picture the control groups taught descriptive
writing without picture (by using lecturing only).
For collecting the data, the writer used some steps in the procedure as
follows:
1. The writer observed the class
2. The writer determined the class into experimental group and control group.
3. The writer gave Pre-Test to experimental group and control group.
4. The writer classified the group into bright and low students.
5. The writer gave treatment to experimental group that was taught by picture
media.
6. The writer gave Post-Test to experimental group and control group.
G.Data Analysis
The data of this study were low and bright students’ writing score.
Therefore, the data were in quantitative data. The data were analyzed by means
of inferential statistics. This statistical analysis was suitable to answer the
research problem. In this case, the writer applied two-ways ANOVA to
examine the significant difference score between the low and bright students
who taught by picture media in writing descriptive text and the low who taught
without picture in writing descriptive text.
1. Technique of Analyzing Data
Before analyzing data using Anova Test, the writer fulfills the
a. Normality Test
It is used to know the normality of the data that is going to be
analyzed whether both groups have normal distribution or not. In this study
to test normality the writer applied SPSS 17 program using Kolmogorov
Smirnov with level of significance α=5%. Calculation result of asymptotic
significance is higher than α (5%) so the distribution data was normal. In the
contrary, if the result of asymptotic significance is lower than α (5%), it
meant the data was not normal distribution. 78
b. Homogeneity Test
Homogeneity is used to know whether experimental group and
control group, that are decided, come from population that has relatively
same variant or not. To calculate homogeneity testing, the writer applied
SPSS 17 program using Levene’s testing with level of significance α (5%).
If calculation result was h i g h e r than 5% degree of significance
so Ha was accepted, it means both groups had same variant and
homogeneous.79
c. Testing Hypothesis
The writer applies the two- ways ANOVA statistical calculation to
test hypothesis with level of significance α (5%) two-ways ANOVA could
be applied to test a difference mean or more. The steps are as follows:80
78
Jean D. Gibson and Subhabrata C., Nonparametric Statistical Inference, 4th Ed., New York: Marcel Dekker, Inc., 2003, p. 111
79
Analisis Data dengan SPSS, http://pasca.undiksha.ac.id/elearning/staff/dsnmateri/4/1-45.pdf (online 24 June 2014).
80
a. The total sum of squares
SSt= ∑X2t– ∑
Where
SSt = sum of square total
∑X2
= each score squared, then summed
(∑Xt)2 = all the scores summed first, then this sum squared
N = number of scores
b. The sum of squares between groups
SSb = ∑ + ∑ - ∑
c. The sum of squares within groups
SSw = SSt - SSb
d. The between-columns sum of squares
SSbc = ∑ + ∑ - ∑
e. The between-rows sum of squares
SSbr = ∑
+
∑ -
∑
f. The sum of squares interaction
SSint = SSb – (SSbc + SSbr)
g. Determine the number of degrees of freedom associated with each
df for between-columns sum of squares = C − 1
df for between-rows sum of squares = R − 1
df for interaction = (C − 1)(R − 1)
df for between-groups sum of squares = G − 1
df for within-groups sum of squares = N −G
df for total sum of squares = N − 1
where:
C = number of columns
R = number of rows
G = number of groups
N = number of subjects in all groups
h. The mean square values by dividing each sum of squares by its
associated number of degrees of freedom.
i. Compute the F ratios for the main and the interaction effects by
dividing the between-groups mean squares by the within-groups
mean square for each of the three components.
2. Data Analysis Procedure
The writer do some ways in the data analysis procedures, they are as
follows:
1. Collecting the students’ written scores of Pre- test and Post- test.
2. Arranging the obtained score into the distribution of frequency of score
3. Calculating mean, median, modus, standard deviation and standard error
of students’ score.
4. Measuring the normality, homogeneity.
5. Analyzing the data by using two-ways analysis of variance to answer the
problem of the study. In addition, the SPPS program was applied.
6. Interpreting the result of analyzing data.
7. Making discussion to clarify the research finding.
8. Giving conclusion.
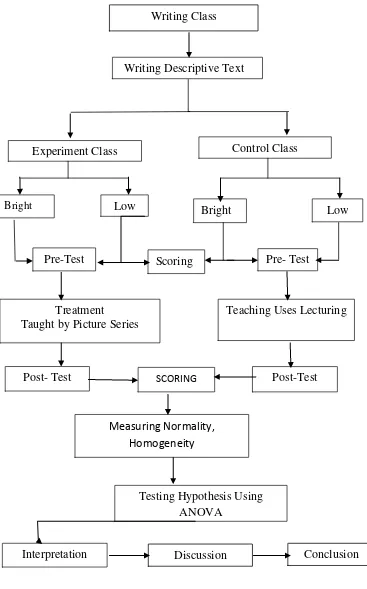
9. Summary
To sum up, the steps in collecting, analyzing, and hypothesis testing
can describe below. In the first step, the students gave Pre- Test that they
selected the topic for descriptive text. The subjects were divided into two
groups; experimental group and control group. Experiment group was
assigned to write a descriptive text using picture media and control group
write without picture. Second step, the students’ writing both using picture
or without picture was scored by two raters. To analyze the data of writing
scores, two ways ANOVA test was employed. ANOVA test is a statistical
computation used to test significant difference between within group and
between group. Before testing the hypothesis, normality and homogeneity
measured to fulfill the assumsions. Third step, the research hypothesis
would be test to answer the research problem. Lastly, discussion on the
Teaching Uses Lecturing Writing Descriptive Text
Experiment Class Control Class
Bright Low Bright Low
Pre-Test Scoring Pre- Test
Treatment
Taught by Picture Series
Post- Test SCORING Post-Test
Measuring Normality,
Homogeneity
Testing Hypothesis Using ANOVA
Interpretation
Writing Class
Discussion Conclusion