INTRODUCTION
Until the year 2008, the Indonesian livestock trade
balance was defi cit (BPS, 2009). As the income and the
education of the people improves, the consumption of animal proteins, including chicken, is projected to
in-crease. In the future, raising beef ca le will be a empted,
but economically, the commodity that provides the larg-est contribution on gross domlarg-estic product for livlarg-estock sub sector is chicken (BPS, 2009). Chicken is undeniably
the consumers’ main choice in fulfi lling their needs for
animal proteins. This is because of its relatively cheap price compared to other meats.
Data from Direktorat Jenderal Peternakan (2007) showed that chicken consumption in Indonesia in 2005 was 824,560 tons. Domestic production in the same year was 779,106 tons. This lack of supply instigated the en-try of broilers, mostly in the form of chicken leg quarters, from the US. This market opportunity should have been made the most of, because the development of poultry
industries in developing countries has a signifi cant role
in building rural communities (Mack et al., 2005).
Feasibility Analyses of Integrated Broiler Production
M. Firdausa * & L. Komalasarib
aFaculty of Economics and Management, Bogor Agricultural University
Jln. Kamper, Kampus IPB Darmaga, Bogor bFaculty of Animal Science, Bogor Agricultural University
Jln. Agatis, Kampus IPB Darmaga, Bogor 16680
(Received 01-07-2010; accepted 21-12-2010)
ABSTRACT
The major obstacles in the development of broiler raising is the expensive price of feed and the fl uctuative price of DOCs. The cheap price of imported leg quarters reduces the competitiveness of the local broilers. Therefore, an eff ort to increase production effi ciency is needed through integration between broiler raising and corn farmers and feed producers (integrated farming). The purpose of this study is to analyze the feasibility of integrating broiler raising with corn cultivation and feed production. Besides that, a simulation was conducted to analyze the eff ects of DOC price changes, broiler price and production capacity. The analyses showed that integrated farming and a mere combination between broiler raising and feed factory of a 10,000 bird capacity is not fi nancially feasible. Increasing the production to 25,000 broiler chickens will make the integrated farming fi nancially feasible. Unintegrated broiler raising is relatively sensitive to broiler price decreases and DOC price increases compared to integrated farming.
Key words: broilers, fi nancial feasibility, integrated farming
* Corresponding author:
Faculty of Economics and Management, Bogor Agricultural University Jln. Kamper, Kampus IPB Darmaga, Bogor
E-mail: fi [email protected]
Generally, the broiler industry is profi table due
to the short cycle, which is less than two months. According to North & Bell (1990), broilers are chickens slaughter at the age of approximately seven weeks and weight 1.8 kg. The ever-present demand causes the quick capital turn-over.
The highest cost in broiler production is the expenses on feed. The feed itself takes up 70% of the total production cost. The 2% reduce in feed price will
increase the profi t up to 8% (Bahrends, 1990). The
ex-pensive price of feed is mainly caused by the imported ingredients, such as corn. The production cost of broiler using the corn as feed is more expensive compared to tofu and sago by-products (Nuraini, 2009). Chicken feed consists of 40%-50% corn; the remainder is bran, by
products of copra, and fi sh meal. Therefore, corn price will determine chicken feed price. The fl uctuations of
input and global competition are currently the two
fac-tors aff ecting the development of the poultry industry
(Chang, 2007).
On the other hand, data from the BPS 2009 showed an increasing trend of chicken leg quarter import. The lower price of imported chicken is becoming a challenge
for local poultry industries to increase production effi -ciency. This eff ort not only concerns the poultry
produc-tion, but also the raw material production (Ilham et al., 2002).
Currently, the small scale broiler farms are still limited to broiler production alone. An alternative to
increase broiler production effi ciency is to integrate
between chicken raising and corn cultivation and feed production. Chicken-produced feces that can be pro-cessed into fertilizer, the most expensive input in corn cultivation. According to Hayes (1996), chicken feces have a potassium-nitrogen ratio that is most suitable for corn cultivation. The corn harvested is then converted into chicken feed, which is the highest cost component
of the feed. With a be er management, the profi t gained
by the farmer will increase (Cyrilla et al., 2010; Bojnec &
Latruff e, 2008).
The development of a model of integrated farming, combining broiler-raising with corn cultivation and feed plant, requires a lot of investment. This sort of industry needs precise planning so that the money invested gives
proper profi t to the parties involved. A business
feasibil-ity analysis is needed in developing the plans.
This study was carried out to analyze whether broiler-raising integrated with corn cultivation and feed
production is fi nancially feasible. Besides this, an
analy-sis was done to evaluate the sensitivity of the industry
towards broiler price and DOC price fl uctuations in
two production scales, the 10,000 bird and 25,000 bird scales. The 10,000 bird capacity was chosen because the majority of small scale farmers have this amount of chickens. Whereas the 25,000 bird expansion scale was
chosen as it will probably give benefi ts from economies
of scale. With a proper production scale, the livestock
production effi ciency is expected to increase. According to Alabi & Aruna (2005), one of the factors aff ecting the chicken-raising technical effi ciency is increasing the
production of live chickens through appropriate feeding and innovation.
METHODOLOGY
This study was conducted from 2008 to 2009. The
technical coeffi cient for chicken-raising was obtained
through a survey of small scale (10,000 birds) broiler farms in Caringin Village, Sub District Dramaga, Bogor. The data used in this study are both primary and sec-ondary data. Primary data was collected by taking one case of broiler farms, two feed experts and two farm waste experts. Primary data includes broiler production data consisting of investment and operational cost com-ponents and also input and output prices. Secondary data was obtained from the Ministry of Agriculture and Central Statistical Agency. Secondary data consists of the corn cultivation aspect, export and import of chicken meat and other relevant data. The data obtained were processed qualitatively and quantitatively. Data
processing was done by fi nancial feasibility analysis.
A descriptive method was used to discern the image of the corn cultivation, feed production, and broiler-raising
production process. A fi nancial analysis was done to analyze costs and benefi ts of the combination of
busi-nesses, conducted through investment feasibility criteria and switching value analysis.
There were three models of business combinations analyzed in this study, which are formulated based on the real data from broiler farms. They were:
Model 1. The Non-integrated Broiler Production
In this model, only the broiler production activities were analyzed. Feed, the largest cost component, was assumed to be bought from PT. Charoen Pokphand, composed of the starter feed with a protein content of
21%–23%, and the fi nisher feed with a protein content of
19%–21% and metabolizable energy of 3,000–3,200 kcal. Every year starting from year one, there were six cycles of broiler production.
Model 2. The Integrated Broiler – Feed Production In this model, broiler production was combined
was imported, thus there was no need to wait or the corn harvest. The feed was then sent directly to the farms.
Model 3. Integrated Broiler Production
In this model, the corn cultivation, broiler produc-tion, and feed production activities were integrated. The corn cultivation activity produced dry, shelled corn which was used in the plant as the main ingredient in the broiler feed. The feed produced was directly used as the broiler feed, and the feces collected from the farm were used as a fertilizer in the corn cultivation. In the
fi rst year, the feed plant started to operate in the fourth
month because the corn could only be harvested after
The criteria used in conducting investment feasibil-ity were:
a. Net Present Value (NPV)
NPV is the diff erence between the current value of benefi t and cost. The formula for NPV is:
A project or investment is feasible if NPV is positive
b. Internal Rate of Return (IRR)
The IRR value is determined by fi nding the
dis-counted factor value which will yield an NPV value of zero. To determine the exact interest rate inter-polation method is utilized, which is inserting the interest rate between the interest rate that yields a positive NPV and the interest rate that yields a
ative NPV. This method is formulated as follows:
Source: Kadariah & Clive (1999)
Explanation:
i1= the discounted factor that yields a positive NPV i2= the discounted factor that yields a negative NPV NPV1 = positive NPV
NPV2 = negative NPV
A project or investment is feasible if the IRR is
higher than the interest rate in eff ect.
c. Benefi t Cost Ratio (Net B/C)
Benefi t Cost Ratio (Net B/C) is the ratio of the sum of positive and negative present value benefi t. Net B/C is used to see how much the net benefi t a
proj-ect might receive for each rupiah spent. To calculate
Net B/C the discounted value net benefi t for each
year is ascertained beforehand. The formula used is:
Source: Kadariah & Clive (1999)
Explanation:
Payback period is the minimum time to return the
initial investment in the form of a cash fl ow based
upon the net revenue subtracted by all costs. The shorter the payback period, the faster the return of the investments will be. To calculate the payback
period, the cash fl ow must fi rst be ascertained, and then the net benefi t is cumulatively calculated from
year to year and the mean is found. The payback period can be calculated from the investment
divi-sion with the subjective mean of the net benefi t. The
formula is:
Payback period = __________________________Investment value
Subjective mean of net benefi t
Source : Pudjosumarto (1991)
The payback period can not be used to judge the feasibility of a project, but it is used to see how long the project needs to return its investment. Payback period calculations do not consider time value of money.
2. Switching Value Analysis
To see the eff ect of changes in costs or benefi ts
caused by external factors, such as input and output prices, the switching value analysis can be utilized. These two variables were chosen because chicken-rais-ing businesses in developchicken-rais-ing countries are usually very sensitive to changes in feed price and live-chicken price (Hayes, 1996; Sonaiya, 1995). In developed countries, such as the US, the poultry production is not sensitive to feed price. The elasticity of poultry production to the changes in feed price are only 0.06 (Eales & Unnevehr 1993). The study done by Udoh & Etim (2009) show that
the factor that eff ects chicken-raising effi ciency the most
in urban areas in Nigeria is also feed price. The switch-ing value analysis was done by trial and error method until a zero NPV is obtained. In this study, the changes in DOC and live-chicken prices were analyzed.
The prices of DOC and live-chicken in the market
are prone to fl uctuations. They often fl uctuate highly and are diffi cult to predict. The cause of DOC price fl uctuations is because the breeding farms often produce
an unsuitable number of DOCs for the market demand. At times there are over-demands and at others over-sup-plies. For the broiler price, if there is a decrease in price
at the consumer level, it is quickly transmi ed to the
farms, but if there is an increase, the transmission occurs slowly. This is one of the reasons why the price of live chickens at farm level often fall (Saragih, 2000).
Assumptions for All Models
In this study, some assumptions were made from
fi eld surveys and relevant secondary data were used. The assumptions were classifi ed into two groups,
as-sumptions for all models and asas-sumptions for individual models.
1. The project duration is ten years, based upon the economical age of the coop buildings.
2. The interest rate used is the interest rate for loans from Bank Rakyat Indonesia (BRI) year 2008 which was 17%.
3. The main product is live chickens weighing 1.7 kg with a mortality rate of 4%.
4. The price of live chickens is assumed to be fi xed at
12,500 IDR per kg for the ten years of study. This price was the market price when the study was conducted.
5. The broiler strain used was the Hubbard, with an FCR (feed conversion ratio) of 1.7, meaning in order to produce 1 kg of body weight, 1.7 kg of feed is needed.
6. In a single year, there are six production cycles. One production cycles lasts for 35 days.
7. In the raising period, a single chicken consumes 2.89 kg of feed.
8. All input prices in the analyses are constant.
9. The income tax rate is based upon Undang-Undang Pajak No. 17 year 2000 which is:
IDR) + (15% x (Total income – 50,000,000 IDR)). c) For incomes above 100,000,000 IDR, the tax rate is
higher than 100,000,000 IDR, the tax rate is (10% x 50,000,000 IDR) + (15% x 50,000,000 IDR) + (30% x (Total income – 100,000,000 IDR)).
Assumptions for model 1 and 2
1. The land for building the broiler farm and the feed plant were purchased for 100,000 IDR per m2.
2. The secondary product is chicken droppings that sell for 1,500 IDR per 30 kg sack.
Assumptions for model 2 and 3
1. In order to fulfi ll the feed needs for 10,000 birds of
chickens, the feed plant must manufacture at least 600 kg of feed daily. For 25,000 chickens, the minimum is 1,600 kg daily.
2. For the 25,000 chicken capacity, if there is a surplus of feed, it can be sold for 3,500 IDR per kg.
Assumptions for model 2
Corn, the main ingredient in broiler is purchased from PT. Eka Matra for 3,000 IDR per kg for the 10,000 bird production capacity and 2,700 IDR per kg for the 25,000 head capacity due to the larger amount bought.
Assumptions for model 3
1. The land used for the corn cultivation is leased. 2. The variety of corn used is the BISI 16 hybrid with an
8 ton per hectare productivity. The water content in
the shelled corn is 11% (NRC, 1994). The corn seed is produced by PT. Bisi Internasional and distributed by PT. Tanindo Subur Prima.
3. In one year, there are three corn planting seasons. One planting season lasts for three months.
4. The land for corn cultivation for 10,000 birds of chicken is divided into two hectare plots. The planting seasons between the two plots are spaced by two months so that the corn harvest occurs every two months. For the 25,000 bird capacity, the land is divided into four 2.5 hectare plots. The plantings are spaced one month, so that the harvest occurs every month.
5. The planting distance for the BISI 16 hybrid is 65 x 15 cm.
6. Besides for feed, at the 25,000 bird capacity, shelled corn is also produced. It is sold for 2,500 IDR per kg.
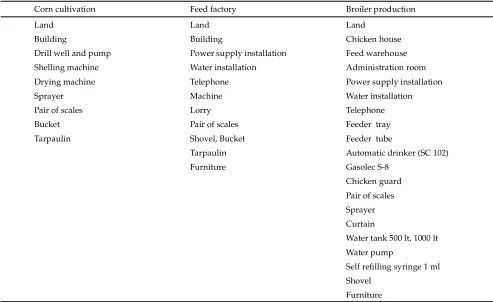
Components on investment for running the corn cultivation, feed factory and broiler production are presented in Table 1.
RESULTS AND DISCUSSION
The Best Alternative Model
In this section, the results of fi nancial analyses for
each model are elucidated. The brief comparison of the investments of the three models is displayed in Table 2. In the 10,000 bird capacity, the model found to work
Corn cultivation Feed factory Broiler production
Land Land Land
Building Building Chicken house
Drill well and pump Power supply installation Feed warehouse
Shelling machine Water installation Administration room
Drying machine Telephone Power supply installation
Sprayer Machine Water installation
Pair of scales Lorry Telephone
Bucket Pair of scales Feeder tray
Tarpaulin Shovel, Bucket Feeder tube
Tarpaulin Automatic drinker (SC 102)
Furniture Gasolec S-8
Chicken guard
Pair of scales Sprayer Curtain
Water tank 500 lt, 1000 lt
Water pump
Self refi lling syringe 1 ml
Shovel Furniture
best is model 1 (only producing live chickens). From
the fi nancial analysis, an NPV of 59,454,837 IDR was
discovered. This means that the current value of revenue received during the ten years with an interest rate of 17% is positive. The net B/C was 1.07. This value shows
that every 1.00 IDR spent will generate a net benefi t
of 1.07 IDR. This net B/C proves that the broiler farm
model with a 10,000 head capacity is fi nancially feasible.
Seen from the payback period, the model has a relatively quick payback period, which is four years, six months and ten days.
For model 2, the analysis for the 10,000 bird
capac-ity showed that this model was not fi nancially feasible.
If carried out, it will result in loss. From the analysis, the NPV was found to be -404.398.629 IDR. This means that the current value of revenue received during the ten years with an interest rate of 17% is negative. The loss is due to the large operational cost of the feed plant, including plant maintenance. The Net B/C was 0.65.
This means that for every 1,00 IDR spent, a net benefi t of
0.65 IDR is generated. The company will spend a larger sum than is expected to be received. The IRR found in the 10,000 bird capacity is 7.12%, less than the current interest rate. In this model, the business’ payback period is seven years, ten months and twenty seven days. Any agricultural business that has a payback period
exceed-ing fi ve years is considered una ractive.
The analysis of the 25,000 bird capacity broiler production showed that the best model is the integrated broiler production or model 3. The IRR for model 3 is
higher than the two other models, 30.60%. The NPV was 1,481,498,164 IDR, meaning that the current value of rev-enue received during the ten years with an interest rate of 17% is 1,481,498,164 IDR. Both the NPV and the net B/C of this model exceed the other two models. The inte-grated broiler production has a quicker payback period than the 10,000 head capacity, a mere three years, two months, and twelve days. This means that even though the investment required for the corn cultivation and feed plant is huge, this farming model generates the largest
economic benefi t compared to the other two models if
run at a 25,000 bird capacity.
Switching Value Analysis
The switching value analysis is a variation of the
sensitivity analysis (Gi inger, 1986). In this study, this analysis is used to discover the eff ect of decreases in
the broiler price and increases in the DOC price on the business’ feasibility. The indicator is when the NPV is zero. The switching value analysis is done on businesses
that are fi nancially feasible. The results for the analysis
of various models of broiler farm combinations can be seen in Table 3.
The Decreases in broiler price. In model 1 simulation 1: 10,000 bird production capacity, the maximum decrease
in broiler price where the business is still profi table is
1.04%. This means that if the company sells the broil-ers for less than 12,375 IDR per kg, the business will be
Note: Model 1= the non integrated broiler production, Model 2= the integrated broiler-feed production, Model 3= integrated broiler production. Simulation of 1 and 2 are of the 10,000 and 25,000 bird capacity.
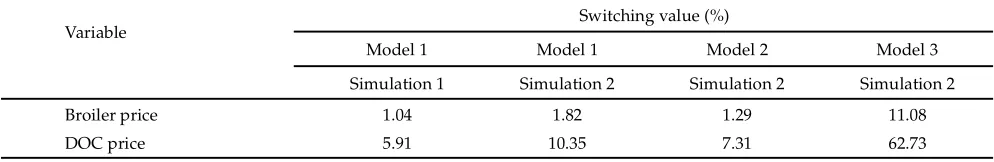
Table 3. The comparison of the switching value analysis for models 1, 2, and 3 of broiler production, Caringin Village, Sub District Dramaga, Bogor, 2008-2009.
Note: Model 1= the non integrated broiler production, Model 2= the integrated broiler-feed production, Model 3= integrated broiler production. Simulation of 1 and 2 are of the 10,000 and 25,000 bird capacity.
Model Investment criteria
NPV (IDR) Net B/C IRR (%) Payback period (year)
Model 1 simulation 1 59,454,837 1.07 18.29 4.53
Model 1 simulation 2 260,368,929 1.12 20.83 4.30
Model 2 simulation 1 -404,398,629 0.65 7.12 7.91
Model 2 simulation 2 183,851,649 1.08 19.85 4.50
Model 3 simulation 1 -202,232,763 0.84 13.91 5.90
Model 3 simulation 2 1,481,498,164 1.59 30.60 3.20
Table 2. The comparison of investment criteria among models of broiler production, Caringin Village, Sub District Dramaga, Bogor, 2008-2009
Variable Switching value (%)
Model 1 Model 1 Model 2 Model 3
Simulation 1 Simulation 2 Simulation 2 Simulation 2
Broiler price 1.04 1.82 1.29 11.08
unfeasible to run. For the same model having a capacity of 25,000 birds, the maximum decrease in broiler price is 1.82%, meaning that if the company sells the broilers for less than 12.275 IDR, it become no longer feasible.
From these analyses it can be concluded that both the 10,000 bird and 25,000 bird capacities are very sensi-tive to the decreases in broiler price. Nevertheless, in a single year, the broiler business can have six production
cycles, so due to the fl uctuations in broiler price, the loss in one period can be covered by other profi table periods.
For model 2, the maximum decreases in broiler price where the 25,000 bird capacity business is still
feasible is 1.29%. This means that the lowest fi nancially
feasible broiler price is 12,350 IDR per kg.
Table 3 shows that for model 3, the maximum limit for broiler price decrease is where the business is still
fi nancially feasible is 11.08%. This means that if the
com-pany sells the broilers for less than 11,150 IDR per kg, the integrated broiler production is no longer feasible. The results show that the integrated model is relatively
resilient towards price fl uctuations compared to the
non-integrated models.
Increases in DOC price. The switching value analysis for the 10,000 bird capacity broiler production shows that the maximum increase in DOC price that generates a zero NPV is 5.91%. This means that if the DOC price
exceeds 3,800 IDR, model 1 is no longer fi nancially
fea-sible. For model 2, a 7.31% increase in DOC price gener-ates a zero NPV. The highest feasible DOC price is 3,875 IDR per bird.
In model 3 simulation 2, an increase up to 62.73% can still be tolerated. As the normal price is 3,600 IDR per chick, if the price increases to 5,850 IDR, the busi-ness is no longer feasible. This shows that the integrated
broiler production is relatively resilient to signifi cant fl uctuations in the DOC price.
Farm Income Analysis
The comparison of farm income analysis between integrated and non-integrated broiler production is pre-sented in Table 4 and 5. The revenue in model 1 comes from the broiler and waste. In model 2 with 25,000 head capacity, the feed also contributes on the revenue. In model 3 with 10,000 head capacity, the main product is broiler however the corn also contributes on the rev-enue. In this case, there is no feed sold to the market. In this model, if the capacity is 25,000, both corn and feed contribute on the revenue. The last model will give the highest revenue of 3,179,550,000 IDR.
In model 1, the largest variable cost is contributed by the feed. It spends 70 percent of total operational cost.
Note: Model 3= integrated broiler production. Simulation of 1 and 2 are of the 10,000 and 25,000 bird capacity.
Table 4. Farm income analysis of non-integrated broiler production, Caringin Village, Sub District Dramaga, Bogor, 2008-2009 (IDR)
Item
Model
Model 3 simulation 1
Model 3 simulation 2 Revenue
Broiler 1,224,000,000 3,060,000,000
Corn 22,500,000 24,000,000
Feed 95,550,000
Total revenue 1,246,500,000 3,179,550,000 Cost
Fixed cost 217,542,562 327,340,371
Variable cost 833,209,500 1,869,134,000 Total cost 1,050,752,062 2,196,474,371
Income 195,747,938 983,075,629
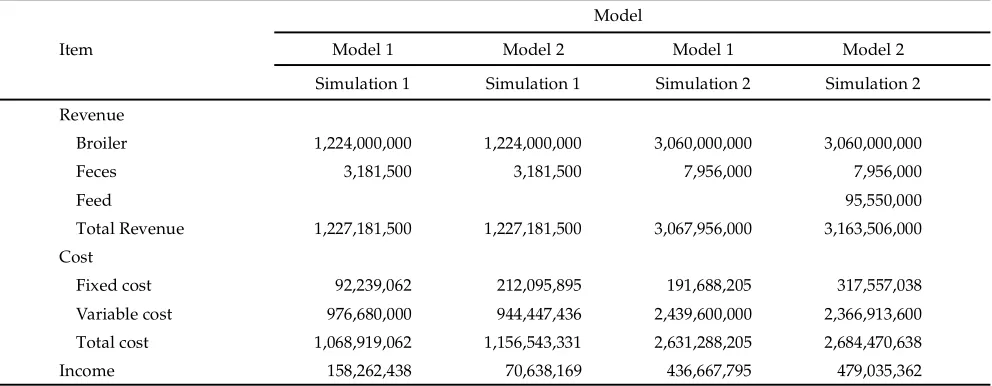
Note: Model 1= the non integrated broiler production, Model 2= the integrated broiler-feed production. Simulation of 1 and 2 are of the 10,000 and 25,000 bird capacity.
Table 4. Farm income analysis of non-integrated broiler production, Caringin Village, Sub District Dramaga, Bogor, 2008-2009 (IDR)
Item
Model
Model 1 Model 2 Model 1 Model 2
Simulation 1 Simulation 1 Simulation 2 Simulation 2
Revenue
Broiler 1,224,000,000 1,224,000,000 3,060,000,000 3,060,000,000
Feces 3,181,500 3,181,500 7,956,000 7,956,000
Feed 95,550,000
Total Revenue 1,227,181,500 1,227,181,500 3,067,956,000 3,163,506,000
Cost
Fixed cost 92,239,062 212,095,895 191,688,205 317,557,038
Variable cost 976,680,000 944,447,436 2,439,600,000 2,366,913,600
Total cost 1,068,919,062 1,156,543,331 2,631,288,205 2,684,470,638
In model 2 and 3, the raw materials in feed manufacture spend the largest cost. In model 2, about 70 percent of total variable cost. From all model discussed, model 3 (integrated broiler production) gives the highest income of 983,075,629 IDR.
The Obstacles in Applying the Integrated Broiler Production
The fi nancial feasibility analysis shows that the
integrated broiler model is the best model to employ and it is relatively insensitive to changes in broiler and DOC prices. The reasons why this model is not yet applied by the small scale farmers are:
1. It requires more complex management
The management of an integrated broiler farm is more complex than managing a single production because it involves many business activities which depend on each other. It requires human resources who have comprehensive managerial and technical abilities in running an integrated farm. The aspects to be considered are not only the husbandry, but also the corn cultivation and feed plant operation.
2. It requires a large investment
A business involving various integrated activities unquestionably needs a larger investment than a single business activity. The integrated broiler production with a 25,000 head capacity needs more than 2,5 billion IDR investment. This is why only medium to large scale businesses can operate the integrated farm model.
3. It requires a larger acreage
The implementation of the integrated farm model needs a larger acreage, especially for the corn cultivation. For the 25,000 head capacity, ten hectares are needed.
The obstacles above can be overcome by making clusters of broiler farms. Several broiler farms can form a partnership to manage the corn cultivation and feed plant. This of course needs the government’s assistance, so that the Indonesia’s livestock and poultry husbandry can become more competitive in the future.
CONCLUSION
For the integrated farm model, the 25,000 bird ca-pacity is more feasible than the 10,000 bird caca-pacity. The 25,000 bird integrated broiler business is more resilient to decreases in broiler price and increases in DOC price compared to the other models.
REFERENCES
Alabi, R.A. & M. B. Aruna. 2005. Technical effi ciency of
fam-ily poultry production in Niger-Delta, Nigeria. J. Cen. Eur. Agric. 6: 531-538.
Badan Pusat Satistik. 2009. Statistik Ekspor Impor. Jakarta.
Bahrends, B. R. 1990. Nutrition economics for layers. Poult. Int. 29: 16-20.
Bojnec, S.& L. Latruff e. 2008. Measures of farm business
ef-fi ciency. Journal of Industrial Management and Data
System 108: 258-270.
Chang, H.S. 2007. Analysis of Philippines chicken industry: commercial vs. backyard sectors. Asian Journal of Agriculture and Development 4: 41-56.
Cyrilla, L., Z. Moesa, & S. M. P. Putri. 2010. Efi siensi produksi
usaha peternakan domba di Desa Cibunian Kecamatan Pamijahan Kabupaten Bogor. Med. Pet. 33: 55-60.
Direktorat Jenderal Peternakan. 2007. Buku Statistik Peternakan. Departemen Pertanian, Jakarta.
Eales, J. S. & L. J. Unnevehr. 1993. Simultaneity and struc-tural change in U. S. meat demand. American Journal of Agricultural Economics 75: 259-268.
Gi inger, J. P. 1986. Analisa Ekonomi Proyek-Proyek Pertanian. UI Press, Jakarta.
Hayes, D.J. 1996. The Feasibility of Broiler Production in Iowa.
CARD Briefi ng Paper 96-BP 13. Iowa State University.
Ilham, N., S. Hastuti, & I. K. Karyasa. 2002. Pendugaan parameter dan elastisitas penawaran dan permintaan beberapa jenis daging di Indonesia. JAE 20: 1-23.
Kadariah, L.K. & G. Clive. 1999. Pengantar Evaluasi Proyek. Lembaga Penerbit Universitas Indonesia, Jakarta.
Mack, S., D. Hofman, & J. O e. 2005. The contribution of poultry to rural development. World’s Poultry Science Journal 61:7-14.
National Research Council. 1994. Nutrient Requirements of Poultry. 9th Rev. Ed. National Academy Press,
Washington, DC.
North, M. O. & D. D. Bell. 1990. Commercial Chicken Production Manual. 4th Ed. An Avi Book. Van Nostrand
Reinhold, New York.
Nuraini. 2009. Performa broiler dengan ransum mengandung campuran ampas sagu dan tahu yang difermentasi den-gan Neurospora crassa. Med. Pet. 32: 196-203.
Pudjosumarto, M. 1991. Evaluasi Proyek. Liberty, Yogyakarta.
Saragih, B. 2000. Agribisnis Berbasis Peternakan: Kumpulan Pemikiran. Edisi Milenium. Pustaka Wirausaha Muda, Bogor.
Sonaiya, E. B. 1995. Feed resources for smallholder poultry production in Nigeria. World Animal Review 82: 25-33.
Udoh, E.J. & N. A. Etim. 2009. Measurement of farm level
ef-fi ciency of broiler production in Uyo, Akwa Ibom State,