Different Perspectives Between Product and Marketing
Division towards Product Critical Success Factors and Its
Strategic Importance in Telecommunication Sectors
Rachmi Rida Utami* and Reza Ashari Nasution
**Todays situations force telecomunication company to continuously evaluate, select and prioritize its product portfolio in order to determine the strategically important products. An analysis of critical success factors that determine product’s strategic importance acts as a good introduction to review and manage the product portfolio as well as to seek ways to develop the product. To achieve this, the company is required to have good alliances and collaborations between departments, develop a clear focus and seek innovative ways of doing business, particularly between marketing and product divi-sions. This study analyzed the alignment between product and marketing divisions of a telecommuni-cation company in Indonesia, in determining the company’s strategic products. The results indicated
that both divisions agreed on using financial performance and revenue as the most important criteria
and sub-criteria for identifying strategic product. However, the divisions also faced some different
vi-sions in selecting alternative criteria. The Product divivi-sions were more focused on technical spesifica -tion of product, while the Marketing division were more oriented on customer and market condi-tions. The study reported the consequences of these difference in practice.
Keywords: Product strategic importance, Critical success factors, Telecommunication, Inter depart-ment collaborations, Product portfolio managedepart-ment
Situasi dewasa ini memaksa perusahaan telekomunikasi untuk terus mengevaluasi , memilih dan memprioritaskan portofolio produkya dalam menentukan produk yang penting secara strategis. Analisis faktor penentu keberhasilan yang menentukan kepentingan strategis produk merupakan awal yang baik untuk meninjau dan mengelola portofolio produk serta mencari cara untuk mengembang-kan produk. Untuk mencapai hal ini, perusahaan dituntut untuk memiliki aliansi dan kolaborasi yang baik antar departemen dalam perusahaan, mengembangkan fokus yang jelas dan mencari cara-cara inovatif dalam menjalankan bisnis , terutama antara divisi pemasaran dan divisi produk . Penelitian ini menganalisis keselarasan antara divisi produk dan pemasaran dari sebuah perusahaan telekomu-nikasi di Indonesia dalam menentukan produk strategis perusahaan. Hasil penelitian menunjukkan bahwa kedua divisi setuju untuk menggunakan kinerja keuangan dan pendapatan sebagai kriteria dan
sub kriteria yang paling penting untuk mengidentifikasi produk strategis . Namun, kedua divisi ini
juga menghadapi beberapa visi yang berbeda dalam memilih kriteria alternatif . Divisi Produk lebih
terfokus pada spesifikasi teknis produk , sementara divisi Pemasaran lebih berorientasi pada kondisi
pelanggan dan pasar . Penelitian ini melaporkan konsekuensi perbedaan fokus kedua divisi ini pada praktek bisnis perusahaan.
Kata Kunci: kepentingan strategis produk. faktor penentu keberhasilan, telekomunikasi, kolaborasi antar departemen, manajemen portfolio produk
Introduction
The competition in the telecommunica-tion industry has been intense. The compet-ing players entered the market place from all
Master of Business Administration Program-School of Business and Management, Institut Teknologi Bandung;
Jl. Gelap Nyawang No.1 Bandung - 40132, West Java
sides (Dolbeck, 2006). The telecommunication
companies had to compete with each other to satisfy the customer needs and wants. Pursuing this, the company’s products need to be seen as more than physical entities. Since the products that the company had in their portfolios made
different contributions to profits, company had
to continually evaluate, select and prioritize its product, from time to time to win customer
preference (Cauchik Miguel, 2008).
An analysis of the critical success factors related to the product strategic importance need to be undertaken by the company in order to review and manage the product portfolio as well as to seek ways to develop the products. In order to achieve it, the company is required to have good alliances and collaborations among departments to develop a clear focus, share in-formation as well as to seek innovative ways of doing business (Gunasekaran, Tirtiroglu and
Wolstencroft, 2002).
A number of research that examined how functional departments interact with one anoth-er and how the conditions of diffanoth-erent panoth-erspec-
perspec-tives and focus could influence the company
business strategy have been discussed by many
academics (Ruekert and Wlaker Jr, 1987; Gu
-nasekaran, Tirtiroglu and Wolstencroft, 2002; Chen and Lu, 2006). Many of them have at -tempted at identifying gap between functional departments while others also offered solutions to reduce it. Despite these studies, the theories described about the critical success factors have been widely discussed and received extensive discussions in many product developments or new product development. Both topics were thought to be essential for competitiveness in many industries as well as useful in making an optimal marketing strategy. However, there was rarely any particular study that could coorelate the conditions of different perspective with the critical success factors behind product strategic importance.
Basically, the earlier research studying in-teractions between departments were more fo-cused on relationships between marketing and R&D departments. Unfortunately, there were
rarely any specific study that could describe
the interactions between marketing and prod-uct divisions, especially in telecommunication sectors. Thus, the particular study must be
ad-dressed to develop insights and illustrate the differences between these two divisions. This
study aims to contribute towards filling this
gap, by studying the relevant literatures and in-terviewing practitioners in telecommunication sectors in Indonesia. The result should be
bene-ficial for marketing strategy formulation in tele -communication company while also improving both departments and products contribution to-wards the company’s strategic goals.
Literature Review
Product Portfolio Management
The products owned by a company are es-sentially important for the long-term survival of the company. In the presence of the products, the company is expected to achieve its objec-tives, one of which was revenue coming from selling the products. As the development of time, the market conditions becomes demand-ing and pushdemand-ing companies to be more serious in developing and managing their products in order to maintain their positions with variety
of customers needs (McClure, 2003). Thereby,
the company’s choice to develop product port-folio management becomes a central factor that
could influence the company’s opportunity in
success.
Product portfolio management is a signifi
-cant determinant of company profitability and
has been widely recognized as a key compo-nent of company strategy (Balasubramaniam,
2007). It was a process in which the develop -ment of products were continually evaluated, selected and prioritized; new products might be introduced and existing products might be suspended, canceled, or de-prioritized
(Bala-subramaniam, 2007; Cauchik Miguel, 2008; Cooper Edgett and Kleinschmidt, 1997). Some
researchers also notioned that product portfolio management was about allocating resources, deciding which products should received top priority and be accelerated to the market
(Coo-per, Edgett and Kleinschmidt, 1997).
such as providing data and information related to the products, which is then further catego-rized and analyzed through a scoring system based on certain criteria (for example:
strate-gic impact, sales data, technology difficulty, forecast data, etc.). Product portfolio manage -ment helps the company to choose the proper products and ensures them to get the proper treatment, despite shared resources (Cauchik
Miguel, 2008; Gould, 2009).
A research by Killen, Hunt and Kleinschmidt
(2008) indicated that product portfolio manage -ment was a key factor for product success. The research reported that the products introduced within the last three years had generated about
a quarter of total revenue and profit, and about 59% of new product launched were successful.
These results indicates that product portfolio management correlated with product success
rates. These results also being confirmed in oth
-er research, which showed that 50% of a com -pany’s sales were coming from the launched
products within the first five years (Cauchik Miguel, 2008; Killen, Hunt and Kleinschmidt, 2008).
The examples showed that, if the product portfolio management is well managed by the
companies, it could give many benefits to them.
Otherwise, if the product portfolio manage-ment was poorly managed, it could cause cer-tain problems. For instance, the availability or resources become limited, whereas many prod-ucts needed to be developed; the prodprod-ucts be-ing developed did not align with the business strategy, causing many products being cut from the business’s priorities; wrong products were often not discontinued, etc. Circumstances such as these needs to be avoided by the company.
However, there are challenges in develop-ing and managdevelop-ing the company’s product port-folio. For instance, it was challenging in cre-ating the optimal product portfolio, while also creating the business synergies. It usually also takes time to evaluate the entire product of a company. Selecting which product that could be deleted or selected has never been an easy task. There is no easy solution to manage prod-uct portfolio of a company. It requires careful and thorough plan to make an effective
prod-uct portfolio (McSparran, 1995). An effective
product portfolio should consists of valuable
products, which have enough distinction to
sus-tain and grow values over time (Rao, 2009).
The actions already been taken by some global telecommunications companies, for ex-ample Vodafone. The company recently execut-ed a program to divest the minority assets in order to focus in better assets that deployed its capabilities. The telecommunication companies used these assessment to evaluate their prod-uct portfolio in order to identify what prodprod-ucts needed to be deleted and highlight products that
needed specific improvement strategies (Mc
-Sparran, 1995; Sabbagh, et al., 2012).
Conclusively, the main goal of product port-folio management are generally to maximize
the financial value of the product portfolio,
to ensure balance among projects, to limit the
number of product so could fit with the orga -nizational capacity and to ensure that the
port-folio reflected the business’s strategy. Attempt
at improving the product portfolio management also have yielded positive effect on improv-ing product quality (Cooper, Edget and
Klein-schmidt, 1997).
Product Portfolio Management from the Perspective of Product Development
The efforts in identifying critical success factors of products have been widely discussed by many researchers and could easily be found in the realm of product development or new product development. The link between port-folio management and product development or new product development started when the in-novative ideas went into development. It could
become a beneficial product or perhaps it might
need to wait for available resources in order to be developed. These innovative ideas requires technical development before becoming a prod-ucts. After these ideas became products, they would be developed and managed simultane-ously. Hence, they needed to be balanced and prioritized by comparing and ranking them to one another based on certain criteria. Eventu-ally, resources were allocated to the selected
products (Cauchik Miguel, 2008).
These continuous relationships connect product portfolio management and product development. Thereby, product development
ideas which would be applied to the products through preliminary investigations, such as
market potential, technical specifications or
other certain criteria. Throughout this study, the formation of critical success factors would be created by borrowing the product develop-ment’s approach.
The General Critical Success Factors of Products
The research study performed by Chris
Sto-rey, which focused on more than 100 new prod
-ucts in variety of industries, confirmed that 50%
of them achieved positive results while others
faced downfalls (Cooper and Edgett, 1996).
Additionally, many observers also reported that
the new product downturn rate was between 70-80 percents (Suwannaporn and Speece, 2010).
Academics who study the product
develop-ment have identified several key eledevelop-ments for
product success. They represented the better process for identifying good product concepts and guided them through the product success
(Pitta, 2008). A study conducted in 100 new products and at 174 “top performers” products showed 65 and 14 different key performance
drivers. These study then combined with other
findings from the study focused on the factors
that distinguished the winning and losing
prod-ucts. The result showed that there were 10 cru -cial success factors that determine a product’s
success (Edgett, 1996), some of them were:
1. Focus on availability of resources 2. Focus on the excellence quality of
execution within new product process
3. Integrating the consumer’s words 4. A high-quality launch effort
5. Synergies
6. Distinctive and exceptional products 7. Possess product-market match
Cooper (1999) reported a set of factors that
called seven actionable critical factors that ap-plied on product innovation, some of them were:
1. Influence of the customers: devotion to the
market and customer’s inputs towards the product
2. Product advantage: distinctive and
exceptional value for customers
3. A well-planned, adequately-resourced and proficiently-executed launch
A research study by Linton (2004) who stud
-ied 161 business units, also discovered the im -portant factors of new product developments. Ten key performances were:
1. Rate of success
2. Sales percentage of new products 3. Profitability compared with spending
4. Technical success rating (the technological point of view)
5. Sales product impact
6. Profit product impact
7. Achieve the product sales goal 8. Achieve the profit goals
9. Profitability compared to competitors 10. The general success
Based on the many critical factors above,
further, it could be classified into three major
factors that indicated the product success as
shown in table 1.
Though it was already classified into the
three major factors that indicated the product
success, these findings were not specifically ap -plicable to telecommunication sectors. These
findings were measured only from industries in
general. Further, the study would analyze more about the critical success factors in telecommu-nication sectors.
The Critical Success Factors of Products in Telecommunication Sectors
Process development and time-to-market aspects are important measurement of success
for telecomunication sectors (Munoz, 2008; Kosaroglu and Hunt, 2009). Time to deploy the
product within strict time was crucial factor in a telecommunication business. Because of the increasing competitive market, ideas spread rapidly and the imitation or adaptation of tele-communication products have become univer-sally adopted strategy. Moreover, achieving rapid time to market could enable the company to achieve an advantage in market share. Time
initiate the concept of a product to complete the product launch phase (Ogawa and Ketner,
1997). The company that reduced the cycle
development time in its process much likely would perform well in the market, as it could deliver the product earlier than the competitors
(Munoz, 2008; Shiu and Cheng, 2008; Ogawa and Ketner, 1997).
First pace to market is highly correlated with factors like internal and external
coordi-nation. The internal coordination is defined as
preliminary setting objectives. The coordina-tion between different funccoordina-tional department is required in order to meet those objectives (Shiu
and Cheng, 2008). The external coordination was defined as engaging information power
from supplier, advertising agencies, outsourc-ing companies, etc.
Technology is considered as one of the most
influential factor in telecommunication product
development. The integration between devel-opment process and technology is dominant to provide an excellent product to customers
(Kosaroglu and Hunt, 2009). In order to get
the optimal design of the product, the company needs to apply the right technology into it. The
telecommunication product must also fit into
customer requirements as well as offering the
excellent benefits compared to the other exist -ing telecommunication products. It took big concerns in telecommunication sectors, as tele-communication companies also faced the rapid technological development and fast changes in
customer requirements (Munoz, 2008).
Innovation is still regarded as the key suc-cess factor in telecommunication sectors. In-novation has been proven to be important for long-term success of mobile companies that
operate in a highly competitive and uncertain environment. The innovation could be some-thing related to tariffs, promotions, discounts, networks, etc.
Telecommunication products often vary in quality that depends on the standardization of each product. Hence, product augmentation is also crucial for telecommunication sector, since the same basic product attributes could be of-fered to separate customer segments in different ways and at different prices.
All telecommunication products demand very close relations between suppliers and cus-tomers. The interaction could also become dif-ferentiation in product offerings. In addition, telecommunication companies also need to de-velop the appropriate processes and procedures
to interact with their customers (Munoz, 2008).
The telecommunication product’s success could be measured through its sales perfor-mance that shows the unit sales or registered subscribers of a certain product. It includes elements such as market share of the product,
rate of user, profitability as well as churn rate (Munoz, 2008). All these elements are then cat -egorized into few major categories representing
each factors as show in table 2.
Different Perspective Between Marketing and Product Division
Interfunctional relationships are impor-tant during developing and managing product. Product management and development require the company to provide or exchange resources such as information, skills and budget, which could be established by building good relation-ships among existing divisions. Some studies
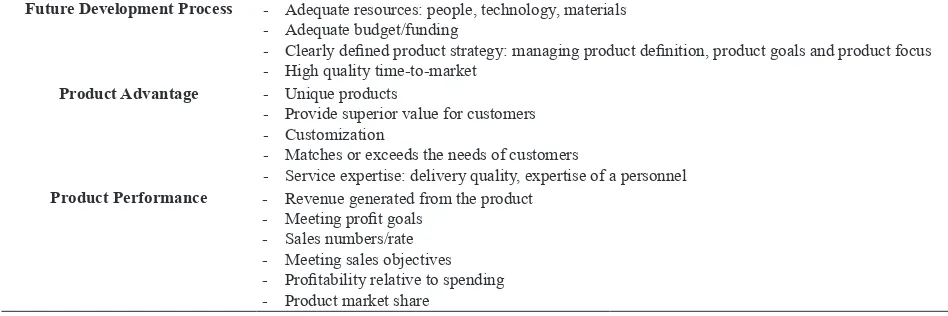
Table 1. General Classification of the Three Major Factors that Indicate the Product Success
Future Development Process - Adequate resources: people, technology, materials - Adequate budget/funding
- Clearly defined product strategy: managing product definition, product goals and product focus - High quality time-to-market
Product Advantage - Unique products
- Provide superior value for customers - Customization
- Matches or exceeds the needs of customers
- Service expertise: delivery quality, expertise of a personnel
Product Performance - Revenue generated from the product - Meeting profit goals
described that inter functional relationships during product management and development often became a challenge for the company, without exception was the relationships be-tween marketing and product division. In some companies, the relationships between these two divisions were usually characterized by per-spective differentiations (Massey and Kyriazis,
2007).
Gunasekaran (2002) studied the gap be -tween marketing and production division relat-ed to the method usrelat-ed by the two divisions. The perspective differentiations between both divi-sions usually occured in not only design and
delivery flexibilty but also design and delivery reliability (Gunasekaran, Tirtiroglu and Wol
-stencroft, 2002). A study conducted by Friend and Thompson (2003) described that syncron -izing the two divisions was never an easy task. It was evidenced by marketing strategy and production plans that were optimized separate-ly. Marketing division were usually focused on customer needs by identifying and delivering
the customer preferences. While product divi -sion were usually focused on technical
feasibil-ity and effectiveness (Ruekert and Wlaker Jr, 1987).
The study conducted by Ruekert and Wlak
-er Jr (1987) described that the issues between
product and marketing divisions often absorbed large amounts of company’s resources and sometimes lead to individual department
deci-sions, which disregard the company’s objec-tives. The issues between division were also as-sociated with the higher rate of product failure, because of their different perspective related to the product. For example, the level of product performance developed by product division usually contradicted with the desire of
market-ing division (Ruekert and Wlaker Jr, 1987).
However, these issues needed to be resolved eventually.
Several propositions concerning these problems have been made to reduce the is-sues. Some authors have explained the need of communication and cooperation between pro-duction and marketing divisions for the com-pany. They believed that communication and
cooperation could directly influence the inter
functional relationships effectiveness. It is also evidenced that by developing a good interfunc-tional relationships, the success rate of product
became higher and increased profits (Massey and Kyriazis, 2007; Leitch, 1974). Eventually,
the production must synergize their focus and activities with marketing division and vice
ver-sa (Friend and Thompson, 2003).
Research Methodology
The study focused on one of the Indonesia’s biggest telecommunication company with a complete range of products. This study applied
grounded theory (GT) approach in identify
-Table 2. The Telecommunication Sector’s Major Factors that Indicated Product Success
Categories Factors Descriptions Future
Development Process
• Internal coordination
• External coordination
• Technology
• Innovation
• Time to market
• Preliminary setting objectives
• Excellence integration between external parties (supplier, advertising agencies, outsourcing,
etc.)
• Right technology selection, easy and applicable technology, integrated well with the process
• Innovation in tariffs, promotions, discounts, networks, etc.
• The time used to initiate the concept of a product to complete the product launch phase; Reduce the cycle development time in its process
Competitive Performance
• Superior product experience to customers
• Superior to competitors
• Product augmentation
• Positive image to the companies
• Related to the level of satisfaction that customer experiments when use it
• Reflected the product advantage against the competitors
• Products offered in different ways and at different price to certain customer segments
• Related to the positive image, top of mind that the customer and the market have from the company
• Reflected the percentage of customers that the company owns in a national market where it
operates
• The average rate per user
• Reflected the differences between revenues and the amount spend on them
• Reflected the number of subscriber that are disconnected from the products during a month of
period
After-Launch Effort
• Marketing activities
• Customer relationships
• Carefully arranged and very detailed marketing activities
ing the critical success factors of products in telecommunication sector, for it allows more general explanation of a phenomenon based on data generated from data collection process. The data were obtained through studying rele-vant literatures and expert interviews as well as
AHP (Analytical Hierarchy Process) model to
select the critical success factors that determine the product strategic importance in telecommu-nication sectors. The experts who participated in both individual interview and AHP decision process were selected from two divisions of the company, namely product division and market-ing division. A total of three experts from each
division with minimum five years of experience
in telecommunication sectors, were included in this study. Prior to the interview, both groups of experts were provided with general descrip-tions of the study, including the research objec-tive as well as the process, methods or tools of data collection.
Grounded Theory (GT) Method
Grounded Theory (GT) was a method devel
-oped by Glaser and Strauss (1967), that used a
systematic set of procedures in order to induc-tively develop a theory about a phenomenon
(Halaweh, 2012). GT method was considered
as a general method to develop a theory which
was grounded in data that was systemically
gathered and analyzed (Mansourian, 2006). It
was regarded as a package of research meth-ods, which included several key points as data collection, theoretical sensitivity, theoretical sampling, constant comparative, coding, iden-tifying core category and theory writing (Zarif,
2012; Mansourian, 2006; Mills, Bonner and Francis, 2006; Halaweh, 2012)
GT process in this study began by identify-ing the problem which was to determine prod-uct strategic importance in telecommunication
sectors through finding the critical success fac -tors of products. The data were collected from literature reviews and expert interviews from
the telecommunication sectors. A total of 25
interview questions were conducted with ex-perts from both divisions. Further, the expert’s answers were analyzed through coding the data, that could represent an action, object, process or concept. These codes were then compared with the codes established from the paper lit-eratures and this process were continuously
re-fined by adding or eliminating codes from both data sources. Further, the identified codes were classified by grouping the codes with same
meaning into one category. The name of cat-egory should represent the codes inside it. The formed categories from GT were then used to select the core categories using AHP model,
that ranked the categories through its important
level. Eventually, the final level was to concept
and develop the theory. Theory emerged by in-tegrating the relevant concepts of data (Byrne,
2001).
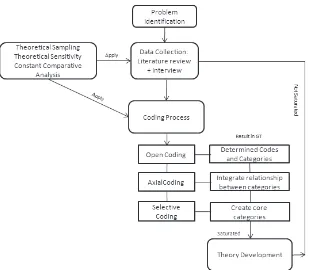
The data collection and data analysis were simultaneously processed throughout the study. At the same time, theoretical sensitivity, theo-retical sampling and constant comparison anal-ysis were conducted to group similar together. The process of gathering and comparing the data continued until they became saturated, which means that no further ideas were men-tioned. The process of GT method used in this
study is shown in figure 1.
The AHP Model
AHP was proposed by Thomas L. Saaty and was one of the most commonly applied mul-ticriteria decision making methods (Rezaei
and Karami, 2008). The AHP model was used
based on the existing categories. The use of AHP model required determining the relative importance of each elements in the hierarchy. It also required the expert’s point of view to de-termine how they perceived the importance of these critical factors of a product. AHP model
decomposed a complex decision operation into a multi-level hierarchical structure. AHP usu-ally consists of three major steps: decomposi-tion, comparative judgment and synthesis of
priorities (Mogadham and Karami, 2008; Saaty, 1990), which also used throughout this study. • The Hierarchy Structure
The AHP begins by defining the problem and
constructing it into a hierarchical network. The top layer represents the overall goal,
which defines the problem to be solved; the middle represented the criteria (factors) and sub-criteria (sub-factors), while the bottom
represent the alternatives.
• The Pairwise Comparison
This step is used to create priorities among elements within each level of the hierarchy. The priorities among elements were evalu-ated by asking the expert participants to compare pairwise each set of the elements with respect to each of the elements in a higher level. There were two stages of do-ing the pairwise comparison in this study:
(1) Comparison among criteria with respect to the overall objective and (2) Comparison
among sub-criteria with respect to the crite-ria. Their judgment of the importance factors over another could be made subjectively and
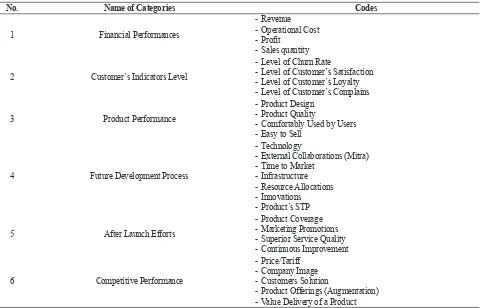
Table 3. List of Categories
No. Name of Categories Codes
1 Financial Performances
- Revenue - Operational Cost - Profit
- Sales quantity
2 Customer’s Indicators Level
- Level of Churn Rate
- Level of Customer’s Satisfaction - Level of Customer’s Loyalty - Level of Customer’s Complains
3 Product Performance
- Product Design - Product Quality
- Comfortably Used by Users - Easy to Sell
4 Future Development Process
- Technology
- External Collaborations (Mitra) - Time to Market
- Infrastructure - Resource Allocations - Innovations - Product’s STP
5 After Launch Efforts
- Product Coverage - Marketing Promotions - Superior Service Quality - Continuous Improvement
6 Competitive Performance
- Price/Tariff - Company Image - Customers Solution
later converted to a numerical value using a
scale 1-9 (Mogadham and Karami, 2008).
Further, the data from participants were be-ing input to Expert Choice. The software directly calculated the relative weights for each elements in every level with respect to the higher level.
• Synthesis of Priorities
This step included establishing priorities and consistency data of respondents. Calculated priorities was used to compare the relative importance of the elements in each level to an element in the higher level. In AHP, the
consistency ratio should be less than 0.1 (Saaty, 1990).
The AHP results presented in the next sec-tion showed the priorities of both criteria and sub-criteria from product and marketing divi-sions. Further, these priorities were compared against one division to another, so as to indicate what points that differentiate them. Eventually, the differentiations were translated into insights represented both divisions characteristics.
Results and discussions
GT’s Results-List of Categories
Based on insights obtained from both the literature review and the interview data, the results of categories of critical success factors were developed. The categories resulted from
this process were depicted in Table 3.
AHP Results
The categories formed from GT were then used to select the core categories using AHP model, which ranked the categories based on its importance level.
1. The Hierarchy Structure
The structure of AHP was constructed based
on findings from GT method as shown in Ta
-ble 3 above. The structure consists of three
layers or level represented: the overall goal
in the top layer, the criteria (categories) in
the second layer and the sub-criteria
(sub-categories) in the third layer.
2. Pairwise Comparison
2.1. Comparison Among Criteria with
Respect to the Overall Objective
At the first stage of comparison, the
experts were asked to indicate the rela-tive importance of the six criteria with respect to the overall goal. The result of the normalized weights and the rank for these six criteria towards the overall goal in each two divisions is displayed
in Table 4. The details of pairwise com -parison of criteria by the two divisions were also presented.
Product Division. As displayed in Table
4, the financial performance had the
Figure 2. The AHP Structure
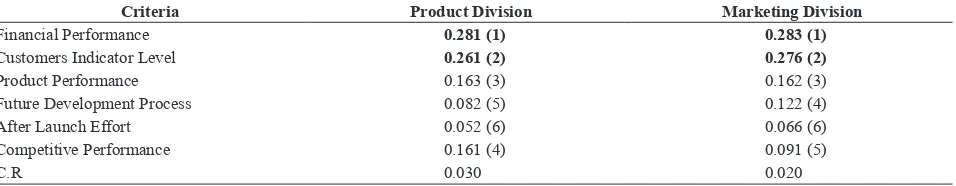
Table 4. Synthesized Priorities and Ranks For Criteria
Criteria Product Division Marketing Division
Financial Performance 0.281 (1) 0.283 (1)
Customers Indicator Level 0.261 (2) 0.276 (2)
Product Performance 0.163 (3) 0.162 (3)
Future Development Process 0.082 (5) 0.122 (4)
After Launch Effort 0.052 (6) 0.066 (6)
Competitive Performance 0.161 (4) 0.091 (5)
highest relative weight of 0,281 and fol -lowed by the customer’s indicator level
with 0,261. The third and fourth rank
were product performance and competi-tive performance, with relacompeti-tive weights
0,163 and 0,161 respectively. The crite -ria future development process and after launch effort were positioned in the last two ranks of the criteria, with the
rela-tive weights 0,082 and 0,052 respecrela-tive
-ly. These results indicated that finan -cial performance was perceived as the most important criterion in selecting the critical success factors of a product for telecommunication sectors by product division. The table also showed the in-consistency ratio for the pairwise
com-parison for the product division is 0,03,
which was still in the tolerable level of
0, 1.
Marketing Division. The division
in-dicated that financial performance and
customer’s indicator level as the top
two criteria, with relative weights 0,283 and 0,276 respectively. The ranks was
followed by product performance and future development process with
rela-tive weights of 0,162 and 0,122 respec -tively. The last two ranks of criteria were competitive performance and after launch effort with the relative weights
of 0,091 and 0,066 respectively. These results also indicated that the financial
performance was perceived as the most important criterion in selecting the criti-cal success factors of a product for tele-communication sectors by the division. Then, it was also followed by the cus-tomer’s indicator level criterion. The
in-consistency ratio for the division (0,02) was still under the tolerable level of 0,1.
The results from both divisions
indicat-ed that they already agreindicat-ed in financial
performance as the most important crite-rion in selecting the critical success fac-tors of a product for telecommunication
sectors. They perceived financial per
-formance necessary, as it reflected the
performance of all criteria which could
eventually affecting its financial results.
The divisions also agreed that
custom-er’s indicator level and product perfor-mance were the criteria following the
financial performance. Both divisions
seemed to believe that if the customers
were already satisfied and had few com -plaints about the products, it means that the product were having a good perfor-mance, in either the design or quality, so that the customers convenient in using it.
Nonetheless, the divisions also faced
different opinions toward future devel-opment process and after launch effort criteria. Product divisions indicated that future development process was less im-portant than competitive performance, as it was crucial enough to also
recog-nize the product’s superiority when find -ing it, that for future product’s manage-ment would not diverge from what was already planned beforehand. On the contrary, for marketing division the pro-cess of placing and timing the product to the market were more crucial. They perceived that the competitive
perfor-mance could be flexibly formed after
the market or customers experienced the product in advance.
2.2. Comparison Among Sub-Criteria with Respect to the Criteria
After pairwise comparison for all crite-ria, the second step of comparison was making comparison among sub-criteria with respect to the criteria. The experts were again asked to indicate the rela-tive importance of the sub-criteria with respect to the criteria. Table 5 displayed the result of the normalized weights and the rank for these comparison in each two divisions.
a. Financial Performance
Product Division. The revenue and
profit became two top priority indica
-tors in selecting financial performance with the relative weights 0,407 and 0,247 respectively. While the sales
Table 5. Synthesized Priorities and Ranks for Sub-Criteria
Sub-Criteria Product Division Marketing Division Financial Performance
Revenue 0,407 (1) 0,581 (1)
Operational Cost 0,163 (4) 0,080 (4)
Profit 0,247 (2) 0,239 (2)
Sales Quantity 0,183 (3) 0,100 (3)
Customer’s Indicator Level
Level of Churn Rate 0,373 (1) 0,146 (3)
Level of Customer Loyalty 0,235 (3) 0,447 (1)
Level of Customer Satisfaction 0,244 (2) 0,302 (2)
Level of Customer Complain 0,148 (4) 0,105 (4)
Product Performance
Product Design 0,170 (4) 0,118 (4)
Product Quality 0,398 (1) 0,176 (3)
Comfortably Used by Users 0,217 (2) 0,412 (1)
Easy to Sell 0,215 (3) 0,294 (2)
Future Development Process
Technology 0,09 (4) 0,138 (4)
External Collaboration (Partner) 0,04 (7) 0,070 (7)
Time to Market 0,278 (2) 0,260 (1)
Infrastructure 0,072 (6) 0,120 (5)
Resource Allocation 0,074 (5) 0,112 (6)
Innovation 0,335 (1) 0,142 (3)
Product's STP 0,112 (3) 0,159 (2)
After Launch Effort
Product Coverage 0,093 (4) 0,214 (3)
Marketing Promotions/Efforts 0,108 (3) 0,225 (2)
Superior Service Quality 0,530 (1) 0,208 (4)
Continuous Improvement 0,269 (2) 0,353 (1)
Competitive Performance
Price/Tariff 0,117 (4) 0,180 (3)
Company Image 0,092 (5) 0,124 (5)
Customer Solution 0,278 (2) 0,368 (1)
Product Offerings (Augmentation) 0,148 (3) 0,107 (4)
Value Delivery of a Product 0,366 (1) 0,221 (2)
with 0,183 and 0,163 respectively.
Marketing Division. The revenue be-came the most important
sub-criteri-on in selecting financial performance with the relative weight 0,581. Fol
-lowed by the profit, sales quantity
and operational cost with the relative
weights 0,239; 0,100 and 0,080 re -spectively.
Overall. Table 5 indicated that both product and marketing divisions had no different opinions in determining
priorities of financial performance.
Both divisions were more inclined to
choose financial performance from the final calculation results, represented by revenue and profit, than to choose
from the unprocessed indicators. The revenue known as the result coming from total unit sales of product mul-tiplied by the product’s price, while
profit coming from reducing revenue
to any costs that the company have made, including operational costs.
b. Customer’s Indicator Level
Product Division. Level of churn rate got the highest relative weight with
0,373, followed by level of customer
satisfaction, level of customer loyalty and level of customer complain with
0,244; 0,235 and 0,148 respectively.
It concluded that level of churn rate became the most important sub-crite-rion to select the customer’s indicator level.
rela-tive weights 0,447. Further, it was
followed by level of customer satis-faction, level of churn rate and level of customer complain with relative
weight 0,302; 0,146 and 0,105 re -spectively.
Overall. There were some different opinions between product and mar-keting divisions, in terms of determin-ing the ranks for customer’s indicator level. Product division which more technical oriented than marketing di-vision chose level of churn rate as the most important sub-criterion. On the contrary, marketing division chose customer loyalty as the number one sub-criterion to select customer’s indi-cator level. For product division, level churn rate could be interpreted also as level of customer’s loyalty towards the products, in a more technical
lan-guage. It actually could be influenced
by their daily activities that were usu-ally oriented in technical matters. As perhaps in their product’s report, they were more familiar with technical
terms (churn rate) than general terms (level of customer’s loyalty).
Meanwhile, marketing division trans-lated loyalty much greater than the customers simply always using the product. They believed when the cus-tomers were loyal, they were not only using it continuously, but they would also recommended it to other people, willing to search for or even willing to pay premium for the products
(Far-ris, et al. 2010). For the division, this
conditions would eventually affecting level of churn rate, which means that if the customers were still loyal, its level of churn rate would also became lower.
c. Product Performance
Product Division. The most important sub-criterion in selecting the product performance was product quality with
relative weight 0,398. Product qual -ity had the highest relative weight of
all sub-criterion. The ranks were then followed by comfortably used by us-ers, easy to sell and product design
with relative weights 0,217; 0,216 and 0,170 respectively.
Marketing Division. For marketing division, comfortably used by users had the highest relative weights of all sub-criterion, which made it the most important sub-criterion in selecting the product performance. The position were then followed by easy to sell, product quality and product design as the least important sub-criterion with
the relative weights 0,294; 0,176 and 0,118 respectively.
Overall. The differences in opinions occured from both divisions. In select-ing the product performance, product division indicated that the product
needed to first have superior quality in
terms of product’s reliabilty, limpidity and speed. The division believed that superior product quality could ensure the customer’s pleasure in using the products. Meanwhile, marketing di-vision indicated that if the products were already comfortably used by customers, it means that the product were well accepted by the custom-ers, which resulted ease in selling the product. They believed that technical performance of the product could be developed and managed further after the customers experienced the prod-ucts. These conditions, perhaps, could be affected by their background and experiences towards managing the products.
d. Future Development Process
Product Division. The division re-sults showed that innovation played the most important role in selecting the future development process. It could be seen with the highest
rela-tive weight of 0,335. The position
were then followed by time to market, product’s STP and technology with
respectively. The least important indi-cator in the sub-criteria were resource allocation, infrastructure and external
collaboration (partner) with relative weights of 0,074; 0,072 and 0,04 re -spectively.
Marketing Division. Time to market became the most important sub-cri-terion in selecting the future devel-opment process in marketing
divi-sion, with the relative weight 0,260.
It were then followed by product’s STP, innovation and technology with
relative weights 0,159; 0,142 and 0,138 respectively. The least impor -tant sub-criteria in selecting future development process were infrastruc-ture, resource allocation and external collaboration with relative weights
0,120; 0,112 and 0,070 respectively.
Overall. Product division perceived innovation more important than time to market in determining future devel-opment process. They believed that either creating or managing product should begin with the new ideas or concepts that could distinguish them to competitors. Through these new ideas or concepts, they could prob-ably estimate all the requirements towards managing the products. It included when to launch the product to the market, product target, resource allocation, etc. On the other hand, marketing division tended to choose time to market as the most impor-tant sub-criterion in determining the future development process, which then followed by product’s STP. For the division, timing and the market’s
condition played a significant role in
determining the product’s success. They believed that all the product’s management process would be use-less if it was not launched at the right time. The reason could also be applied to the product’s STP. For them, every product was fundamentally designed for a certain market. Thus, an exact product’s STP was crucially needed by every product.
e. After Launch Effort
Product Division. The superior service quality had the highest relative weight among all sub-criteria in determining
the after launch effort with 0,530. It
was then followed by continuous im-provement, marketing promotions/ef-fort and product coverage as the least important with the relative weights
0,269; 0,108 and 0,093 respectively.
Marketing Division. The division results showed that continuous im-provement was the most important sub-criterion in determining the after
launch effort with 0,353, followed
by marketing promotion efforts with
0,225. The least important groups
were product coverage and superior service quality with relative weights
0,214 and 0,208 respectively.
Overall. Product division tended to choose superior service quality as the most important factor in determining after launch effort, which then fol-lowed by continuous improvement. The superior service quality which not only focused on the customers but also focused on quality service of the internal company, such as repair-ing response of the networks, equip-ments and also service level guaran-tee, were required to be applied in order to facilitate the product’s con-tinuous improvement. Different to product division, marketing division perceived continuous improvement as the most important sub-criterion in determining the after launch effort. The division believed that continuous improvement was the way to the keep
the customers satisfied and loyal to
the product. The effort could then be supported through marketing promo-tions activities.
f. Competitive Performance
sub-crierion in determining the competi-tive performance, with the relacompeti-tive
weight 0,366. It was then followed by
customer solution and product
offer-ings (augmentation) with the relative weights of 0,278 and 0,148 respec -tively. The least important groups were price/tariff and company image
with relative weights 0,117 and 0,092
respectively.
Marketing Division. The most impor-tant sub-criterion to determine com-petitive performance in marketing division was customer solution with
relative weight 0,368. The other fol -lowing sub-criteria were value deliv-ery of a product, price/tariff, company image and product offerings
(augmen-tation) with relative weights 0,221; 0,180; 0,124 and 0,107 respectively.
Overall. Product division perceived that technical specialty of a product was important, such as value delivery of a product. For the division, a prod-uct must deliver the same value as its planned beforehand. They believed if the product could deliver the value well, the customer’s issues could have been solved with the existence of the products. Meanwhile, marketing divi-sion perceived that a good competi-tive performance of a product was a product that have an ability to solve every customers issues. It means that the existence of a products, could eventually increase the customer’s business value. If the conditions have been achieved, the division believed that the product already have deliv-ered its value to the customers.
3. The Result of Core Category
The results indicated that the core
catego-ry from the AHP model was financial perfor -mance, which also consists of revenue and
profit. The financial performance as the core
category from this study have been known as a critical success factors of products in telecommunication factors. The extant
lit-eratures (Farris, et.al. 2010 ; Munoz 2008;
Cooper and Kleinschmidt 2007) had stud
-ied the indication of financial performance
as the critical success factors of a product.
Farris et.al.(2010) emphasized that finan -cial performance already got the top rank of all selected indicators. In addition, it also
showed that profit and revenue achieved the top position of all financial performance in -dicators.
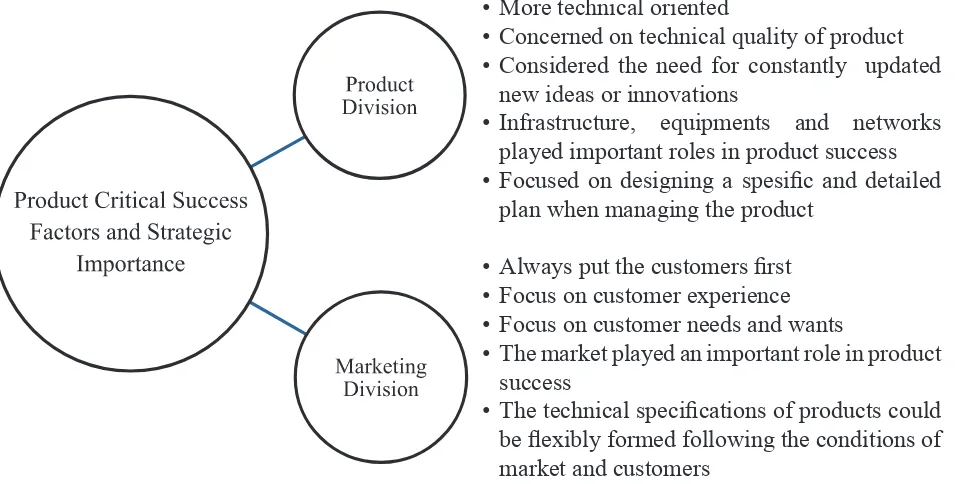
4. The Different Vision Between Product and Marketing Divisions
Despite the same perception in determin-ing the most important criteria, both division also faced some differences in perspective to determine the prioritization among sub-criteria. The different perspectives between both divisions could be further translated into insights representing their character towards critical success factors of product. The characteristics of both divisions was
de-picted in Figure 3.
Figure 3 described that basically, prod -uct division was more focused on managing product through technical approaches. The division was more concerned on not only about technical quality of products but also
designing a specific plan when managing the
products. They believed in requirement to constantly updated the ideas, infrastructure, equipments and networks during managing the products. Meanwhile, marketing divi-sion were characterized as always putting
the customers first. They were more focused
on either customer experience, needs and
wants than technical specifications. To them, technical specifications could be flexibly
formed following the conditions of market and customers. The study indicated that dif-ferentiation of vision between product and
marketing divisions could influence their
conditions in discussing either the selection of products which would be launched to the market or the resource allocated to the prod-ucts.
The different results between two divisions seemed contrary to a state that an organization
established through developing and managing
the products. Whereas, at the initial stage of
developing the product, the company divisions certainly have to communicate the objective or vision towards the product. It raises a require-ment for any company to create a clear vision that could guide its divisions in achieving their goals. The clear vision could both turn the com-pany into more capable in creating the needs for change due to time development and enhance alignment around business processes, conse-quently the company can become more effec-tive in implementing its strategies. Creating a vision would also result in a clearer and more persuasive communication among all compa-ny’s divisions.
It was quite difficult for the divisions to di -rect its activities, without a clear vision inside
a company, which cause difficulties for indi -viduals in effectively implementing their ef-forts towards the company goals. A company
without (or lack of) a clear vision often resulted
in a fragmented activities of its individual units
(Moore, Konrad and Hunt, 2010).
Certainly, creating a clear and precise vi-sion is not an easy task. It required involvement from all company’s divisions, especially the se-nior company leaders to build an ideal state of a company forward. The two-way communica-tion between managers are important for
reduc-ing uncertainty about the impact of vision aber-ration that have been implemented previously.
Conclusions and Implications
The study was intended to analyze different perspectives between product and marketing divisions through determining the critical suc-cess factors of a product in telecommunication sectors using GT method. By studying the rel-evant literatures and interviewing practitioners in telecommunication sectors in Indonesia, the possible success factors were established. The experts from both product and marketing
di-visions have identified six criteria for critical
success factors product in telecommunication
sectors. These criteria were: financial perfor -mance, customer’s indicator level, product per-formance, future development process, after launch effort and competitive performance. The
experts from both divisions agreed that finan -cial performance was the core category which played a big role in selecting critical success factors of a product in telecomunication sectors. It was followed by customer’s indicator level as the second most important criterion in deter-mining critical success factors of a product in telecomunication sectors. The six critieria were also consists of some sub-criteria. Throughout the sub-criteria selection, the experts were also
• More technical oriented
• Concerned on technical quality of product • Considered the need for constantly updated
new ideas or innovations
• Infrastructure, equipments and networks
played important roles in product success
• Focused on designing a spesific and detailed
plan when managing the product
• Always put the customers first • Focus on customer experience • Focus on customer needs and wants
• The market played an important role in product
success
• The technical specifications of products could be flexibly formed following the conditions of
market and customers
agreed to indicate that both revenue and profit had an important role in determining the finan -cial performance.
Though the experts seemed agree to indicate
financial performance’s sub-criteria, they also
faced some different perspectives in
determin-ing prioritizations of five other sub-criteria.
These appeared to show some perspective and focus differentiations between divisions, which seemed contrary to a state that an
organiza-tion must create a unified vision and focus in
achieving its goals. These perspective differen-tiations could be used to characterize both divi-sions towards selecting critical success factors of product and strategic importance. Product di-visions were more focused on managing prod-uct through technical approaches, they were characterized by their focus on technical
speci-fications, while marketing division were more
focused on customer and market conditions. The implication for academics when ducting the research was they needed to con-sider in using understanable words, languages or descriptions when forming both the criteria and sub-criteria for it would affect the experts in pairwise comparison. They also needed to develop different critical success factors to measure the product importance. For managers or practitioners, the results showed some points of critical success factors that could determine product strategic importance, which was from the results managers could cautiously allocate their precious resources into certain factors or stages when managing the products. However, in order to do these well, the company also re-quired a clear and focused vision towards its
objective. Interfunctional managers should
co-operate in finding a way to reach an agreement
towards the same vision, which eventually would form conditions of good
communica-tion and coordinacommunica-tion between divisions. With
proper communication and coordination, the transfer of information, skills and costs could be performed well. Thus, simplifying the prod-uct management itself.
Future research
The research provided a base for further re-search in an area of product importance of tele-communication – different perspectives of inter divisions, particularly product and marketing divisions. The links between methods and re-sults presented in this paper could be further ex-amined and better understood through further research. First, on behalf of generalizing the results, propositions of testing on a larger num-ber of sample would be necessary, which could cover both the other telecommunication com-pany and experts. Second, it seemed necessary to develop other critical success factors in tele-communication sectors which could match with development of time. Third, since the study was based on Indonesian telecommunication com-pany, the future research could be conducted in other countries. Fourth, the future research to
investigate consequences in the field was also
necessary, especially for telecommunication company. Finally, cross studies on different di-vision which involved marketing didi-vision could be useful to clarify this study.
References
Balasubramaniam, Karthik. (2007), “Product Portfolio Management and the Industry Lifecycle”, Electrical and Systems Engineering-University of Pennsylvania.
Byrne, Michelle. (2001), “Grounded Theory as Qualitative Research Methodology”, Association of
Operating Room Nurses-AORN Journal, Vol. 73 No. 6, pp. 1155.
Cauchik Miguel, Paulo A. (2008), “Portfolio Management and New Product Development Imple-mentation: A Case Study in Manufacturing Firm”, International Journal of Quality & Reliability
Management, Vol. 25 No. 1, pp. 10-23.
Cooper, Robert G. and S.J. Edgett. (1996), “Critical Success Factors for New Financial Services”,
Cooper, Robert G, Scott J. Edgett, and E.J. Kleinschmidt. (1997), “Portfolio Management in New Product Development: Lessons from the Leaders”, Research Technology Management, Vol. 40
No. 5, pp. 16.
Cooper, Robert G and E.J. Kleinschmidt. (2007), “Winning Business in Product Development: The Critical Success Factors”, Research Technology Management, Vol. 50 No. 3, pp. 52.
Dolbeck, Andrew. (2006), “Competition in the Telecommunication Industry”, Weekly Corporate Growth Report, February.
Farris, Paul W., Neil T. Bendle, Phillip E. Pfeifer, and D.J. Reibstein. (2010), “Marketing Metrics-The Definitive Guide to Measuring Marketing Performance”, Pearson Education, Inc.
Friend, B. and Thompson, O. (2003), “Marketing & Production Get in-sync with the Demand-driven Supply Chain”, Food Engineering, Vol. 75 No. 5, pp. 49.
Gould, L.S. (2009), “Introducing Product Portfolio Management”, Automotive Design &
Produc-tion, Vol. 121 No. 1, pp. 40.
Gunasekaran, Angappa., E. Tirtiroglu, and V.Wolstencroft, V. (2002), “Gap Between Production and Marketing Functions: a Case Study”, Journal of Management Decision, Vol. 40 No. 5/6, pp.
428-435.
Halaweh, Mohanad. (2012), “Using Grounded Theory as a Method for System Requirements Analy-sis”, Journal of Information Systems and Technology Management, Vol. 9 No. 1, pp. 23-38.
Jyun Cheng, Colin C. and E.C. Shiu. (2008), “Critical Success Factors of New Product Development in Taiwan’s Electronics Industry”, Asia Pasific Journal of Marketing and Logistics, Vol. 20 No. 2,
pp. 174-189.
Killen, Catherine P., Robert A. Hunt, and E.J. Kleinschmidt. (2008), “Project Portfolio Management for Product Innovation”, International Journal of Quality & Reliability Management, Vol. 25 No.
1, pp. 24-38.
Kosaroglu, Mustafa. and R. A. Hunt. (2009), “New Product Development Projects and Project Man-ager Skill Sets in the Telecommunications Industry”, International Journal of Managing Projects in
Business, Vol. 2 No. 2, pp. 308-317.
Leitch, Robert A. (1974), “Marketing Strategy and the Optimal Production Schedule”, Management
Science, University of Georgia, Vol. 21 No. 3, pp. 302.
Mansourian, Yazdan. (2006), “Adoption of Grounded Theory in LIS Research”, New Library World,
Vol. 107 No. 1228/1229, pp. 386-402.
McClure, Dave. (2003), “Managing a Portfolio: A Sluggish Economy Boosts the Value of these Tools”,
Accounting Technology, Vol. 19 No. 3, pp. 25.
McSparran, K. (1995), “Managing the Product Portfolio”, Beverage World, Vol. 114 No. 1585, pp.
101.
Massey, Graham R. and E. Kyriazis. (2007), “Interpersonal Trust Between Marketing and R&D Dur
-ing New Product Development Projects”. European Journal of Market-ing, Vol. 41 No. 9, pp. 1146-1172.
Mills, Jane., Ann Bonner, and K. Francis. (2006), “The Development of Contructivist Grounded The-ory”, International Journal of Qualitative Methods, Vol. 5 No. 1, pp. 3.
Ming Chen, Jen., L. Tu Chen, and J. Der Leu. (2006), “Developing Optimization Models for Cross-Functional Decision Making: Integrating Marketing and Production Planning”, OR Spectrum,
Vol. 28, pp. 223-240.
Mogadham, Keyvan R., and E. Karami. (2008), “A Multle Criteria Evaluation of Sustainable Agricul-tural Development Models Using AHP”, Springer Science-Business Media, Vol. 10, pp. 407-426.
Moore, Mark E., Alison M. Konrad, and J. Hunt. (2010), “Creating a Vision Boosts the Impact of Top Management Support on the Employment of Managers with Disabilities-The Case of Sport Organizations in the USA”, Equality, Diversity and Inclusion: An International Journal, Vol. 29
No. 6, pp. 609-626.
Ogawa, D. and Ketner, L. (1997), “Benchmarking Product Development”, Telephony-Marketing and
Services, Vol. 232 No. 4, pp. 34.
Pitta, Dennis A. (2008), “Product Innovation and Management in A Small Enterprise”, Journal of
Product & Brand Management, Vol. 17 No. 6, pp. 416-419.
Rao, Sanjay K. (2009), “Re-energizing a Product Portfolio: Case Study of a Pharmaceutical Merg-er”, Journal of Business Strategy, Vol. 30 No. 6, pp. 52-62.
Ruekert, Robert W. and O.C. Walker, Jr. (1987), “Interactions Between Marketing and R&D Depart-ments in Implementing Different Business Strategies”, Strategic Management Journal, Vol. 8, pp.
233-248.
Saaty, Thomas L. (1990), “The Analytic Hierarchy Process”, RWS Publications.
Sabbagh, Karim., Chady Smayra, Amr Goussous, and N. Mathieu. (2012), “Managing Telecom Portfolios for Sustainable Growth”, Perspective-Booz & Company.
Suwannaporn, Prisana. and Mark W. Speece. (2010), “Assessing New Product Development Success Factors in the Thai Food Industry”, British Food Journal, Vol. 112 No. 2, pp. 364-386.
Zarif, Tayyaba. (2012), “Grounded Theory-An Overview”, Interdisciplinary Journal of