Site this Article As ………. Paper Accepted : June, 9th 2017 Paper Published : August, 11th 2017
1
STRATEGIES OF MAINTENANCE MODEL FOR EXERCISE BOOK
MANUFACTURING MACHINE ON PAPER INDUSTRY BY IMPLEMENTING
MONTE CARLO SIMULATION APPROACH
Fina Andika Frida Astuti 1), Sugiono2), Moch. Agus Choiron 3) Faculty of Engineering, Universitas Brawijaya
Jl. MT. Haryono No. 167, Malang
Abstract
PT. XYZ is one of paper companies in East Java that produces Exercise Books. This company used corrective maintenance for Exercise Book machine. This corrective maintenance brings about high frequency of the machine breakdown and high maintenance cost. Therefore, to solve the problem required the interval maintenance planning. There are 3 maintenance scenarios, namely; scenario based on the existing condition of the company, scenario of component replacement in accordance with Mean Time to Failure (MTTF) value, and scenario of component replacement when the reliability of the component has reached 70%. From those three scenarios we will manually carry out an interval maintenance planning and Monte Carlo simulation. The result of data processing shows that in order to minimize the number of Exercise Book machine breakdown we can apply the 3rd scenario namely the replacement of component when the reliability of component has reached 70%. Proper maintenance strategy to minimize the amount of downtime and maintenance costs appropriately we shall use scenario 2, namely the replacement of component based on the Mean Time To Failure (MTTF).Key words: Exercise Book Machine, Mean Time to Failure, Component Reliability, Monte Carlo Simulation.
1. Preface
Today's advance of technology and development of the industry require companies to move quickly in making innovations and specific policies in order to compete in the industrial world. One of the policies that can be applied in the company is the policy on maintenance. Maintenance is all activities conducted to maintain or restore the condition of the equipment or machinery in accordance with the desired function [1].
PT. XYZ is a paper manufacturing company in East Java, which produces Exercise Books. In order to meet high demand for its Exercise Book product, the company operates for 24 hours with three shifts. By implementing 24 hours' operating system, the company applies a corrective system to maintain its machine, namely the replacement of component when the machine is damaged. This maintenance system causes frequent sudden machine stopping during production process. It may trigger further damage to raw materials during machinery processing, causing losses for the company.
* Corresponding author. Email : [email protected] Published online at http://Jemis.ub.ac.id
Copyright ©2015 JTI UB Publishing. All Rights Reserved
To minimize this, better interval maintenance planning is required in order to reduce the frequency of breakdowns that occur suddenly. Another goal is to minimize downtime and costs due to maintenance activities. In practice it is extremely difficult to determine the operational or maintenance strategy facilities strategies in order to reduce maintenance costs [2]. The uncertainty in preventive maintenance activities can be solved by using model parameters which are made to achieve the expected target. Monte Carlo simulation can predict future performance [3]. The method used for the analysis of maintenance costs must be able to measure the effect of the operating environment on the reliability of the system and measure of uncertainty [4]. Monte Carlo method is often referred to as statistical simulation method. This method can be used in many areas or places to solve the problem containing uncertainty [5].
Site this Article As ………. Paper Accepted : June, 9th 2017 Paper Published : August, 11th 2017
2 2. Research Methodology
The method used is to determine the scenario of machinery maintenance with Monte Carlo simulation machine. There are 3 maintenance scenario that are used, namely the scenario based on the existing condition of the company, the scenario of component replacement based on Mean Time to Failure (MTTF) value, and the scenario of component replacement when the reliability of component has reached 70%. From those 3 scenarios the planning of maintenance interval is carried out manually and Monte Carlo simulation is implemented.
The key of the Monte Carlo method is the use of random number which will be raised and during the simulation process. The random number is generated based on the probability distribution of the data processed. Random number used in the Monte Carlo simulation that has been raised must be validated with available real data so that the simulation that we do has similar condition with real data.
3. Result and Discussion
The data on the frequency of the damage of Exercise Book Machine Units (EBMU) can be seen in Table.1 below.
Table 1. Frequency of the Damage of EBMU
COMPONENT 2013 2014 2015 Frequency of The Damage
(times)
PRINTING 50 80 57 187 TRIMMING 39 51 51 141 LONG KNIFE 35 31 48 114 STITCHING 23 27 42 92 CROSS CUTTING 30 38 12 80 BACK PRESING 10 10 34 54
UNWIND 3 6 22 31
COLECTING 8 11 4 23
DELIVERY 3 5 4 12
BACK STAND 4 1 6 11
FOLDING 0 4 3 7
TOTAL 205 264 283 752
Based on the Table 1 we can observe that the critical machinery unit is reached by printing machine with the total damage as much as 187 times. So this research is focused on the printing unit. With the number of components in the printing unit is amounted to 8 components.
3.1. Estimation of Distribution
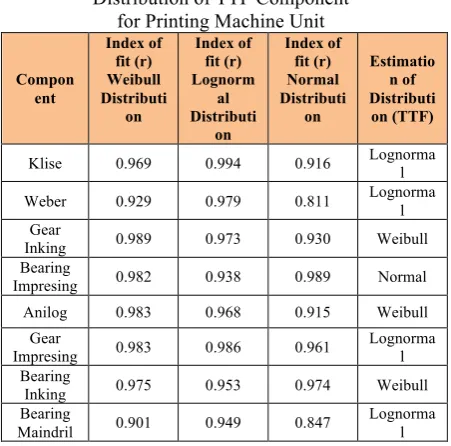
Value of selected Fit Index (r) is the index of Fit (r) which has the greatest value where at the same time plays the role as the estimation of the type of distribution for each component.
Table 2. Recapitulation of the Estimation of Data Distribution of TTF Component
for Printing Machine Unit
Compon ent
Index of fit (r) Weibull Distributi
on
Index of fit (r) Lognorm
al Distributi
on
Index of fit (r) Normal Distributi
on
Estimatio n of Distributi
on (TTF)
Klise 0.969 0.994 0.916 Lognorma
l
Weber 0.929 0.979 0.811 Lognorma
l Gear
Inking 0.989 0.973 0.930 Weibull
Bearing
Impresing 0.982 0.938 0.989 Normal
Anilog 0.983 0.968 0.915 Weibull
Gear
Impresing 0.983 0.986 0.961
Lognorma l Bearing
Inking 0.975 0.953 0.974 Weibull
Bearing
Maindril 0.901 0.949 0.847
Lognorma l
3.2. Fit of Distribution Test
From the highest value of Index of Fit (r), the estimation of initial distribution of each component is selected. The next step is performing distribution test to each component. Distribution test for Lognormal and Nornal distribution was conducted by using Kolomogorov Smirnov test. For Weibull distribution, the fit of distribution test is implemented by using Mann T Test.
3.3. Determination of the Parameters and the Value of Mean Time to Failure (MTTF) of the Component of Printing Machine Unit
Site this Article As ………. Paper Accepted : June, 9th 2017 Paper Published : August, 11th 2017
3
Table 3. Parameter and MTTF Value of TTF Data of the Component of Printing Machine Unit
Component Distribution
(TTF) Parameter
MTTF (minute)
Klise Lognormal
Loc (µ)= 9.64519
21091.42 Scale (σ) =
0.789217
Weber Lognormal
Loc (µ)= 10.0235
36520.16 Scale (σ) =
0.981957
Gear Inking Weibull
Scale (θ)=
Impresing Normal
Mean (µ)= 96625
96625 St.dev(σ)=
53252.5
Anilog Weibull
Scale (θ)=
Impresing Lognormal
Loc (µ)=11.367
117539.3 Scale (σ) =
0.784255
Bearing Inking Weibull
Scale (θ)=
Maindril Lognormal
Loc (µ)=11.2327
127620.2 Scale (σ) =
1.02383
3.4. Determination of Parameter and Value of Mean Time to Repair (MTTR) of the Component of Printing Machine Unit
The next stage after identifying that the distribution of fit test data has been in accordance with the initial estimate of the distribution is to determine the parameters for data Time to Repair (TTR) for each component. The value of this data parameter of Time to Repair (TTR) will be used to determine the value of Mean Time to Repair (MTTR).
Table 4. Parameter and MTTR of TTR Data of the Component of Printing Machine Unit
Component Distribution (TTR) Parameter MTTR (minute)
Klise Lognormal
Loc (𝜇)=
4.47729 117.81539 Scale (σ) =
0.763975
Weber Lognormal
Loc (𝜇)=
3.50666 38.86431 Scale (σ) =
0.553925
Component Distribution
(TTR) Parameter
MTTR (minute)
Gear Inking Normal
Mean (µ)= 76 76 St.dev(σ)=
34.7818
Bearing
Impresing Lognormal
Loc (𝜇)=
4.18151 87.47994 Scale (σ) =
0.761446
Anilog Lognormal
Loc (𝜇)=
4.39431 92.95275 Scale (σ) =
0.524939
Gear
Impresing Lognormal
Loc (𝜇)=
3.95813 70.01784 Scale (σ) =
0.762391
Bearing
Inking Weibull
Scale
(θ)=121.697 107.8284 Shape
(β)=2.28962
Bearing
Maindril Normal
Mean (µ)= 90 90 St.dev(σ)=
24.5241
3.5. Generation of Maintenance Scenario The maintenance scenario will be simulated to determine the type of maintenance and proper interval of replacement for each critical component. There are 3 proposed maintenance scenarios, namely: In scenario 1, critical component is replaced based on the existing condition of the company. Scenario 2, component is replaced in accordance with MTTF values, and for scenario 3: component will be replaced when the reliability of the component has reached 70%.
Table 5. Recapitulation of the Scenario of Maintenance Interval of the Component
of Printing Machine Unit
Component Scenario 1
21091.42 10167
Weber Actual Data
36520.16 13400
Gear Inking Actual Data
96254.34 33740
Bearing
Site this Article As ………. Paper Accepted : June, 9th 2017 Paper Published : August, 11th 2017
4 Actual Data Time to Failure (TTF) and
Time to Repair (TTR) for Bearing Maindrill listed in the Table 6.
Table 6. The actual Data TTR and TTF Bearing Maindrill
Date Start (time)
Finish (time)
TTR (minute)
TTF (minute)
May 16, 2014 18:22 20:02 100 0 June 6, 2014 21:15 23:00 105 30313 July 11, 2014 19:03 20;03 60 50163 August 6, 2014 08:14 09:39 85 36731 Sept 17, 2014 16:34 17:34 60 60895 May 29, 2015 07:51 09:31 100 365177 Sept 10, 2015 11:12 13:12 120 149861
3.6. Random Number Generation
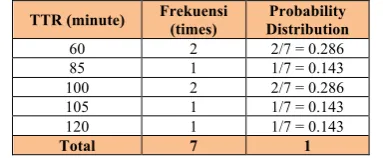
The generation of random number for Time to Failure (TTF) data and Time to Repair (TTR) of the component of Exercise Book machine unit is the stage to run a Monte Carlo simulation. Random number that will be raised is based on the probability distribution of the initial data Time to Failure (TTF) and Time to Repair (TTR) that exist in the company. The generation of random numbers Time to Failure (TTF) and Time to Repair (TTR) components of the machine unit Exercise Book is intended to produce figures that have equal distribution with data population of Time to Failure (TTF) and Time to Repair (TTR) of the actual component of Exercise Book machine unit. The first step in generating random number is to determine the probability distribution of the data variables of Time to Repair (TTR) for each component of the machine unit.
Table 7. Distribution of Probability Data of TTR Bearing Maindrill Based on Actual Condition
TTR (minute) Frekuensi (times)
Probability Distribution
60 2 2/7 = 0.286
85 1 1/7 = 0.143
100 2 2/7 = 0.286
105 1 1/7 = 0.143
120 1 1/7 = 0.143
Total 7 1
Based on Table 7 so set the cumulative probability distribution of TTR Data of the component Bearing Maindrill.
Table 8. Cumulative Probability Distribution of TTR Data of the Component of Bearing Maindrill
TTR (minute)
Probability Distribution
Cumulative Probability Distribution
60 2/7 = 0.286 0.286
85 1/7= 0.143 0.429
100 2/7 = 0.286 0.714
105 1/7 = 0.143 0.857
120 1/7 = 0.143 1.000
Determine the random number for Time to Repair (TTR) data of which interval of random number has been predetermined on the previous stage.
Figure 1. Random Number Generation of TTR Data of the Component of Bearing Maindrill.
The next phase is to develop a random number of Time to Repair (TTR) data based on the random number that was generated in Excel
Table 9. Time to RepairBearing Maindrill Value
Result of Random Number Generation
Rando m Numb
er Replic ation 1
Value TTR Generat
ion Replicat
ion 1
Rando m Numb
er Replic ation 2
Value TTR Generat
ion Replicat
ion 2
Rando m Numb
er Replic ation 3
Value TTR Generat
ion Replicat
ion 3
0.953 120 0.438 100 0.655 100
0.239 60 0.572 100 0.487 100
0.815 105 0.546 100 0.257 60
0.661 100 0.508 105 0.166 60
0.303 85 0.636 100 0.090 60
0.588 100 0.116 60 0.295 85
0.109 60 0.527 100 0.780 105
0.777 105 0.308 85 0.763 105
Site this Article As ……….
3.7. Simulation Based on each Scenario This simulation process is done based on three scenarios that have been established for each component. This simulation is planned for 1 year (365 days) with 3 replication for each scenario.
In addition to the calculation of maintenance interval with simulation, the calculation of interval maintenance is also made without the simulation process. It aims to determine to find out the maintenance interval in ideal conditions and the maintenance interval based on the
The maintenance simulation performed to EBMU is based on the interval scenario of the replacement that was previously determined. It aims to identify the amount of the damage and downtime as the consideration to determine appropriate models of maintenance.
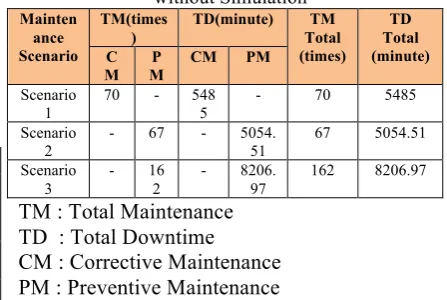
Table 10. The Recapitulation of Total Maintenance and Downtime Based on Simulation
Maint enanc e Scena
rio
TM(times) TD (minute) TM
TM : Total Maintenance
TD : Total Downtime
CM : Corrective Maintenance PM : Preventive Maintenance
The recapitulation of maintenance and breakdown on the result of simulation for Printing machine unit can be perceived that scenario 2, namely the replacement of component based on the MTTF value has the lowest downtime value of 4707 minutes. Despite having more total maintenance than scenario 1, the total downtime of scenario 2 remains the smallest.
3.9 Analysis of Maintenance Cost for EBMU Based on the Calculation without Simulation
After calculating the costs incurred by the company in the context of the maintenance of the component of the EBMU for each scenario, we can observe the cost difference between those three maintenance scenarios conducted without simulation process. The following is the recapitulation of the result of calculation of the maintenance cost for the EBMU based on each maintenance scenario.
3.10. Analysis of Maintenance Interval of the EBMU without Simulation
The planning of maintenance interval of the component EBMU based on each maintenance scenario aims to identify the total number of maintenance and the total maintenance downtime in ideal conditions
Table 11. The Recapitulation of the Total Maintenance and the Total Downtime of the EBMU
without Simulation
TM : Total Maintenance TD : Total Downtime
CM : Corrective Maintenance PM : Preventive Maintenance
Site this Article As ………. Paper Accepted : June, 9th 2017 Paper Published : August, 11th 2017
6 Book machine unit, it can be seen that scenario
2, namely; the replacement of component based on the MTTF value has the lowest downtime value of 5054.51 minutes compared with the value of downtime of the other scenarios. This is because the researchers group various intervals that have the same type of maintenance into one group so that the machine does not stop frequently. For the amount of maintenance in scenario 2 of 67 times is less than scenario 1 maintenance with the amount of maintenance as many as 70 times and scenario 3 that is as many as 162 times.
3.11. Analysis of Maintenance Cost for EBMU Based on the Calculation without Simulation
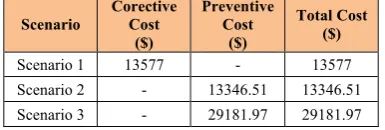
After calculating the costs incurred by the company in the context of the maintenance of the component of the EBMU for each scenario, we can observe the cost difference between those three maintenance scenarios conducted without simulation process. The following is the recapitulation of the result of calculation of the maintenance cost for the EBMU based on each maintenance scenario.
From the above-mentioned data it can be seen the maintenance scenario that produce the lowest maintenance cost to the EBMU is scenario 2 (the replacement of component based on the value of MTTF) in the amount of $ 13346.51. Scenario 2 has smaller maintenance cost compared to other scenarios because it has smaller downtime value than other scenarios.
Table 12. The Recapitulation of the Result of Cost Calculation for EBMU without Simulation Process
Scenario
Corective Cost
($)
Preventive Cost
($)
Total Cost ($)
Scenario 1 13577 - 13577
Scenario 2 - 13346.51 13346.51 Scenario 3 - 29181.97 29181.97
Analysis of Maintenance Cost for the EBMU Based on Simulation. The following is the recapitulation of cost calculation for the EBMU based on three scenarios with simulation process.
Table 13. The Recapitulation of the Cost Calculation for the EBMU Based on Simulation
Scenario
Corective Cost
($)
Preventive Cost
($)
Total Cost ($)
Scenario 1 13264 - 13264
Scenario 2 4537 8630.67 13167.67 Scenario 3 2594.67 31069 33663.67
From the calculation we can observe that the maintenance scenarios which produces the lowest maintenance cost to the EBMU is scenario 2 (the replacement of component based on the value of MTTF) in the amount of $ 13167.67. Scenario 2 has smaller maintenance cost compared other scenarios because it has smaller downtime value than other scenarios.
4. Conclusion
Based on the result and discussion that have been conducted by the researchers, the conclusions which can be drawn are among others:
1. Critical machine unit on the Exercise Book machine is a machinery unit that has high frequency of damage. Critical machine unit on the Exercise Book machine is Printing machine unit with the total damage of 187 times, 2. For the average time interval for component reparation of the Exercise Book machine unit which includes cliché component with the time interval of reparation of 117.81539 minutes, Weber component of 38.86431 minutes, inking Gear component of 76 minutes, Bearing Impressing component of 87.47994 minutes, Anilog component of 92. 95275 minutes, Gear Impressing component of 70.01784 minutes, Bearing Maindrill component of 90 minutes,
2. The most appropriate maintenance strategy with Monte Carlo simulation aimed to minimize the frequency of the breakdown of Exercise Book (EB) machine unit is the maintenance scenario 3 which is the replacement of the component when the value of the reliability of the component has reached 70%, with a total number of breakdown frequency of the Exercise Book machine unit reaching 13 times.
Site this Article As ………. Paper Accepted : June, 9th 2017 Paper Published : August, 11th 2017
7 minimize the cost of maintenance is the
scenario 2 which is the replacement of the component of the Exercise Book machine unit based on the value of MTTF with the maintenance cost amounting to $ 13,167.67. Whereas the most appropriate scenario aimed to minimize machine downtime of the Exercise Book machine unit is scenario 2, namely the replacement of the component of the Exercise Book machine unit based on the value of MTTF, with the value of downtime of 4707 minutes or decreases 25.40% compared to scenario 1 which is the replacement of the component based on the existing condition of the company where the new component will be replaced if the said component experiencing damaged.
Bibliography
[1.] Dhillon. 2002, Engineering Maintenance A Modern Approach, New York: Boca Raton CRC Press.
[2.] Gao. 2010, “An approach for prediction of petroleum production facility performance considering Arctic influence factors”, Reliability Engineering and System Safety Journal, Vol. 95 No. 8, pp. 837-46
[3.] Denysiuk, Roman. 2016. Multiobjective Optimization of Maintenance Scheduling: Application to Slopes and Retaining Walls.
International Conference on
Transportation Geotechnics (ICTG 2016). Procedia Engineering. Vol 143: 666–673 [4.] Kayrbekova, Dina. 2011. Maintenance
Cost Evaluation of A System to be used in Arctic Conditions. Journal of Quality in Maintenance Engineering. XVII (4) :320 – 336.