Volume 17, Number 01 (2017): 23-32
CONSUMER ACCEPTANCE TOWARDS ONLINE
GROCERY SHOPPING IN MALANG, EAST JAVA,
INDONESIA
Wisynu Ari Gutama
1, Anggya Puspita Dewi Intani
21
Lecturer of Socio-economics of Agriculture Department, Faculty of Agriculture, University of Brawijaya 2
Student of Socio-economics of Agriculture Department, Faculty of Agriculture, University of Brawijaya
*corresponding author: [email protected]
ABSTRACT: Online grocery shopping in Indonesia has been applied by one platform called Happyfresh, which cooperates through many modern supermarkets. One supermarket that conducts this cooperation to supply grocery products is Loka Mart. Currently, online grocery shopping facility that implemented by Loka Mart is still limited and only coverage Jakarta area. Thus, it is necessary to conduct study related to the public acceptance to the online grocery shopping in Malang City as the potential online market due to the level of education of the society. The data are obtained through the questionnaire of 140 respondents of Loka Mart consumer. Technology Acceptance Model (TAM) is employed as the foundation in this study. Besides, visibility, risk perception, and social influence variable – which used in the study of Sherah and Ai-Wen (2003) – analyzing Australian people acceptance towards online grocery shopping – used in this study. Multiple regression analysis, pearson correlation, and biserial point used as analysis instrument in this study. The study result showed that basic model of TAM – which consists of perceived of usefulness, perceived ease of use, and social influence variable – could explain public acceptance in Malang City to the online grocery shopping. Moreover, the visibility and risk perception variable have no effect in explaining public acceptance to use online grocery shopping. This result also shows that, Online Grocery Acceptance Model explains how the behavior and characteristics of the consumers in utilizing online grocery service. Perceived of usefulness is the main factor affecting online grocery acceptant and the perceive ease of use is correlated highly with perceived of usefulness.
Keywords: online grocery, Technology Acceptance Model, social influence, shopping
INTRODUCTION
Online grocery shopping is marketing system that implemented by a retail or supermarket to market their products by e-commerce. A study that conducted by Kurnia et al., (2015) about e-commerce adoption to the online grocery retailer in Indonesia showed that retailer compatibility in using technology application, benefit consideration, and cost factor will make profit to the company by increasing positive acceptance towards online grocery retailer in implementing e-commerce system. It is contradiction compared to the public attitude towards online grocery shopping. According to Indonesian E-Commerce Association (IdEA), purchase intention of online grocery products through e-commerce in 2014 reaches up to 24% in which it is lower than consumer intention to purchase other product category such as fashion
product 78%, mobile 46%, electronic product 43%, as well as book and magazine which reaches up to 39%. Many product categories, in general, can be sold easily through e-commerce system, for instance, fashion and gadget product. However, other product category, such as grocery product, is still unfamiliar among people. Many previous studies also showed that online grocery shopping is a new concept, thus many people still unfamiliar with this concept (Grewal et al., 2004; Penim, 2013; Benn et al., 2015). Despite online grocery shopping still included into relatively new idea, product characteristics of online grocery also cause this unfamiliarity to the online grocery shopping users.
During this time, this retail has built in many areas of Indonesia such as Balikpapan, Cibubur, Tangerang, and Malang. The development of e-commerce marketing system performed in partnership with platform of Happyfresh grocery in which this platform already cooperated with other retails and online grocery to market their products through application.
Currently, e-commerce system implementation of Loka Mart through its partnership with Happyfresh is still limited in Jakarta area. This coverage limitation results in the limited implementation for online grocery shopping service in other areas of Loka Mart branch, including retail in Malang City. The development of e-commerce marketing system in Loka Mart attempts to give ease shopping service for consumers especially for who have preference in shooping online. It is expected that online grocery shopping system can be implemented not only in Jakarta City but also in other areas, such as Malang. Therefore, analysis to the consumer acceptance towards online grocery shopping is necessary to be conducted in order to know the relevance of this marketing system to be implemented in the retail/online grocery in Malang City.
STUDY METHODS The study location
Location in this study determined purposively, which is Loka Mart, Malang City Point, Jl. Terusan Dieng No.32, Sukun, Malang City, East Java. This study was conducted on March – June 2016.
Sampling method and the analysis
Sample determination technique was conducted by using non-probability sampling technique, which is accidental sampling (sample taking technique to the respondents that met during the study). The number of sample determined in this study refers to the sample need to run the data analysis chosen. Sidiqqui (2013) stated that sample number for multiple linear regression was 15 to 20 in each observation (predictor variable) or in each independent variable that used in the study.
Primary data are collected by distributing the questionnaire directly to the chosen consumers. The questionnaire consists of the questions for measuring PU (perceived of usefulness), PEOU (perceived ease of use), PR (perceived of risk), SI
(social influence), VIS (visibility), ATU (attitude toward usage) and BI (Behavioral Intention) variable. Multiple regression analysis is employed in order to generate the influence of those factors considered to the independent variable, which is attitude of online grocery shopping. Tests of classical assumption of multiple regression analysis are used, such as normality test, multicollinearity test, and heteroscedasticity test. This study also used Pearson correlation analysis to describe relationship strength of PEOU and PU variable, while biserial point correlation used to assess relationship between BI and ATU variable.
RESULTS AND DISCUSSION consumptive group and becomes the main strength in shopping activities, including online shopping. Therefore, Loka Mart attempts to service not only online market but also the conventional market.
In general, shopping activity performed more often by female. Females had more activities in doing grocery shopping through offline shopping (directly come to the store) or through catalogue than male consumers (Alreck and Settle, 2002 in Zhou et al., 2007). That showed that offline grocery products is more preferred than online grocery products.
High percentage of undergraduate education level indicated that Loka Mart has consumers of higher education background. It is relevant with education environment in Malang City where Indonesia Creative Cities Conference (ICCC) (2016) stated that Malang City as education city with many students and higher education of the people. Therefore, focusing the segmentation to the consumers with high education background would be very potential.
income range category of IDR 2,600,000-IDR 6,000,000; while upper-middle class included into income range category above IDR 6,000,0000. Therefore, Loka Mart has potential to develop
marketing system by seeing consumers in those economic classes. Promotion is part of the way how this strategy should be introduced to new potential consumers.
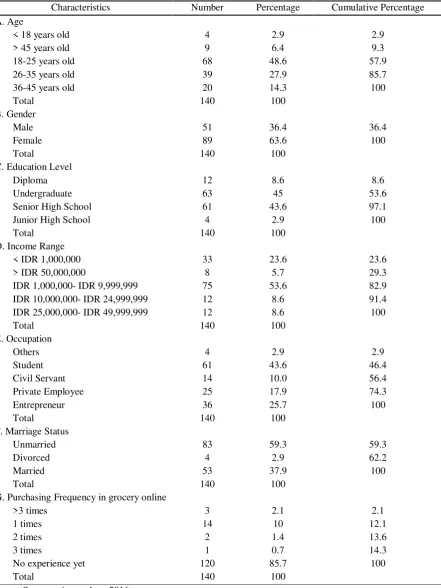
Table 1. The respondent characteristics of online grocery shopping
Characteristics Number Percentage Cumulative Percentage A. Age
< 18 years old 4 2.9 2.9
> 45 years old 9 6.4 9.3
18-25 years old 68 48.6 57.9
26-35 years old 39 27.9 85.7
36-45 years old 20 14.3 100
Total 140 100
B. Gender
Male 51 36.4 36.4
Female 89 63.6 100
Total 140 100
C. Education Level
Diploma 12 8.6 8.6
Undergraduate 63 45 53.6
Senior High School 61 43.6 97.1
Junior High School 4 2.9 100
Total 140 100
D. Income Range
< IDR 1,000,000 33 23.6 23.6
> IDR 50,000,000 8 5.7 29.3
IDR 1,000,000- IDR 9,999,999 75 53.6 82.9
IDR 10,000,000- IDR 24,999,999 12 8.6 91.4
IDR 25,000,000- IDR 49,999,999 12 8.6 100
Total 140 100
E. Occupation
Others 4 2.9 2.9
Student 61 43.6 46.4
Civil Servant 14 10.0 56.4
Private Employee 25 17.9 74.3
Entrepreneur 36 25.7 100
Total 140 100
F. Marriage Status
Unmarried 83 59.3 59.3
Divorced 4 2.9 62.2
Married 53 37.9 100
Total 140 100
G. Purchasing Frequency in grocery online
>3 times 3 2.1 2.1
1 times 14 10 12.1
2 times 2 1.4 13.6
3 times 1 0.7 14.3
No experience yet 120 85.7 100
Total 140 100
Based on marriage status, respondent distribution in this study shows that more than half of total respondent, 59.3%, are respondents with unmarried status. The percentage indicates that most of consumers or visitors of Loka Mart, Malang are unmarried consumers. This highly correlates with the type of the respondents, which are commontly students at university (43.6%).
Data also show that most of respondents are not performed online grocery products yet. Low frequency of online purchasing could indicate that online grocery shopping still not much implemented. In this study, it was found that online grocery shopping is a new way for consumer in Malang.
Instrument Validity and Reliability Validity Test
The validity test showed that the instrument in this study that used for PU (perceived of usefulness), PEOU (perceived ease of use), ATU (attitude
toward usage), BI (behavioral intention), PR (perceived of risk), SI (social influence), and VIS (visibility) variable was significance at level of 95% (0.05). Value for every item that used in this study had significance of 0.000 smaller than its significance value of 0.01 (0.000 < 0.01). The analysis results show that all indicators of those variables were significant and valid to represent the perceived of usefulness, perceived ease of use, attitude toward usage, social influence, and visibility.
Reliability
Reliability from each variable assessed through Cronbach’s Alpha value comparison. Variable states as reliable if it has Cronbach’s Alpha value (α) larger than 0.7 (Pallant, 2001). Based on the result through SPSS analysis, the resuts shows that all variables that used in this study are reliable with Cronbach Alpha value (α) larger (>) than 0.7.
Table 2. Reliability to the Study Variable
Variable PU PEOU ATU BI PR VIS SI
Cronbach's Alpha 0.859 0.801 0.818 0.932 0.786 0.853 0.866
Number of item (n) 4 4 4 4 4 4 4
Explanation reliable reliable reliable reliable Reliable Reliable reliable Source: Primary data analyzed
Classical Assumption Test
Multicollinearity Test
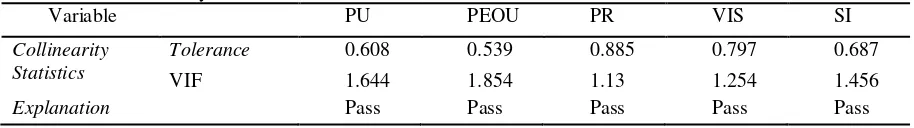
Multicollinearity test can be determined based on VIF (Variance Inflation Factor) and tolerance value. Tolerance value larger than 0.1 (tolerance > 0.1) shows that there is no mullticolinearity, vice versa. If VIF values smaller than 10 (VIF < 10)
then there is no multicollinearity indication, in contrast, if VIF value larger than 10 (VIF > 10) then there is multicollinearity to the study data. This following is statistical analysis result that presents tolerance and VIF value.
Table 3. Multicollinearity test based on tolerance and VIF (Variance Inflation Factor) value
Variable PU PEOU PR VIS SI
Collinearity Statistics
Tolerance 0.608 0.539 0.885 0.797 0.687
VIF 1.644 1.854 1.13 1.254 1.456
Explanation Pass Pass Pass Pass Pass
Source: Processed Primary Data a. Dependent Variable: ATU
Heteroscedasticity Test
In this study, scatterplot graph analysis and Spearman Rank correlation analysis used to test
Figure 1. Scatterplot Graph
Dot distribution in scatterplot graph above shows that the dots scattered with no certain pattern and it is distributed above and under 0 number at Y axis. The dots distribution indicate heteroscedasticity. Besides that, heteroscedasticity test also conducted using Spearman Rank analysis by correlating independent variables (PU, PEOU, SI, PR, VIS)
with residual. The test used significance level of 0.05 with two-tailed test. If the correlation result between independent variable and residual has significance value larger than 0.05 (> 0.05) then the result shows that there is no heteroscedasticity. The result of Spearman Rank test presents on Table 4 below.
Table 4. Spearmans Rank correlation
PU PEOU PR VIS SI
Unstandardized- Res. 0.074 0.072 -0.095 -0.022 0.006
Sig. 0.388 0.398 0.264 0.799 0.948
Source: Processed Primary Data
Statistical analysis result from Spearman Rank correlation showed that correlation value in each independent variable (PU, PEOU, VIS, PR, and SI) with unstandardized residual had significance larger than 0.05 (< 0.05), thus it could be concluded that there was no heteroscedasticity.
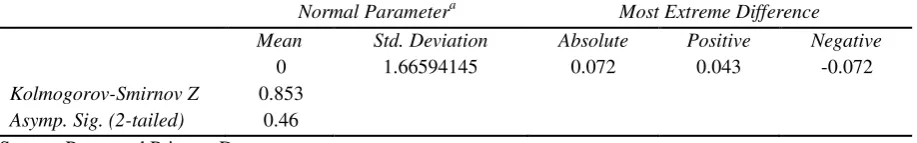
Normality Test
In this study, normality test is conducted by using kolmogorov smirnov statistical analysis. Residual will be distributed normally if significance value from statistical process larger than 0.05 (> 0.05), in contrast, residual will be not distributed normally if significance value from statistical process smaller than 0.05 (< 0.05). Based on analysis result in this
study, it is found that significance value is 0.460, larger than 0.05. Thus, residual data in this normality test distributed normally. This following is kolmogorov smirnov test that presented on Table 5.
Statistical test of online grocery shopping model – Attitude toward Usage
This study uses linear model to identify the influence of perceived of usefulness (PU), perceived ease of use (PEOU), visibility (VIS), perceived of risk (PR), and SI (social influence) to independent variable, which is represented by attitude toward usage (ATU).
Table 5. Kolmogorov Sminorv Test
Normal Parametera Most Extreme Difference
Mean Std. Deviation Absolute Positive Negative
0 1.66594145 0.072 0.043 -0.072
The fit econometric modelling of multiple regression analysis in this study is indicated by F test, T test, and determination coefficient analysis (R square) as result of data analysis. Table 6 shows the results.
Based on computation result that has been obtained, Table 6 shows that the five variables (perceived of usefulness, perceived of risk,
visibility, social influence, and perceived ease of use) toward online grocery shopping acceptance model can explain public acceptance in Malang City. From determination coefficient, it shows that the acceptance of online grocery shopping is explained by those five variables about 60.2% and the remaining of 39.8% is affected by other variables that not studied in the model.
Table 6. Summary of R Model
R R Square Adjusted R Square Std. Error of the Estimate
.776a 0.602 0.587 1.69674
Source: Processed Primary Data
a. Predictor: (Constant), SI, PR, VIS, PU, PEOU b. Dependent Variable: ATU
F-Test Analysis
F-test analysis is used t o identify whether there is at least one variable which has statistically significant influencing acceptance toward online grocery. The result in Table 7 shows the F-statistical test.
The statistical F-test has value of 40.519 and that is higher than the value of F-table for 5% significant level. Therefore, this study has enough evidence that the model is good to explain the
a. Predictor: (Constant), SI, PR, VIS, PU, PEOU b. Dependent Variable: ATU
T-test of the coefficient and the interpretation T-value interpretation can be performed based on comparison of t-statistics and t-table. The rules are: if t-table > t-statistics then hypothesis confirmed; if t-table ≤ t-statistics then hypothesis rejected. T-table in this study with significance of 0.05 (0.05/2 = 0.025) with degree of freedom (df) 134, (n-k-1; 140-5-1=134) obtained t value of 1.656.
The results are shown in Table 8 and can be explained below.
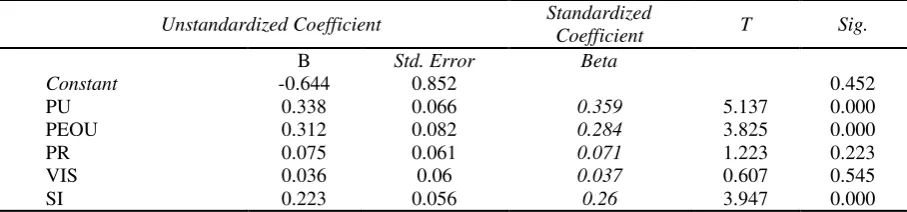
a) Perceived of usefulness (PU)
Multiple regression coefficient value of perceived of usefulness (PU) is positive, which is 0.338. It means that the addition of perceived of usefulness (PU) score, then consumers’ acceptance towards online grocery shopping will be increased significantly by 0.338.
Significant value of the coefficient can be obtained through t-test, which is t-statistics 5.137 greater than 1.65630 (t-statistics > t-table); then, it
can be conclude that perceived of usefulness (PU) variable affect the consumer acceptance of online grocery shopping. Most of respondents have high education background indicated that consumers own better knowledge to recognize the benefit of online grocery shopping. Perceived of usefulness (PU) describes consumer’s opinion that shopping through online grocery shopping can improve their productivity. Shopping activity will be more efficient and saving more times, thus consumers will be able to use their times toward more productive activities. Other opinion about usefulness of online grocery shopping is the ease of shopping for elderly or busy persons.
b) Perceived ease of use (PEOU)
ease of use variable increases consumer acceptance towards online grocery shopping by 0.312.
The coefficient is significant. T-statistics is 3.825, which is greater than 1.65630 t-table. It means that the hypothesis of perceived ease of use affects the consumer acceptance of online grocery significantly. The ease of use perception on online grocery significantly and positively influences the acceptance towards online grocery shopping.
c) Perceived of Risk (PR)
Perceived of risk (PR) variable significantly has no effect to the consumer acceptance of online grocery shopping. It could be determined through t-statistics 1.223 < 1.65630 (t-t-statistics < t-table). It means that hypothesis of perceived of risk variable affects the consumer acceptance of online grocery shopping is rejected. On the other word, perceived of risk does not affect the acceptance on grocery on line.
d) Visibility (VIS) Variable
Visibility variable has no effect to the consumer acceptance of online grocery shopping. It could be determined through t-test. T-statistics is 0.607, which is less than 1.65630 (t statistics < t table). It means that hypothesis of visibility (VIS) affects to the consumer acceptance of online grocery shopping is rejected. Thus, consumers had low visibility to know the adoption of online grocery shopping.
e) Social influence (SI)
Social Influence (SI) variable affected positively and significantly to the consumer acceptance of online grocery shopping. It is determined through probabilistic value of rejected alternative hypothesis, which is 0.000 – less than 0.05, and t-statistics 3.947 > 1.65630 (t t-statistics > t table). It means that hypothesis of social influence (SI), which affects to the consumer acceptance of online grocery shopping is confirmed. Social influence could affect consumers to have positive attitude towards online grocery shopping.
Table 8. T-test analysis
Unstandardized Coefficient Standardized
Coefficient T Sig.
B Std. Error Beta
Constant -0.644 0.852 0.452
PU 0.338 0.066 0.359 5.137 0.000
PEOU 0.312 0.082 0.284 3.825 0.000
PR 0.075 0.061 0.071 1.223 0.223
VIS 0.036 0.06 0.037 0.607 0.545
SI 0.223 0.056 0.26 3.947 0.000
Source: Processed Primary Data *Significance level α = 5%
Statistical test of online grocery shopping model – Behavioral Intention (BI) of Online Grocery Shopping
Based on the analysis, it was found that consumer behavioral intention (BI) to use online grocery shopping in Malang City could be explained by perceived of usefulness (PU) and attitude towards
usage of online grocery shopping (ATU). According to R-square value, there is 59% of those two independent variables explaining the behavioral intention (BI) and the remaining of 41% of other factors affecting BI. Table 9 shows this result regarding R-square value.
Table 9. Summary Model
Model R R Square Adjusted R Square Std. Error of the Estimate
1 .770a .593 .587 2.03308
Source: Primary data analyzed
The other statistica test of this model is test. test is presented in Table 10. It was obtained F-statistics of 99.892. While, F table for α= 5% was
least on of the independent variables PU and/or ATU affect the independent variable BI.
Table 10. ANOVAb
Model Sum of Square df Mean Square F Sig.
1 Regression 825.793 2 412.897 99.892 .000a
Residual 566.280 137 4.133
Total 1392.073 139
Predictor: (Constant), PU, ATU Source: Primary data analyzed
T-test of the coefficient and the interpretation This partial test showed that there was significant effect of PU and ATU to the BI. PU and ATU variable meet significance standard in the multiple regression test with p-value < 0.05 (PU = 0.000; ATU = 0.03). Through regression test, it was found that ATU variable (Beta = 0.659) has larger effect to the BI variable compared to PU variable (Beta = 0.159). Based on the regression test, it was found that respondents who have positive perception
towards online grocery shopping as ease of usage and have positive attitude towards online grocery shopping will have behavioral intention towards online grocery shopping. It means that H1e and H1d confirmed.
Perceived of usefulness (PU) is positive, which is 0.176. It means that by positive value addition of perceived of usefulness (PU) variable. Therefore, the consumer behavior intention toward the online shopping will increase 0.176.
Table 11. Regression Coefficient
Model Unstandardized Coefficients Std. Coefficients t Sig.
B Std. Error Beta
(Constant) 1.256 .701 1.791 .076
ATU .790 .087 .659 9.129 .000
PU .176 .081 .156 2.155 .033
Sourced: Primary data analyzed
Coefficient value of attitude towards usage of online grocery shopping (ATU) is positive, which is 0.790. It means that attitude towards usage of online grocery shopping will affect increasing behavioral intention towards online grocery shopping by 0.790.
Correlation between perceived of usefulness and Perceived Ease of Use
The result of statistical test showed that there is significant relationship between PU variable and
PEOU variable (r = 0.608; p = 0.000) at significance level of 0.01. At confidence level of 99%, Pearson correlation value is positive 0.608. It indicated that correlation between the two variables is linear and has strong correlation (0.608). It means that of consumer perception about ease of use towards online grocery shopping increases; then, perceived of usefulness perception towards online grocery shopping also will increase.
Table 12. Pearson Correlations
PEOU PU Sig. (2-tailed)
PEOU Pearson Correlation 1 .608** 0
PU Pearson Correlation .608** 1 0
Source: Primary data analyzed
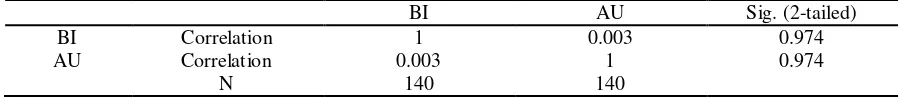
Biserial point correlation between behavioral intention (BI) and actual using (AU) of online grocery shopping
Based on the analysis, the biserial point value does not meet significance level of alpha 5% (< 0.05).
biserial point correlation between behavior intention and actual using.
Table 13. Biserial Point Correlation
BI AU Sig. (2-tailed)
1. Consumer acceptance towards online grocery shopping, as a whole, could be affected by perceived of usefulness (PU), perceived ease of use (PEOU), perceived of risk (PR), visibility (VIS) and social influence (SI) variable for 60%. However, partially, consumer acceptance towards online grocery shopping could be affected only by Perceived of Usefulness (PU), perceived ease of use (PEOU), and social influence (SI) variable. 2. Perceived of usefulness (PU) variable has the
largest effect in increasing consumer acceptance towards online grocery shopping. The higher perceived of usefulness that owned by consumers, the higher consumer acceptance towards online grocery shopping.
3. Perceived ease of use (PEOU) variable has strong relationship with perceived of usefulness (PU) variable towards online grocery shopping. This strong correlation showed that the increasing perception of ease of use (PEOU) could increase perception of usefulness (PU) towards online grocery shopping.
4. Perceived of usefulness (PU) variable and attitude towards usage of online grocery shopping (ATU) variable, in this study, have direct effect to the behavioral intention towards using (BI). Perception of usefulness (PU) towards online grocery shopping and positive attitude/acceptance (ATU) towards online grocery shopping could increase consumer behavior to have behavioral intention towards online grocery shopping.
5. Consumer behavioral intention towards online grocery shopping (BI) had no effect to the actual using (AU). It was due to low frequency
of consumer purchasing in Malang City in which it could be caused by the fact that online grocery shopping is still a new format and not much implemented by retailers in Malang City.
Suggestions
Based on the study result, there are many recommendations that can be implemented by retailers or online grocers, especially Loka Mart Malang, to develop online grocery shopping system in Malang City:
1. There are many factors considered to increase consumer acceptance towards online grocery shopping in Malang City such as facility availability through internet application in which platform/online shopping application should be applicative, which is easy to use and give usefulness for consumers.
2. Marketing strategy can be developed to increase positive attitude of consumers towards online grocery shopping. It can be conducted by the development of social influence to introduce online grocery shopping adoption. Social influence, positively, can affect people to use online grocery shopping. This social influence can be studied through influence that given by other who has good reputation in a social environment such as public figure, leader, or community that have potential to influence people around.
REFERENCES
Kurnia, Sherah dan A.W.J.Chien. 2003. The Acceptance of Online grocery Shopping. Department of Information Sistem: Melbourne University Australia
Penim, J, M, C, D,S.2013. Online grocery Shopping: An exploratory study of consumer decision making processes. Thesis. Master in Business Administration - Major in Marketing: Catolica Lisbon
Grewal, Dhruv., G, R, Iyer dan M, Levy 2004. Internet retailing enablers, limiters and market consequences. Journal of bussines Study, 57(7), 703-713
Benn, Yael., T.L Webb., B. P. I. Chang dan J. Reidy. 2015.What Information do Consumer Consider, and How They look it When
Shopping Groceries ?.Appetite:Elsevier publication. 265-273
Siddiqqui, Kamran. 2013. Heuristic for sample determination in multivariate Statistical Techniques. World Applied Sciences Journal. Suffa University, Karachi, Pakistan: IDOSI Publications. 27 (2): 285-287
Li Guo. 2011. A Study on Influencing Factors of Consumer Purchasing Behaviors in Cyberspace. International Journal of Marketing Studies (3-3): School of Management Xi’an University of Science and Technology Xi’an, China E