TOWARDS AUTOMATIC INDOOR RECONSTRUCTION OF CLUTTERED BUILDING
ROOMS FROM POINT CLOUDS
M. Previtali a , L. Barazzetti a, R. Brumana a, M. Scaioni b a
Politecnico di Milano, Department of Architecture, Built Environment and Construction Engineering Via G. Ponzio 31, Milano, Italy – [mattia.previtali, luigi.barazzetti, raffaella.brumana]@polimi.it b
Tongji University, College of Surveying and Geo-Informatics, 1239 Siping Road, 200092 Shanghai, P.R. China [email protected]
Commission V, WG 3
KEY WORDS: Indoor Reconstruction, Laser scanning, Point cloud, Segmentation
ABSTRACT:
Terrestrial laser scanning is increasingly used in architecture and building engineering for as-built modelling of large and medium size civil structures. However, raw point clouds derived from laser scanning survey are generally not directly ready for generation of such models. A manual modelling phase has to be undertaken to edit and complete 3D models, which may cover indoor or outdoor environments. This paper presents an automated procedure to turn raw point clouds into semantically-enriched models of building interiors. The developed method mainly copes with a geometric complexity typical of indoor scenes with prevalence of planar surfaces, such as walls, floors and ceilings. A characteristic aspect of indoor modelling is the large amount of clutter and occlusion that may characterize any point clouds. For this reason the developed reconstruction pipeline was designed to recover and complete missing parts in a plausible way. The accuracy of the presented method was evaluated against traditional manual modelling and showed comparable results.
1. INTRODUCTION
In the last years a great attention has been paid to the development of automated techniques for generation of as-built building models starting from point clouds acquired by Terrestrial Laser Scanners (TLS), see Pu et al., (2011), Haala and Kada (2010), and Remondino (2011). Indeed, the demand for indoor modelling is largely increasing for different purposes (scheduled maintenance, preservation and documentation, facility management, security, feeding Building Information Models). In conjunction, the increase in the automation of acquisition and registration of laser scans, along with a reduction of the instrumental cost, has allowed a larger number of operators to widely use this surveying methodology. However, once laser point clouds are acquired and aligned, the process of turning them into a vector model is still largely based on the manual modelling of each architectural element. To improve this aspect, automation in the reconstruction pipeline is essential to speed up the processing workflow and to preserve the economic sustainability of the project. In addition, an important transition to Building Information Modelling (BIM) is taking place in the Architecture, Engineering, and Construction domain (AEC – Azhar, 2011). Indeed, in a BIM model not only the geometric aspects are considered, but also semantic information can be included for a deeper understanding of existing buildings. Thus, an automated methodology for geometric modelling should present interoperability with BIM domain. However, the lack of automated approaches to understand the indoor building structures captured in raw data is still underlined in the AEC (Okron et al., 2010).
The automatic reconstruction of building models has been mostly restricted to building outer envelope, while so far lower interest was paid to indoor modelling. The automatic reconstruction of buildings’ exterior shares many properties (and problems) with the issues associated with indoor
modelling. However, they generally operate under the assumption that the surface being modelled is relatively free from obstructions. Even if this may be a reasonable pre-requisite for outdoor scanning, in indoor environments objects like pieces of furniture and wall-hangings frequently may occlude the wall surfaces, making the modelling problem much more challenging.
This paper presents an automatic method for modelling predominantly planar indoor environment on the basis of TLS data. This topic can be addressed as automatic indoor reconstruction (AIR). The presented methodology aims at generating reliable models despite of the presence of significant amounts of clutter and occlusion, which frequently occur in building indoor. In particular, gaps in the input data can be recognized and filled by detecting occluded regions and by modelling windows or door openings. First, surfaces representing the room walls, ceiling and floor are extracted in robust way. Then, to understand the nature of occlusions, a ray-tracing algorithm is used to identify regions that are occluded from every viewpoint and to distinguish these regions from openings in the surface (e.g., due to doorways or windows). The most experiences reported in the literature (see Subsect. 1.2) concern the use of static TLS, but the recent improvements in the indoor mobile mapping systems are opening new great possibilities to this field (Biswas and Veloso, 2011). Although mobile systems are expected to offer a lower precision, they may offer a higher productivity fostering real word applications. Also it should be mentioned that other data sources than laser scanning have to be carefully considered in the close future to provide point clouds useful for indoor modelling: photogrammetry, low-cost 3D imaging systems (including gaming devices), triangulation scanners, and mobile-phone 3D scanners. However, in those cases the data precision and resolution may be lower than with static TLS.
The structure of the paper is organized as follows. Section 2 gives an outlook on the entire modelling approach. Section 3 ISPRS Annals of the Photogrammetry, Remote Sensing and Spatial Information Sciences, Volume II-5, 2014
focuses on the extraction of the contour of ground plane, which in the most inner rooms also allows modelling the vertical walls, with the exception of doors and windows. The possible presence of occlusions and window/door detection is dealt with in Section 4. Section 5 reports some examples of applications to real case studies Finally, Section 6 draws some conclusions.
1.2 Related work
Several methods have been proposed in the recent literature for production of building façades models by using TLS (Pu and Vosselman, 2009; Ripperda and Brenner, 2009). These approaches operate under the assumption that the surface being modelled is relatively unobstructed. Whether this may be a reasonable assumption for outdoor scanning, in indoor environments generally some pieces of furniture may generate occlusions. For façade modelling, in the case of occlusions model-based approaches are used (Becker, 2009; Koutsourakis et al., 2009). In particular, they assume that the occluded region is part of a repeated pattern and a top-down processing is used to predict these patterns and to replace pending data (see Previtali et al., 2013b). However, in the case of interior modelling, repetitive patterns of walls and windows are more unlikely to be identified and ad-hoc algorithms robust to clutter are needed.
Currently, model reconstruction and visualization of generic indoor scenes is still a difficult task (Furukawa et al., 2009). In fact, the reconstruction of interiors is mostly performed by using interactive or semi-automatic approaches (Cyclone®, Pointools®,…). Many researchers have studied the problem of building interior reconstruction using laser scanning data (El-Hakim et al., 1997; Hahnel et al., 2003; Thrun et al., 2004; Budroni and Boehm, 2005; Okron et al., 2010; Adan and Huber, 2011). For some works the emphasis was given on creating visually realistic models rather than geometrically accurate ones (e.g., El-Hakim et al., 1997). Many authors used TLS data to construct detailed models of walls. Thrun et al. (2004) developed a plane extraction method based on the ‘expectation– maximization’ algorithm, while Hahnel et al. (2003) used a ‘plane sweep’ approach to find planar regions. However, even if these algorithms work well for extracting planar patches from the laser data, they do not explicitly recognize the semantic identity of any components, namely walls, ceilings, and floors. In addition, several works (Hahnel et al., 2003; Thrun et al., 2004, Budroni and Böhm 2005) do not consider the occlusion problem because they focused on modelling of hallways with no furniture or other potentially occluding objects. The problem of detecting doors is specifically addressed in Díaz-Vilariño et al. (2014), who makes integrated use of TLS and image data. ‘Context-based’ building modelling was studied by Cantzler (2003), Nüchter and Hertzberg (2008), and Rusu et al. (2008). These approaches rely on hand-coded rules. Recently, Koppula et al. (2011) used a graphical model to represent contextual relationships for recognizing objects in indoor scenes using 3D+colour images (RGBD) from a Microsoft Kinect® sensor (Zhang, 2012). However, defined rules are usually brittle and break down in the case of noisy measurements or significant lack in the data.
A very specific area of indoor modelling, which has been the topic of intense efforts towards automation, is the reconstruction of industrial environments. These scenes are characterized by repetitive elements such as beams or pipes. Current state of the art in commercial reconstruction tools is manual pre-segmentation in combination with automated model fitting (Rabbani et al., 2007).
2. INDOOR RECONSTRUCTION OVERVIEW
The developed methodology for automatic indoor reconstruction (AIR) takes as input a set of registered scans with a known ‘up’ direction and the location of the scanner in the room. All these prerequisites can be easily obtained in the practice. Indeed, scan registration is a well-studied problem, and methods to manually or automatically register scans are available both in scientific and commercial software packages, see a review in Previtali et al. (2014).
Moreover, the alignment of the vertical axis of ground reference system (GRS) along the plumb line, that is also the direction of walls, can be easily obtained by levelling one station taken as reference. Moreover, due to the limited vertical extension of walls and the 1-2 centimetre precision required in AIR, such procedure may suffice. Alternatively, if the vertical direction is unknown, the orientation can be estimated using statistics on data. For example, a room usually is schematically represented by two large parallel, continuous planes (floor and ceiling), and by at least four walls which are vertical smaller planes. These simple considerations may be exploited to detect which planes represent walls and the orthogonal direction to the floor/ceiling can be used to establish the ‘up’ direction. Of course there may be a few exceptions to these rules, especially in historical and special buildings (e.g., industrial, military, facility management buildings). On the other hand, the proposed procedure is focusing on modelling common rooms in modern constructions, which represent the large majority of the cases. For efficiency, the algorithm operates independently on each room. In the case one would like to link together more rooms, standard techniques used in surveying and laser scanning practice have to be implemented.
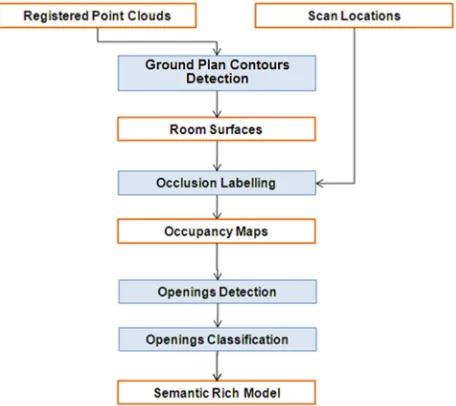
The first step in the presented approach (Fig. 1) is detection and estimate of the surfaces to be modelled, i.e., walls, ceiling and floor.
Figure 1. Workflow of the developed methods for automatic indoor modelling (AIR) of building rooms.
However, due to occlusions and clutter some walls may be missing in the data set. For this reason an automatic procedure is implemented to complete missing elements in a plausible way. To achieve this, the developed algorithm incorporates some architectural priors on indoor scenes, notably the ISPRS Annals of the Photogrammetry, Remote Sensing and Spatial Information Sciences, Volume II-5, 2014
prevalence of orthogonal intersections between walls. Such scenes are addressed as ‘Legoland’ scenes in Förstner (2010). Once the surfaces describing the room are defined, the remaining steps operate on each region individually. In the second phase, each planar surface is analysed to identify and model the occluded regions and openings by using a ray-tracing algorithm. Openings in the data are detected by using labelling information while contemporarily a further classification is performed to take apart windows and doors. Finally, occluded regions are completed in a realistic way.
The output consists of a set of labelled planar patches (walls, floor, and ceiling), adjacency maps indicating which patches are connected to one another, and a set of openings detected within each planar surface. These patches are intersected with one another to form a simple surface-based model of the room. The geometric models of the room, along with any semantic information, may be combined together to derive a semantically enriched mode of the room in CityGML and/or IFC format (Gröger and Plümer, 2012).
3. GROUND PLAN CONTOUR DETECTION
The first step of the reconstruction process is the detection of ground plan contours. The general workflow is presented in Figure 2. First, surfaces (walls, roof and ceiling) which constitute the ‘box’ of the room to be modelled are detected. This stage is accomplished by using the segmentation strategy described in Previtali et al. (2013a). However, scan segmentation based on range images techniques can also be used (Zeiback and Filin, 2007; Kang et al., 2013).
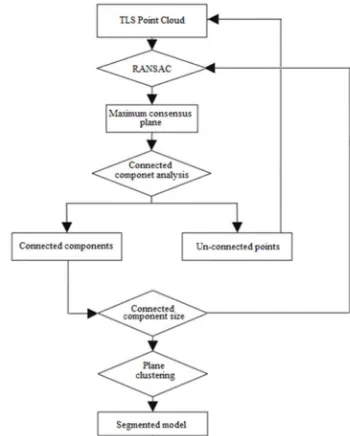
Figure 2. Pipeline for ground plan contour detection.
The workflow of the segmentation strategy is presented in Figure 3. In this implementation major attention was paid to the reduction of so called ‘bad-segmentation’ problems. Indeed, spurious results may be due to the fact that points constituting the maximum consensus to RANSAC planes may be derived from different objects. The developed strategy tries to minimize this problem by including topology information in the process. Indeed, points belonging to the same object should be sufficiently close while groups of points belonging to different objects should have a gap area. For this reason, a topology measure is introduced in the segmentation process by identifying objects corresponding to a single objects of interest. Similarly, once all objects are detected, over-segmented parts are combined together considering topology properties of the
extracted planes (i.e., similarity of normal vectors, perpendicular distance between planes and intersection of planes).
Once the point cloud segments have been detected, a first semantic classification is done to detect roof and ceiling. Indeed, by analysing the detected segments, the ceiling can be identified as the non-vertical plane having the lower height. Conversely the roof is detected as the non-vertical plane located at the highest level. In this way, the distance from ceiling to roof can be also worked out (Fig. 4a).
Figure 3. Workflow of developed segmentation procedure.
At this stage the floor plan of the room has to be determined. To this end, the walls of the room need to be detected. However, this problem is made more difficult due to possible clutter and occlusions. Some walls may have not been sensed by laser scanner and may miss in the point cloud. For this reason, a proper completion is necessary to reconstruct in a plausible way these pending walls (Fig. 4b). A first rough floor plan of the room can be obtained by projecting the points belonging to the ceiling onto a horizontal plane. Indeed, the acquisition of the ceiling surface, due to its location, is generally less influenced by clutter and occlusion than other surfaces in the room. Usually rooms with a standard usage feature a relatively large free area on the floor surface for walking and moving around. The horizontal plane is discretized into cells of size β x β. The cell size β is set equal to the mean sampling resolution in the point cloud. Then a binary occupancy raster map (BORM) is generated where pixels having value one represent cells where TLS data are available, while zero value pixels are cells with no data. Starting from this binary image it is possible to derive pixels representing the boundary of ‘occupied’ cells which represent a first rough floor plan. Due to possible occlusions, such plan may contain some spurious boundaries, i.e., the ones not associated to a wall (Fig. 4c). To validate the obtained boundaries a check is done against the segmentation results. In particular, only vertical segments falling inside the cells labelled as boundary are considered as real wall surfaces (Fig. 4d). In indoor modelling applications, a single missing small wall may jeopardize the entire reconstruction of the floor plan. In the developed strategy, such gaps are filled by incorporating additional, unseen ‘pending’ walls (Chauve at al., 2010). ISPRS Annals of the Photogrammetry, Remote Sensing and Spatial Information Sciences, Volume II-5, 2014
Indeed, it can be observed that generally walls are mutually perpendicular in indoor environments. For this reason ‘pending’ walls are guessed as orthogonal to the detected walls and are added from the boundary of the detected ones (Fig. 5a). To obtain a continuous floor plan from ‘detected’ and ‘pending’ walls, a procedure based on cell complex labelling is applied. As a first step a 2D arrangement (Edelsbrunner et al., 1986) is set up by using both ‘detected’ and ‘pending’ walls. The arrangement generates a partitioning of the original space domain into convex polygonal cells (Fig. 5b). Once having derived the cell complex, the floor plan reconstruction problem can be formulated as an optimal binary labelling of cells in the complex. Each cell is labelled as ‘empty’ or ‘occupied,’ and the floor plan can be extracted as the union of all facets separating an occupied cell from an ‘empty’ one, obtaining this way an intersection-free boundary. This labelling problem is handled within the framework of minimum s-t cut (Reif, 1983) on the cell-adjacency graph G = (V,E) of the partitioning, where the vertices V are the cells of the polygonal cell complex and the edges E link adjacent cells, i.e., they correspond to the facets of the complex.
a. b.
c. d.
Figure 4. Detection of room surface for ‘Classroom’ data set: (a) detected ceiling and floor; (b) some wall portions are missing (in red circles) due to occlusions; (c) binary occupancy raster map of the ceiling with walls (green segments) and spurious boundaries (red segments); and (d) detected wall surfaces.
Starting from the available data, some cells can be directly categorized as ‘occupied’. In particular, all cells occupied by points belonging to the ceiling can be directly assigned to set T. In a similar way, cells bordering an ‘occupied’ cell and separated from it by a detected wall segment are set as empty. For this reason, the weights of edges joining the ‘sink’ (t) to cells labelled as ‘occupied’ are set to infinite value and, in a similar way, edges joining the ‘source’ (s) to ‘empty’ cells are set to infinite. Then, the weights of edges between two ‘occupied’ cells and between two ‘empty’ cells are set to infinite and weights of edges connecting an ‘empty’ and an ‘occupied’ cell are set to zero. In this way, it is prevented that
cells forming the inner part of the room might be erroneously labelled as ‘empty’ or vice-versa (Fig. 5c). For all other cells an equal unary weight is associated to edges joining the cells to the ‘source’ and to the ‘sink’ because there is no a priori knowledge about the occupancy of the cell. Weights of remaining edges between cells are fixed equal to the length of the edge between the cells. This means that the s–t cut problem is aimed at minimizing the length of guessed walls segments (Fig. 5d). To perform s–t cut, the Kolmogorov’s max-flow algorithm is used (Boykov and Kolmogorov, 2004). Once having computed the S-T partitioning, the boundary of the ‘occupied’ cells of the polygon partition gives the floor plan. Finally, having obtained the floor plan and having previously defined the ceiling-floor distance, the surfaces constituting the room can be reconstructed with easy.
a. b.
c. d.
Figure 5. Cell complex construction and labelling for ‘Classroom’ data set: (a) detected primitives with ‘pending’ walls; (b) induced cell complex; initial (c) and final (d) labelling of the cell complex.
4. OCCLUSION LABELLING
Once all surfaces of the room’s ‘box’ are detected, openings are looking for. Detection of the boundaries of openings, such as windows or doors in a wall, is usually a complex task. While in façade reconstruction applications windows are generally detected as holes in the point cloud, this assumption does not generally hold for indoor environments. Indeed, also occlusions and clutter produce significant holes in the point cloud which have to be distinguished from real openings. To this end an occupancy analysis is accomplished. The developed method is based on ray-tracing labelling and BORM generation (Adan and Huber, 2011). The occupancy of the scanned space could also be done by using the Dempster-Shafer theory of evidence (Shafer, 1976). In this case the spatial occupancy is represented by so-called belief masses describing the state of the space (e.g., ‘empty’ or ‘occupied’) in the nearby of a point p. However, definition of proper belief masses relies, in general, on a series of parameters (Hebel et al, 2013), which may be difficult to set up. In order to cope with this limitation a simpler approach based on a few and intuitive parameters was designed.
In this step each surface is separately processed. Once having previously defined the wall surface, points representing inliers ISPRS Annals of the Photogrammetry, Remote Sensing and Spatial Information Sciences, Volume II-5, 2014
for the plane under analysis can be easily recognized. The detected plane is then discretized into cells of size β x β and then a BORM (denoted as M0) is generated on the basis on
whether inlier points are detected at each pixel location or not. Without additional information, it is not possible to distinguish between a pixel that is truly empty and one that is merely occluded. This problem can be overcome by using a ray-tracing labelling to detect occlusions between the sensor and the surface being modelled. For this reason the scanning locations (position and attitude) should be known in advance.
4.1 Ray-tracing labelling
Let S = {S1,S2,…,Sn} be the set of n scan standpoints for the
room to be modelled. For each scan position Sk, a labelling Lk is
generated by tracing a ray from the scan location to each pixel Pi(X,Y,Z) labelled as ‘empty’ in M0. The knowledge of the
rotation matrix Rk and the position vector Tk of the generic
standpoint Sk can be exploited to compute the coordinates of
any points Pi in the intrinsic reference system (IRS) of the
instrument:
xIRS RTk Xi-Tk (1)
Then from vector xIRSthe spherical coordinates (range d, vertical angle α, horizontal angle θ) can be derived. Relation between cartesian and spherical coordinates is as follows:
∙ cos ∙ cos cos ∙ sin
sin (2)
Having defined the cell location in spherical coordinates, the 20-nearest neighbour points (Samet, 2006) for Pi can be easily
defined. As a measuring distance between Pi and other points, θ
and α angles are used. In the case the 20-nearest neighbour points have angular distance (θ, α) far larger than the predefined angular scanning resolution, this would mean that no reflected signal come to the laser scanner due to the presence of an opening. In this case the pixel Pi is labelled as ‘empty.’
Figure 6. Ray-tracing labelling principle: point P is marked as occluded because its nearest neighbour points (green points) have a shorter distance from scanner.
Conversely, if the angular distance is compatible with the predefined scanning resolution, the mean distance of the nearest neighbours is evaluated dmean = mean (d1,d2,... d20), see also Fig.
6. In particular, in the case the mean distance is lower than Pi
distance, this would mean that Pi is occluded by some points in
the scan and the cell is consequently labelled.
On the other hand if the mean distance is larger than Pi distance,
the cell is labelled as ‘empty.’ After ray-tracing labelling for any scans, K labels for each pixel are obtained (Fig. 7). Then all the labels are combined in a final occupancy map LF adopting
the following labelling rule:
occluded i
L K j occluded i
L and empty i L
If 0()= j()= ,∀ =1,2,..., => F()=
In other words, a cell is considered as ‘occluded’ if it is occluded in any scans.
Having obtained the BORM, openings can be easily detected by identifying the labels of the cells.
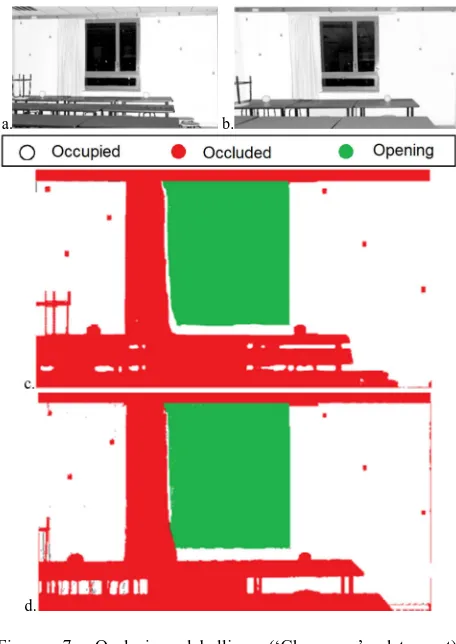
a. b.
c.
d.
Figure 7. Occlusion labelling (‘Classroom’ data set). Reflectance images of Scan 1 (a) and Scan 2 (b) used to model the wall; cell labelling for Scan 1 (c) and Scan 2 (d).
4.2 Classification of openings into windows and doors
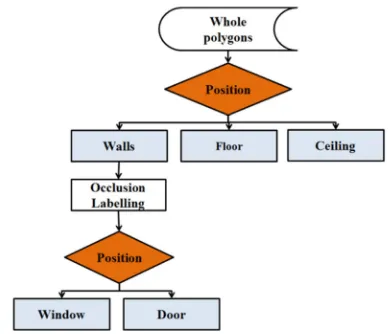
A procedure similar to the one described in Previtali et. al. (2013a) for building outdoors is used to perform classification of openings into windows and doors and to identify their shape. In particular a hierarchical classification tree is used (Fig. 8). Openings are classified as doors when they intersect with ground floor.
Once the raw shape of the openings is determined priors on indoor architecture are added to generate the room model. In particular, the prevalence in building rooms of straight lines and orthogonal intersection is exploited to add additional constrain to enforce the modelling process.
Figure 8. Hierarchical classification tree, orange diamonds are conditions while blue rectangles represent room elements.
5. APPLICATIONS AND ACCURACY EVALUATION
The procedure for indoor modelling was tested with data sets featuring different characteristics in terms of room geometry and data density. Two examples are illustrated here to present the main advantages and disadvantages of this method in real applications.
The results achieved by the proposed approach were checked in order to quantify the geometric accuracy of the obtained vector models. In order to do that a manual reconstruction from the same data set was performed. In the literature this is considered as the most precise method to extract a vector model from a point cloud (Nex and Rinaudo, 2009). For this reason, an experienced operator performed the segmentation of the building room starting from the point cloud. ‘Manual’ models were then compared with the automatically generated ones. In particular, the detected breaklines were compared to ‘manual’ benchmarking models. First, the accuracy of the reconstructed edges was derived by comparing the ground truth position of each line with the position estimated by the automatic algorithm. In particular, for each edge the absolute modelling error is defined as the absolute magnitude of the difference between the ground truth and the model position. An edge is considered as correctly detected if the distance between the manually generated edge and the closest automatically generated edge is lower than a predefined threshold T. Then the reliability of reconstructed edges is evaluated by comparing the number of commission and omission errors. In particular, a commission (or I Type) error is defined as the probability of erroneously detecting an edge. It is evaluated as the ratio between the number of wrong breaklines and the total number of real ones. Conversely, an omission (or II Type) error is defined as the probability that a real edge is undetected. It is evaluated as the ratio between undetected edges and the total number of existing ones.
5.1 ‘Classroom’ data set
The first test consists in the modelling of a university classroom. The dimensions of the room are 8 m × 4.5 m × 3 m. Two scans were acquired inside the room, each consisting of approx. 28 million points. A FARO-FOCUS 3D laser scanner (www.faro.com) was adopted, which is based on the phase-shift principle for range measurement. This data set presents significant occlusions and clutter due to the presence of the
teacher desk and many tables and seats for students in the classroom. In addition, a recess of the room is partially occluded by another tiny wall.
The first step for AIR is the segmentation of the point cloud. Parameters in Table 1 were used.
RANSAC plane threshold ε 1 cm
RANSAC normal threshold α 20 °
Bitmap cell size β 1 cm
Bitmap cell size for wall detection 5 cm
Table 1. Parameters used for indoor modelling of both data sets (‘Classroom’ and ‘Office’).
In Figure 4 segmentation results are presented and distinction between room elements (floor, ceiling and walls) is shown. Once having defined the detected wall surfaces, ghost primitives are added and the complex arrangement is set up (Fig. 5). Finally, occupancy maps are generated for all the detected wall surfaces. The obtained room model is presented in Figure 9a-d while results of the geometric accuracy of the model are presented in Figure 10. As expected, the number of correctly detected edges decreases as the tolerance increases. However, this decrease presents a significant discontinuity in correspondence of T = 4.0 mm. This means that the accuracy of the detected edge is about this magnitude. However, an important element needs to be observed. Manual modelling of a point cloud is indeed influenced by human interpretation and the definition of breaklines with accuracy higher than 2.0-3.0 mm is almost impossible also for a skilled operator.
a. b.
c. d.
Figure 9. Geometric reconstruction of ‘Classroom’ data set: (a) room model with overlaid the original point cloud; (b) wireframe model of the reconstructed room; (c-d) final 3D room model from two different viewpoints.
Figure 10. Accuracy evaluation of edge segmentation results for the ‘Classroom’ data set.
5.2 ‘Office’ data set
The second example consists in the modelling of an office room characterized by having a complex ground plane contour. The room is approximately 12 m×8.5 m×3 m. In this case three scans were acquired with a FARO-FOCUS 3D laser scanner. In this case, the average number of points per each scans consisted of approx. 44 million points. The same segmentation parameters adopted in the previous example have been used here (see Table 1). In Figure 11 a summary of the main processing step for the ‘Office’ data set are shown.
a. b.
c. d.
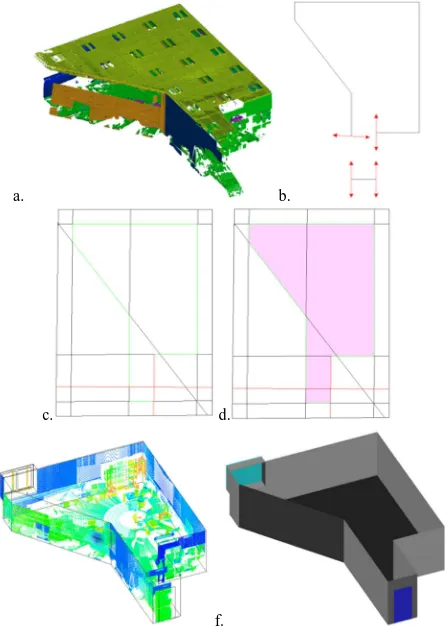
e. f.
Figure 11. Geometric reconstruction of ‘Office’ data set: (a) segmentation results; (b) detected primitives with ‘pending’ walls; (c) induced cell complex; (d) final ray-tracing labelling; (e) wireframe model with overlaid the original point cloud; and (f) final 3D model.
Also in this case, it can be noticed that the accuracy of the wall and opening boundaries is similar to the one obtainable with manual modelling of the point cloud, confirming the quality of results obtained in the first example (Fig. 12).
Figure 12. Accuracy evaluation of edge segmentation results for the ‘Office’ data set.
6. CONCLUSIONS
In the last years, indoor reconstruction of existing buildings has been attracting more and more interest in the architectural and building engineering domain. Terrestrial laser scanning proved to be an adequate technique for a fast and reliable acquisition of primary data. However, the processing workflow to derive the final building model from the original point cloud has been a time consuming and fully manual procedure up until now. This paper presented a robust method for automatic reconstruction of the interior architecture of room buildings (automatic indoor modelling – AIR).
Given a point cloud of the building indoor and the scan locations, the overall shape of the room is reconstructed as a 3D model provided in CAD format. During the processing a recognition step is also performed between room objects allowing a semantic representation of the entire room, to be possibly exported in IFC and CityGML formats. This option will allow importing the reconstructed semantically-enriched model into Building Information Model (BIM).
Experiments with a couple of real data sets demonstrated that this method could work well despite the high levels of clutter and missing data in the point clouds. The geometric accuracy of the derived models can be considered as comparable with the one obtainable in a standard fully manual processing workflow. A major limitation to the full optimization of the method is due to the Legoland-world domain assumption. Because of such assumption, walls, which build up the room volume are assumed as rectangular. However, more complex room geometries such as curved surfaces or triangular walls (such in the case of lofts) may occur in scanning indoor environments. In addition, also ‘pending’ walls are assumed intersecting in an orthogonal way with respect to detected wall surfaces. However, this assumption has no general validity and in some situations obtained ground plan contours may significantly differ from the actual one. However, the most rooms in modern buildings follow the simple model that is considered in this research. Thus the described method is expected to work well in a large number of cases.
Future development will consider the integration into this procedure of other types of data sources, like point clouds coming from photogrammetric processing, triangulation scanner and indoor Mobile Mapping Systems. The use of these sensors may need a partially modified approach, for example to apply the ray-tracing labelling adopted to discriminate for occlusions. Mutual integration of more independent room interior models ISPRS Annals of the Photogrammetry, Remote Sensing and Spatial Information Sciences, Volume II-5, 2014
and indoor-outdoor modelling are other aspects that would deserve more investigation considering the relevance of these issues for data integration into BIM’s.
Acknowledgements
Funding was partially provided by National Key Basic 973 Research Program of China (Id 2013CB733204).
7. REFERENCES
Adan A. and Huber D., 2011, 3D reconstruction of interior wall surfaces under occlusion and clutter. In 3D Imaging, Modeling, Processing, Visualization and Transmission (3DIMPVT), 2011 International Conference on (pp. 275-281). IEEE.
Azhar, S., 2011, Building information modeling (BIM): Trends, benefits, risks, and challenges for the AEC industry. Leadership and Management in Engineering 11, no. 3 (2011): 241-252.
Becker S., 2009, Generation and application of rules for quality dependent façade reconstruction. ISPRS Journal of Photogrammetry and Remote Sensing 64 (6), 640 - 653.
Biswas J. and Veloso M., 2011, Depth camera based localization and navigation for indoor mobile robots. Robotics and Automation (ICRA), 2012 IEEE, International Conference, pp. 1697-1702.
Boykov Y. and Kolmogorov V., 2004, An experimental comparison of min-cut/max-flow algorithms for energy minimization in vision. Pattern Analysis and Machine Intelligence, IEEE Transactions on, 26(9), 1124-1137.
Budroni A. and Böhm J., 2009, Toward automatic reconstruction of interiors from laser data. Proceedings of Virtual Reconstruction and Visualization of Complex Architectures (3D-Arch).
Cantzler H., 2003, Improving Architectural 3D Reconstruction by Constrained Modelling, College of Science and Engineering. School of Informatics, University of Edinburgh, PhD Edinburgh.
Chauve A. L., Labatut P., Pons J. P., 2010, Robust piecewise-planar 3D reconstruction and completion from large-scale unstructured point data. In: Proc. Conf. on Computer Vision and Pattern Recognition (CVPR10), pp. 1261-1268.
Díaz-Vilariño, L., Martínez-Sánchez, J., Lagüela, S., Armesto, J. and K. Khoshelham, 2014. Door recognition in cluttered building interiors using imagery and LiDAR data. Int. Arch. Photogramm. Remote Sens. Spatial Inf. Sci., XL-5, 7 pages.
Edelsbrunner H., O'Rourke J., Seidel R., 1986, Constructing arrangements of lines and hyperplanes with applications. SIAM Journal on Computing, 15(2), 341-363.
El-Hakim S. F., Boulanger P., Blais F., Beraldin J. A., 1997, July. System for indoor 3D mapping and virtual environments. In Optical Science, Engineering and Instrumentation'97 (pp. 21-35). International Society for Optics and Photonics.
Förstner W., 2010, Optimal vanishing point detection and rotation estimation of single images from a legoland scene. In Int. Archives Photogrammetry, Remote Sens. Spatial Inf. Sci, 38, (Part 3A), pp. 157-162. 2010.
Furukawa Y., Curless B., Seitz S. M., Szeliski R. 2009, Reconstructing building interiors from images. In Computer Vision, 2009 IEEE 12th International Conference on (pp. 80-87). IEEE.
Gröger G. and Plümer L., 2012, CityGML–Interoperable semantic 3D city models, ISPRS Journal of Photogrammetry and Remote Sensing, 71, 12-33.
Haala N. and Kada, M., 2010, An update on automatic 3D building reconstruction. ISPRS Journal of Photogrammetry and Remote Sensing, 65(6), 570-580.
Hähnel D., Burgard W., Thrun S., 2003, Learning compact 3D models of indoor and outdoor environments with a mobile robot. Robotics and Autonomous Systems, 44(1), 15-27.
Hebel M., Arens M., Stilla U., 2013, Change detection in urban areas by object-based analysis and on-the-fly comparison of multi-view ALS
data. ISPRS Journal of Photogrammetry and Remote Sensing, 86, 52-64.
Kang Z., Zhang L., Yue H., Lindenbergh R., 2013, Range Image Techniques for Fast Detection and Quantification of Changes in Repeatedly Scanned Buildings. Photogrammetric Engineering and Remote Sensing, 79(8), 695-707.
Koppula H. S., Anand A., Joachims T., Saxena A., 2011, Semantic labeling of 3d point clouds for indoor scenes. In Advances in Neural Information Processing Systems (pp. 244-252).
Koutsourakis P., Simon L., Teboul O., Tziritas G., Paragios N., 2009, Single view reconstruction using shape grammars for urban environments. In Computer Vision, 2009 IEEE 12th International Conference on (pp. 1795-1802). IEEE.
Nex F. and Rinaudo F., 2009, New integration approach of Photogrammetric and LIDAR techniques for architectural surveys. Int. Archives Photogrammetry, Remote Sens. Spatial Inf. Sci, 38, 3 Nüchter A. and Hertzberg J., 2008, Towards semantic maps for mobile robots. Robotics and Autonomous Systems, 56(11), 915-926.
Okorn B., Xiong X., Akinci B., Huber D., 2010, Toward automated modeling of floor plans. In Proceedings of the Symposium on 3D Data Processing, Visualization and Transmission (Vol. 2).
Previtali M., Barazzetti L., Brumana R., Cuca B., Oreni D., Roncoroni F., and Scaioni M., 2013a, Automatic façade segmentation for thermal retrofit. Int. Arch. Photogramm. Remote Sens. Spatial Inf. Sci., XL-5/W1, 197-204.
Previtali, M., Scaioni, M., Barazzetti, L., Brumana, R., and Roncoroni, F., 2013b, Automated detection of repeated structures in building facades. ISPRS Ann. Photogramm. Remote Sens. Spatial Inf. Sci., II-5/W2, 241-246.
Previtali M., Barazzetti L., Brumana R., and M. Scaioni, 2014. Laser Scan Registration Using Planar Features. Int. Arch. Photogramm. Remote Sens. Spatial Inf. Sci., XL-5, 8 pages.
Pu S. and Vosselman G., 2009, Knowledge based reconstruction of building models from terrestrial laser scanning data. ISPRS Journal of Photogrammetry and Remote Sensing, 64(6), 575-584.
Pu S., Rutzinger M., Vosselman G., Oude Elberink, S., 2011, Recognizing basic structures from mobile laser scanning data for road inventory studies. ISPRS Journal of Photogrammetry and Remote Sensing, 66(6), S28-S39.
Rabbani T., Dijkman S., van den Heuvel F., Vosselman G., 2007, An integrated approach for modelling and global registration of point clouds.ISPRS journal of Photogrammetry and Remote Sensing, 61(6), 355-370.
Ripperda N. and Brenner C., 2009. Application of a Formal Grammar to Façade Reconstruction in Semiautomatic and Automatic Environments. In 12th AGILE International Conference on Geographic Information Science.
Reif J. H., 1983, Minimum s-t Cut of a Planar Undirected Network in O(n\log^2(n)) Time. SIAM Journal on Computing, 12(1), 71-81. Remondino, F., 2011, Heritage recording and 3D modeling with photogrammetry and 3D scanning. Remote Sensing, 3(6), 1104-1138.
Rusu R. B., Marton Z. C., Blodow N., Dolha M., Beetz M., 2008, Towards 3D point cloud based object maps for household environments. Robotics and Autonomous Systems, 56(11), 927-941. maximization algorithm for acquiring multiplanar maps of indoor environments with mobile robots. Robotics and Automation, IEEE Transactions on, 20(3), 433-443
Zeibak R. and Filin S., 2007, Change detection via terrestrial laser scanning. International Archives of Photogrammetry and Remote Sensing, 36(3/W52), 430-435.
Zhang Z., 2012, Microsoft kinect sensor and its effect. Multimedia, IEEE, 19(2), 4-10.