SYNERGETIC MERGING OF CARTOSAT-1 AND RAMP TO GENERATE IMPROVED
DIGITAL ELEVATION MODEL OF SCHIRMACHER OASIS, EAST ANTARCTICA
S. D. Jawaka, *, A. J. Luisa
a National Centre for Antarctic and Ocean Research, Earth System Science Organization, Ministry of Earth Sciences, Government of India, Headland Sada, Vasco-da -Gama, Goa 403804, India - [email protected]
K KEY WORDS: Cartosat-1, RAMPv2, DEM, interpolation methods
ABSTRACT:
Available digital elevation models (DEMs) of Antarctic region generated by using radar altimetry and the Antarctic digital database (ADD) indicate elevation variations of up to hundreds of meters, which necessitates the generation of local DEM and its validation by using ground reference. An enhanced digital elevation model (eDEM) of the Schirmacher oasis region, east Antarctica, is generated synergistically by using Cartosat-1 stereo pair-derived photogrammetric DEM (CartoDEM)-based point elevation dataset and multitemporal radarsat Antarctic mapping project version 2 (RAMPv2) DEM-based point elevation dataset. In this study, we analyzed suite of interpolation techniques for constructing a DEM from RAMPv2 and CartoDEM-based point elevation datasets, in order to determine the level of confidence with which the interpolation techniques can generate a better interpolated continuous surface, and eventually improves the elevation accuracy of DEM from synergistically fused RAMPv2 and CartoDEM point elevation datasets. RAMPv2 points and CartoDEM points were used as primary data for various interpolation techniques such as ordinary kriging (OK), simple kriging (SK), universal kriging (UK), disjunctive kriging (DK) techniques, inverse distance weighted (IDW), global polynomial (GP) with power 1 and 2, local polynomial (LP) and radial basis functions (RBF). Cokriging of 2 variables with second dataset was used for ordinary cokriging (OCoK), simple cokriging (SCoK), universal cokriging (UCoK) and disjunctive cokriging (DCoK). The IDW, GP, LP, RBF, and kriging methods were applied to one variable, while Cokriging experiments were employed on two variables. The experiment of dataset and its combination produced two types of point elevation map categorized as (1) one variable (RAMPv2 Point maps and CartoDEM Point maps) and (2) two variables (RAMPv2 Point maps + CartoDEM Point maps). Interpolated surfaces were evaluated with the help of differential global positioning system (DGPS) points collected from study area during the Indian Scientific Expedition to Antarctic (ISEA). Accuracy assessment of the RAMPv2 DEM, CartoDEM, and combined eDEM (RAMPv2 + CartoDEM) by using DGPS as ground reference data shows that eDEM achieves much better accuracy (average elevation error 8.44 m) than that of existing DEM constructed by using only CartoDEM (13.57 m) or RAMPv2 (41.44 m) alone. The newly constructed eDEM achieves a vertical accuracy of about 7 times better than RAMPv2 DEM and 1.5 times better than CartoDEM. After using accurate DGPS data for accuracy assessment, the approximation to the actual surface of the eDEM extracted here is much more accurate with least mean root mean square error (RMSE) of 9.22 m than that constructed by using only CartoDEM (RMSE=14.15 m) point elevation data and RAMPv2 (RMSE=69.48 m) point elevation data. Our results indicate that, the overall trend of accuracy for the interpolation methods for generating continuous elevation surface from CartoDEM + RAMPv2 point elevation data, based on RMSE,is as follows: GP1 > IDW > GP2> OK > LP2 > DK > LP1 > RBF > SK > UK.In case of cokriging interpolation methods, OCoK yields more accurate eDEM with the least RMSE of 8.16 m, which can be utilized to generate a highly accurate DEM of the research area..Based on this work, it is inferred that GP2 and OCok interpolation methods and synergistic use of RAMPv2 and CartoDEM-based point elevation datasets lead to a highly accurate DEM of the study region. This research experiment demonstrates the stability (w.r.t multi-temporal datasets), performance (w.r.t best interpolation technique) and consistency (w.r.t all the experimented interpolation techniques) of synergistically fused eDEM. On the basis of average elevation difference and RMSE mentioned in present research, the newly constructed eDEM may serve as a benchmark for future elevation models such as from the ICESAT-II mission to spatially monitor ice sheet elevation.
* Corresponding author.
1. INTROCUCTION
The cryosphere plays a pivotal role in the Earth's radiation; the ice and snow cover in the polar regions reflects more than 90% of the incident radiation and provides a positive feedback to the atmosphere. However, much of the cryosphere is located in inclement weather and inaccessible areas, so field measurements are difficult and evolve high costs. Advancement in satellite remote sensing technology in the last two decades has enabled researchers to monitor the polar ice topography on a regular basis (Jawak and Luis, 2010). Surface topography represented by digital elevation model (DEM) is an important dataset for a wide range of applications, ranging from urban planning to glacier melting. The fusion of multi-temporal point
elevation datasets to create an accurate DEM and comparison of interpolation methods used in DEM generation are grey areas requiring research. Geoscience Laser Altimetry System (GLAS) aboard Ice-Cloud-Elevation satellite (ICESat) based DEMs of Antarctic (500 m spatial resolution) and Greenland (1 km spatial resolution) have been generated from the first seven operational periods (February 2003 through June 2005) (DiMarzio et al., 2007). Another DEM based on ERS-1 altimetry had been generated for Antarctica at resolution of 5 km, from about twenty million data points derived from the geodetic phase from March 1994 to May 1995 (Bamber and Bindschadler, 1997). Very few attempts were made to combine multi-temporal satellite elevation datasets to generate DEM. The International Archives of the Photogrammetry, Remote Sensing and Spatial Information Sciences, Volume XL-8, 2014
The 1-km spatial resolution Antarctic DEM combines measurements from ERS-1 Satellite Radar Altimeter (SRA) and GLAS/ICESat (Bamber et al., 2009). Tsutomu et al. (2010) fused the interferometric synthetic aperture radar (InSAR) technique with GLAS to produce and an accurate DEM of the Antarctic Ice Sheet. Levinson et al. (2013) fused the laser altimeter data with the stereoscopic elevation model to improve maps of ice sheet surface elevation change. Precise surface elevation mapping of Dronning Maud Land in East Antarctica was carried out by fusing differential SAR interferometry GPS measurements (Wesche et al., 2007). In this attempt, a complete DEM of the Halvfarryggen and Sorasen area is derived by a combination of ground-based global positioning system (GPS) measurements, InSAR and GLAS. A new DEM was derived for the ice sheet in western Dronning Maud Land, Antarctica, improved DEM of the Larsemann hills, eastern Antarctica was developed by synergetic merging of GLAS/ICESat, Radarsat Antarctic Mapping Project (RAMP), and contour based ground elevation values (Jawak and Luis, 2012). The high-resolution RAMP DEM was developed by integrating a broad variety of available topographic source data in a geographical information system (GIS) environment to provide consistent coverage of all of Antarctica (Liu et al., 2001). RAMP DEM Version 2 (RAMPv2) incorporates topographic data from satellite radar altimetry, airborne radar surveys, the recently-updated Antarctic Digital Database (version 2), and large-scale topographic maps from the U.S. Geological Survey (USGS). The comparative advantages of fusion of all available sources enabled full exploitation of the most detailed and accurate topographic information in each dataset. The DEM captures details of geomorphology, ranging from small-scale mountain valleys to extensive ice sheet drainage basins. The 1-km, 400-m, and 200-m RAMPv2 DEM data products are generated during this always available in inland areas of the Antarctic ice sheet. Error checking procedures included global statistical analysis, cross-validation methods, and creation of a synthetic stereo image for visualizing and detecting gross errors in the elevation data. A recent study of the accuracy of published DEMs of Antarctica reported large errors (in excess of hundreds of meters) in areas of higher surface slope such as near the margins of the ice sheet and in mountainous terrain (Bamber and Gomez-Dans, 2005). This necessitated the validation of local DEM of Schirmacher Oasis, eastern Antarctica.
Satellite photogrammetry techniques have been extensively used by the scientific community in deriving high resolution DEM, ortho image and terrain parameters such as slope, aspect, contours, drainage etc. Cartosat-1 is the first operational Indian remote sensing satellite capable of providing in-orbit stereo images with 2.5-m nadir resolution and 27-km swath and enabling the creation of accurate 3D maps. The two payloads viz,. PAN-Fore and PAN-Aft are designed with state-of- the-art technologies in order to provide images of high quality. They are mounted in an along track direction with fixed tilts of +26 deg (Fore) and –5 deg (Aft) respectively, to provide along track
stereo and to facilitate near-simultaneous imaging of the same scene. Cartosat-1 was launched to acquire stereo observations of the Earth’s surface, terrain modeling and large-scale mapping (Srivastava et al., 2006; Srivastava et al., 2007). The stereo capability of Cartosat-1 assists in three-dimensional point determination and enables the generation of detailed DEM (Kumar et al., 2006; Crespi et al., 2008; Jacobsen et al., 2008; Giribabu et al., 2013a; Giribabu et al., 2013b). Seamless and homogeneous DEM for entire India was generated using Cartosat-1 stereo images (Srivastava et al., 2007; Muralikrishnan et al., 2013) with an accuracy of about 4m (Nandakumar et al., 2008). ISPRS-ISRO Cartosat-1 Scientific Assessment Programme (C-SAP) technical report describes results over test areas Mausanne and Warsaw (Jacobsen, 2006; Jacobsen et al., 2008).
The spatial interpolation is the last step of generating the DEM from point elevation datasets from different sources. Interpolation methods can be broadly defined as being deterministic or probabilistic. Deterministic methods are based only on surrounding values, with algorithms using mathematical formulae to determine the influence of immediate neighbor values. Probabilistic geostatistical methods rely on spatial autocorrelation and account for distance and direction when determining the importance of surrounding values (Maune et al., 2001). The accuracy of DEMs varies with changes in terrain and land cover type (e.g. Hodgson and Bresnahan, 2004; Hodgson et al., 2005; Su and Bork, 2006). The selection of an appropriate algorithm for DEM interpolation is an important decision, especially in uneven terrain of polar regions, as differences in terrain model elevations may directly affect the estimates of mass balance studies. Previous authors have investigated DEM interpolation methods with varying accuracy. Bater and Coops (2009) presented Global statistics (mean error and RMSE) for the DEM validation. Lloyd and Atkinson (2002) employed cross- validation and a jack-knife approach to test IDW interpolation and two types of kriging methods. Based upon the literature review, it is evident that no interpolation method is universally superior. Distribution of GCPs, complexity of topography, and assumptions of the given interpolator’s mathematical design affect the ability of interpolation algorithms to generate accurate DEMs. It is practically not possible to reduce the single satellite-based measurements beyond the certain limits, since every satellite based measurement is accompanied with the inherent systematic incorrigible error. Similarly, every interpolation method is accompanied by certain systematic interpolation error. In order to reduce the systematic errors of individual satellite derived dataset and the uncertainty of interpolation methods, the fusion of the multi-temporal and multi-source elevation datasets to generate an accurate DEM of the Schirmacher Oasis is proposed in this work.
2. STUDY AREA
In this work, a DEM is generated for the Schirmacher Oasis and environ, east Antarctica, where India's second research station “Maitri” is established (70O 45‘01.65" S, 11O 43‘01.45" E (Figure 1). The Schirmacher Oasis is a 25-km long and up to 3-km wide ice-free plateau with more than 100 fresh water lakes. It is situated in the Schirmacher Hills on the Princess Astrid Coast in Queen Maud Land in East Antarctica, and is on average 100 meters above sea level. The Cartosat-1 image captured over the study region is depicted on Figure 1.
3. DATA
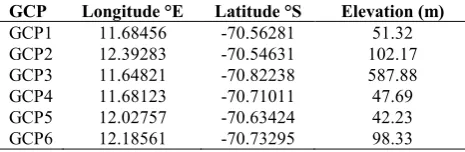
The point elevation dataset derived from RAMPv2 DEM with a spatial resolution of 200 meters was used in this study. RAMPv2 DEM (Liu, 2001) combines topographic data from various sources to provide a consistent coverage of entire Antarctica. Version 2 is improved dataset with new topographic data, error corrections, extended coverage, and other modifications. These data were collected between 1940 and 1999 and more during 1980s and 1990s. Since RAMPv2 DEM does not incorporate GLAS/ICESat (2003-2008) and recent ground survey-based elevation datasets (after 1999), it is necessary to validate local DEM to improve ice volume change studies and field work planning. To generate photogrammetry-based DEM, we used the standard Cartosat-1 stereo pair panchromatic data (PAN-AFT and PAN-FORE), captured on 01st February 2012. Test point elevation dataset is collected during Indian Scientific Expedition to Antarctic (InSEA) using differential GPS (DGPS) (Table 1). The test points were selected in a way to ensure their uniform spatial distribution over the study area. The test point dataset was used for accuracy assessment of the generated DEM. Differing from the previous study, we use the multi-temporal GCPs for DEM accuracy
Table 1. Test points used for accuracy analysis and Cartosat-1 DEM generation
4. METHODOLOGY
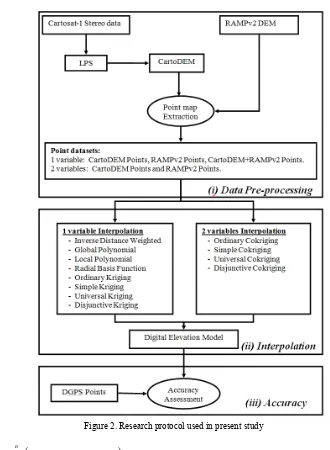
The data processing protocol consists of three blocks: (i) CartoDEM generation and Data preprocessing, (ii) Geostatistical Analysis and Spatial Interpolation, and (iii) Accuracy Analysis (Kumar and Vyas, 2009; Jawak et al., 2013) (Figure 2). Cartosat-1 stereo pair was processed using Leica Photogrammetric Suite (LPS) software (version 2011) by creating a single project block file using test bed environment. LPS software enables creating frames from Cartosat-1 stereo data along with rational polynomial coefficients (RPCs), facilitates GCP collection, automatic/manual tie-point collection, automatic DEM generation and editing, and
Orthoimage generation. Image orientation was done using Cartosat-1 RPC geometric model available in the LPS software and later refined using GCPs. After performing the triangulation with 6 GCPs, the model’s RMSE was 0.83 pixel indicating that the residual error in the model is within a pixel. After bundle block adjustment, a CartoDEM of 10 m resolution was generated. CartoDEM point elevation dataset was extracted using various raster processing techniques. The RAMPv2 DEM with Arcinfo format was used with WGS84 datum. Point elevation dataset was extracted from RAMPv2 DEM using various raster processing techniques. In data preprocessing all the datasets were converted in one datum system covering the same area and in a similar format. After pre-processing data, three data sets were generated: CartoDEM point data, RAMPv2 DEM point data, and DGPS points.
In this study, we analyzed suite of interpolation techniques for constructing a DEM from RAMPv2 and Cartosat-1point datasets, in order to determine the level of confidence with which the interpolation techniques can generate a better interpolated continuous surface, and to improve the elevation accuracy of DEM from synergistically fused RAMPv2 and CartoDEM point elevation datasets. CartoDEM points and RAMPv2 points were used as primary data for various interpolation techniques such as Ordinary Kriging (OK), Simple Kriging (SK), Universal Kriging (UK), Disjunctive Kriging (DK) techniques, IDW, Global Polynomial (GP) with power 1 and 2, Local Polynomial (LP) and Radial Basis Functions (RBF). CartoDEM points supplemented with RAMPv2 points were used for Cokriging of 2 variables for Ordinary Cokriging (OCoK), Simple Cokriging (SCoK), Universal Cokriging (UCoK) and Disjunctive Cokriging (DCoK) (Chang, 2006; Lloyd and Atkinson, 2002; Jawak and Luis, 2011; Jawak et al., 2012). We note that the test point dataset consisting of 6 points was excluded from the actual interpolation experiment to ensure an unbiased accuracy assessment. ArcGIS 9.2 (Geostatistical analyst), ERDAS IMAGINE 9.2 (surfacing tool) and other GIS software were used for spatial interpolation of point elevation dataset to generate DEM. MatLab and IDL programming were also implemented for interpolation of point datasets and to generate DEMs using various surfacing techniques. The accuracy of a DEM can be defined as the average vertical error of all potential points interpolated within the DEM surface grid (Ackermann, 1996). Larger the value of the average elevation difference (irrespective of sign), the greater the discrepancy between the two data sets. Accuracy is the reverse measurement of error. Average error is calculated to produce chart of average error using
Figure 1. Spatial extent of study region (Schirmacher Oasis)
(
)
n
H
H
error
n
i
reference measured
∑
=
−
=
1where H is elevation and n number of test points.
For quantifying the uncertainty of DEM, we have used distributional measures of statistical methods. The most widely used measure is the Root Mean Square Error (RMSE), a quadratic scoring rule which is be defined as the square root of the variance or standard error. It measures the dispersion of the frequency distribution of deviations between the original point elevation dataset and the DEM based point elevation dataset, mathematically expressed as:
∑
−
=
=
n
i
h
Hm
Hr
RMSE
n
i
i
1
2
)
(
1
where: Hmiis the ith original elevation value measured using
DGPS, Hri is the corresponding value measured on the
reference DEM surface, n is the number of elevation points checked (test point elevation dataset).
5. RESULTS
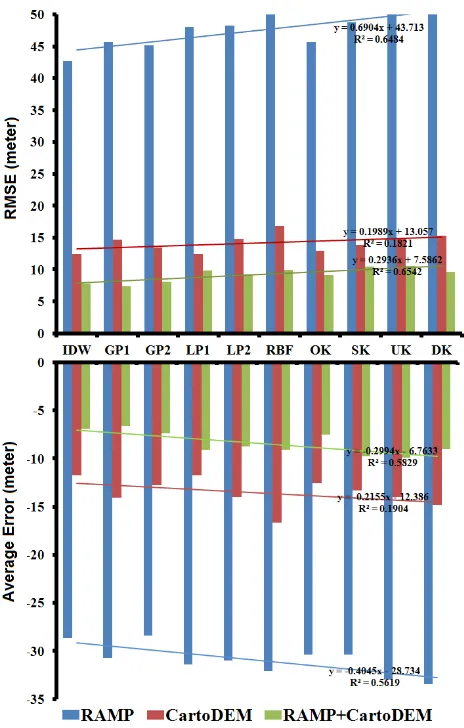
The DEM generated by applying different spatial interpolation techniques to various combinations of datasets were evaluated by using accurate source of ground-based DGPS point observations specified in Table 2. The average elevation difference and RMSE calculated for each DEM interpolated with various interpolation techniques are tabulated in Table 2. The range of average elevation differences or average errors of RAMPv2 point map is between ≈–28 to ≈–34 m (Table 2). IDW interpolation yields the least elevation difference using RAMPv2 point map data. However, the highest difference amounts from DK interpolation that uses the same dataset (Figure 3). The range of average elevation differences for CartoDEM generated using various interpolation techniques range between ≈–11 m to ≈16 m (Table 2). The IDW and LP1interplators perform the best to generate DEM using CartoDEM point elevation data. The elevation difference of CartoDEM supplemented with RAMPv2 DEM is between ≈–6 and ≈–10 m. GP1 and IDW interpolation applied to CartoDEM + RAMPv2 point map yields the least elevation difference, while UK and DCoK render the highest difference for the same data (Figure 4 and Table 2).
Figure 2. Research protocol used in present study
The average elevation difference between interpolation experiments using RAMPv2 point map merged with CartoDEM point map (mean RMSE= 9.22 m) is smaller than CartoDEM point map (mean RMSE = 14.15 m) and RAMPv2 point map (mean RMSE = 45.51 m). The CartoDEM supplemented by RAMPv2 point map gives better accuracy with mean elevation difference of -8.44 m for all interpolation methods; RAMPv2
and CartoDEM yield a mean elevation difference of –30.96 m and –8.44 m, respectively, which suggests that the CartoDEM supplemented by RAMPv2 DEM gives the mean accuracy much better than RAMPv2 DEM and CartoDEM individually. In case of cokriging interpolation methods, OCoK yields more accurate fused DEM with the least RMSE of –7.16 m Figure 3. Variation of average errors and RMSE values
for all the practiced interpolation methods using various dataset combinations.
Table 2. Average error and RMSE estimates for various interpolation methods used in the present study
Figure 4. Variation of average errors and RMSE values for Cokriging interpolation methods using various dataset combinations.
(comparable to SCoK with –7.71 m RMSE). GP1 and IDW are the best interpolation methods (CartoDEM+RAMPv2 point elevation data) with least RMSE of 7.40 m and 7.83 m, respectively, which can be utilized to generate a highly accurate eDEM of the research area. Based on this work, we infer that GP1 or IDW interpolation and synergistic use of RAMPv2 and CartoDEM point elevation datasets lead to an accurate DEM of Schirmacher oasis which is depicted on Figure 5.
6. DISCUSSION
We compared the DEM generated by RAMPv2 point elevation dataset alone with that constructed by combining the RAMPv2 with CartoDEM point elevation dataset. Different interpolation techniques were tested on the different point elevation datasets with different combinations. The output maps represented by a variety of interpolated surfaces were assessed using accurate DGPS point elevation data generated from field surveys carried out as a part of Indian Scientific Expeditions to Antarctica (InSEA) during austral summer of 2009-10, 2010-2011, 2011-12, 2012-13, 2013-14. This research experiment presents a methodology for applying to multi-temporal elevation datasets to generate a DEM and to test the accuracy of a wide array of interpolation methods based on the GPS points. RAMPv2 data were collected during 1940-1999; Carotsat-1 stereo data was captured in February 2012, while DGPS data was sampled in austral summers of 2008-2013. The data collected through such a long time span definitely involves some differences in elevation due to environmental influence. This could have resulted in a large variation of elevation differences and RMSE of interpolation methods. In this research, we designed the most stable (stability w.r.t elevation changes over a long period) and realistic DEM from the available multi-temporal elevation datasets. We deduce that the high variations of RMSE over various interpolation methods are due to four major reasons a) dissimilar spatial extents of the input datasets influence the interpolation techniques by undersampling or oversampling of data points. To overcome these data limitations, we tested various interpolation techniques instead of depending on single specific interpolation technique. b) Unequal data sizes (volumes and densities) of RAMPv2, and CartoDEM-based point elevation datasets over the study area. c) Systematic errors or imperfections in the measuring instruments viz GPS instrument, etc. d) RAMPv2 itself is an interpolated DEM, i.e. the overall resultant point elevation may not represent actual elevation values; a few of them may represent interpolated or predicted values. Incorporation of such interpolated values propagates the inherent systematic errors related to each measurement.
Global polynomial interpolation fits a smooth surface that is defined by a mathematical function (a polynomial) to the input sample points. The GP surface changes gradually and captures coarse-scale pattern in the data. The result from GP interpolation is a smooth surface that represents gradual trends in the surface over the study area. GP interpolation tend to fit a surface to the sample elevation points and performs best when the surface varies slowly from region to region over the area of interest. We surmise that the GP interpolation performed better in our study because the surface topography over study region varies smoothly from continental ice to the shelf ice through narrow oasis.
7. CONCLUSION
The DEM accuracy evaluations are traditionally difficult to validate, especially in regions with limited GCPs due to inclement weather condition. The quality of a DEM is dependent upon a number of interrelated factors, including the methods of data acquisition, the nature of input data, and the methods employed in generating the DEMs. Generation of DEM using point elevation data also depends on size of data, nature of interpolation techniques, and parameters used for each interpolation technique. The accuracy of two widely used point elevation datasets CartDEM and RAMPv2, were assessed using ground-based GPS data. Elevation errors, in excess of 15 m, were omnipresent in both models; they were more extensive in RAMPv2 compared to CartoDEM point elevation dataset. The accuracy of three types of DEMs generated by using various spatial interpolation techniques on RAMPv2 point elevation data and CartoDEM data have been examined by comparison with GPS surface elevation data for a limited region in the Schirmacher oasis, east Antarctica. Our results reveal that eDEM (synergistic merging of CartoDEM and RAMPv2) yields the best accuracy in terms of RMSE, with least average elevation difference, with respect to various interpolation techniques. Based on this research, theoretically, it’s not possible to comment on which interpolation technique is better than the others, because these techniques are based on the data type, parameters of interpolation, data size and also on method of interpolation itself. So research experiment should be more focused and based on trial-and-error method to achieve desired accuracy of DEM. This research experiment demonstrates the stability (with respect to multi-temporal datasets), performance (with respect to best interpolation technique) and consistency (with respect to all the experimented interpolation techniques) of synergistically fused eDEM. On the basis of the average elevation difference and RMSE the newly constructed eDEM outperforms the other DEMs generated using various combination of datasets and may serve as a benchmark for future elevation models such as from the TanDEM-X mission or future ICESat-II mission to spatially monitor ice sheet elevation.
ACKNOWLEDGEMENT
We are indebted to NSIDC, NASA for making freely available the RAMPv2 DEM. We are grateful to Dr. S. Rajan, Director, NCAOR and Dr. Rasik Ravindra, Former Director NCAOR, for their encouragement and motivation for this research. This is NCAOR contribution no. 39/2014.
REFERENCES
Ackermann, F., 1996. Techniques and strategies for DEM generation. In: Greve C (ed) Digital Photogrammetry: An Addendum to the Manual of Photogrammetry. American Figure 5. eDEM of Schirmacher oasis
Society of Photogrammetry and Remote Sensing, Falls Church, VA, pp. 135-141.
Bamber, J. L., Gomez-Dans, J. L., and Griggs, J. A., 2009. Antarctic 1 km Digital Elevation Model (DEM) from Combined ERS-1 Radar and ICESat Laser Satellite Altimetry. Boulder, Colorado USA: National Snow and Ice Data Center, Digital media.
Bamber, J. L. and Gomez-Dans, J. L., 2005. The accuracy of digital elevation models of the Antarctic continent. Earth Planet. Sc. Lett., 217, pp. 516–523, 2005.
Bamber, J.L. and Bindschadler, R.A.., 1997. An improved elevation dataset for climate and ice-sheet modelling: validation with satellite imagery. Annals of Glaciology 25, pp. 438-444.
Bater, C.W. and Coops, N.C., 2009. Evaluating error associated with lidar-derived DEM interpolation. Computers & Geosciences, 35, pp. 289–300.
Chang, K., 2006. Introduction to Geographic Information System; Tata McGraw-Hill, 2006, pp. 318–346.
Crespi, M., De Vendictis, L., Poli, D., Wolff, K., Colosimo, G., Gruen, A., Volpe, F., 2008. Radiometric quality and DSM generation analysis of Cartosat-1 stereo imagery. http://www.isprs.org/proceedings/XXXVII/congress/1_pdf/228. pdf (last accessed: 02/09/2012).
DiMarzio, J., Brenner, A.C., Schutz, R., Shuman, C. A., and Zwally, H. J. (2007). GLAS/ICESat 500m laser altimetry digital elevation model of Antarctica, [GLAS/ ICESat Elevation products (release 31), February 2003 to October 2008]. Boulder, Colorado USA: National Snow and Ice Data Center. Digital media.
Giribabu, D., Kumar, P., Mathew, J., Sharma, K.P. & Murthy, Y.V.N.K., 2013b. DEM generation using Cartosat-1 stereo data: issues and complexities in Himalayan terrain. European Journal of Remote Sensing, 46, pp. 431-443.
Giribabu, D., Srinivasa Rao, S., Krishna Murthy, Y.V.N., 2013a. Improving Cartosat-1 DEM accuracy using synthetic stereo pair and triplet. ISPRS Journal of Photogrammetry and Remote Sensing, 77, pp. 31-43.
Hodgson, M.E., Jensen, J., Raber, G., Tullis, J., Davis, B.A., Thompson G., Schuckman K., 2005. An evaluation of lidar-derived elevation and terrain slope in leaf-off conditions. Photogrammetric Engineering & Remote Sensing 71 (7), pp. 817–823.
Hodgson, M.E. and Bresnahan, P., 2004. Accuracy of airborne lidar-derived elevation: Empirical assessment and error budget. Photogrammetric Engineering and Remote Sensing 70 (3), pp. 331–339.
Jacobsen K., 2006: ISPRS-ISRO Cartosat-1 Scientific Assessment Programme (C-SAP) Technical report - test areas Mausanne and Warsaw, ISPRS Com IV, Goa 2006, International Archives of the Photogrammetry, Remote Sensing and the Spatial Information Science, 36 (4), pp. 1052-1056.
Jacobsen, K., Crespi, M., Fratarcangeli, F., Giannone, F, 2008. DEM generation with Cartosat-1stereo imagery EARSel, Workshop Remote Sensing-New Challenges of High Resolution, Bochum 2008.
Jawak, S.D., Luis, A.J., 2012. Synergistic use of multitemporal RAMP, ICESat and GPS to construct an accurate DEM of the Larsemann Hills region, Antarctica. Journal of Advances in Space Research, 50(4), pp. 457-470.
Jawak, S.D., Sambhus, P.G, Paranjape, R.A., and Luis, A.J., 2012. Assessment of spatial interpolation techniques for generating accurate digital elevation surface using combined Radar & LiDAR elevation data. Proceedings of 8th International Conference on Microwaves, Antenna Propagation and Remote Sensing (ICMARS-2012), Paper Id-ICMARS12121, Jodhpur, India, 11-15 December 2012.
Jawak, S. D., Jadhav, S.P., and Luis, A.J., 2013. Usage of Multiple Satellite and Ground-based Elevation Datasets to Generate an Accurate Digital Elevation Surface: Methods and Error analysis. National Seminar on Earth Observation & Geo-information Sciences for Environment and Sustainable Development (EGESD)-2013, 07–09 February, University of Mumbai, India.
Jawak, S.D., Luis, A.J., 2011. Synergetic use of GLAS/ICESat and RAMP to construct 3D DEM of Schirmacher Oasis, East Antarctica. 11th International Symposium on Antarctic Earth Sciences (ISAES-2011), 10-16 July 2011, Edinburgh, Scotland, U.K., July 2011.
Jawak, S.D., Luis, A.J., 2010. Synergistic use of SAR, GLAS/ICESat & Ground Survey (GPS) data to Construct an accurate DEM of the Larsemann Hills Region. 4th SCAR- Open Science Conference, 03-06 August 2010, Buenos Aires, Argentina, August 2010.
Kumar, A. and Vyas, S., 2009. Cartosat-1 Elevation Product and ICESat/GLAS Data for Digital Elevation Surface Generation. Journal of Indian Society of Remote Sensing, 37, pp. 565–572.
Kumar, P., Mathew, J., Kumar, S., Kudrat, M., 2006. Cartosat data utility for hydropower sites investigation and potential assessment. National Natural Resources Management System (NNRMS) Bulletin, 31, pp. 61-67.
Lloyd C. D. and Atkinson P.M., 2002. Deriving DSMs from LiDAR data with kriging. Int. J. Rem. Sens. 23(12), pp. 2519– 2524.
Liu, H., K. Jezek, B. Li, and Z. Zhao., 2001. Radarsat Antarctic Mapping Project digital elevation model version 2. Boulder, Colorado USA: National Snow and Ice Data Center. Digital media.
Levinson, J. F., Howat, I. M., and Tscherning, C. C., 2013. Improving Maps of Ice-Sheet Surface Elevation Change Using Combined Laser Altimeter and Stereoscopic Elevation Model Data. Journal of Glaciology, 59(215), pp. 524-532.
Maune, D.F., Kopp, S.M., Crawford, C.A., Zervas, C.E., 2001. Introduction. In: Maune, D.F. (Ed.), Digital Elevation Model Technologies and Applications: The DEM Users Manual. The International Archives of the Photogrammetry, Remote Sensing and Spatial Information Sciences, Volume XL-8, 2014
American Society for Photogrammetry and Remote Sensing, Bethesda, pp. 1–34.
Muralikrishnan, S., Pillai, A., Narender, B., Reddy, P.S. & Venkataraman, V.R. & Dadhwal, V.K., 2013. Validation of Indian National DEM from Cartosat-1 data. Journal of Indian Society of Remote Sensing, 41(1), pp. 1-13.
Nandakumar, R., Amitabh Chamy, M.P.T., Kopparthi, S.S.S., Paswan, G., Prakash, S., Singh, S., 2008. Synthesis of investigations under ISPRS-ISRO Cartosat-1 scientific assessment programme primarily for DSM generation. http://www.isprs.org/proceedings/XXXVII/congress/1_pdf/218. pdf (last accessed: 02/09/2012).
Su, J. and Bork, E., 2006. Influence of vegetation, slope and lidar sampling angle on DEM accuracy. Photogrammetric Engineering and Remote Sensing 72 (11), pp. 1265–1274.
Srivastava, P.K., Srinivasan, T.P., Gupta, A., Singh, S., Nain, J.S., Amitabh, P.S., Kartikeyan, B., Gopala, K.B., 2007. Recent advances in CARTOSAT-1 data processing. International Archives of the Photogrammetry, Remote Sensing and the Spatial Information Sciences 36 (Part 1/W51), on CD-ROM.
Srivastava, P. K., Gopala Krishna, B., Srinivasan, T. P., Amitabh Chamy, M.P.T., Trivedi, S., Nandakumar, R., 2006. Cartosat-1 Data Products for Topographic Mapping, ISPRS Commission-IV International Symposium on “Geospatial Databases for Sustainable Development, Goa, 27-30 September.
Tsutomu, Y., Koichiro, D. and Kazuo, S. 2010. Combined Use of InSAR and GLAS Data to Produce an Accurate DEM of the Antarctic Ice Sheet: Examplefrom the Breivika-Asuka Station Area. Polar Science, 4(1), pp. 1-17.
Wesche, C. , Drews, R. , Steinhage, D. and Rack, W., 2007. Precise surface topography in Dronning Maud Land, Antarctica, based on ground based kinematic GPS measurements. International Symposium on snow science, Moscow, Russia, September 2007 .