REGISTRATION OF TIME OF FLIGHT TERRESTRIAL LASER SCANNER DATA FOR
THE STOP-AND-GO MODE
H. M. Badawy *, N. M. Alsubaie, M. Elhabiby**, N. El-Sheimy
*Department of Geometrics Engineering, University of Calgary, 2500 University Dr. NW, Calgary, AB T2N 1N4, Canada (hmmohamm, nalsubai, mmelhabi, elsheimy)@ ucalgary.ca
** Public Works Department, Ain Shams University, Cairo, Egypt
Commission VI, WG VI/4
KEY WORDS: Stop-and-Go, Time of Flight, Registration, Terrestrial Laser Scanner, Mobile Laser Scanning, Time of Flight.
ABSTRACT:
Terrestrial Laser Scanners (TLS) are utilized through different data acquisition techniques such as Mobile Laser Scanning (MLS) and the output can be used in different applications such as 3D city modelling, cultural heritage documentations, oil and Gas as built, etc... In this research paper, we will investigate one of the modes of TLS on mobile mapping platform. Namely the Stop-and-Go (SAG) mode. Unlike the continuous mode, the Stop-and-Go mode does not require the use of IMU to estimate the TLS attitude and thus in-turn it has an overall reduction in the system cost. Moreover, it decreases the time required for data processing in comparison with the continuous mode. For successful use of SAG mobile mapping in urban areas, it is preferred to use a long range time of flight laser scanner to cover long distances in each scan and minimize the registration error. The problem arise with Long range laser scanners is their low point cloud density. The low point cloud density affects the registration accuracy specially in monitoring applications. The point spacing between points is one of the issues facing the registration especially when the matching points are chosen manually. Since most of TLS nowadays are equipped with camera on-board we can utilize the camera to get an initial estimate of the registration parameters based on image matching. After having an initial approximation of the registration parameters we feed those parameters to the Iterative Closest Point algorithm to obtain more accurate registration result.
1. INTRODUCTION
TLS nowadays are vital for mobile mapping applications. One of the most interesting applications is 3-D modelling of large areas. To cover a large area usually full mobile mapping with a moving car with Inertial Measurement Units (IMUs) and Global Navigation Satellite Systems (GNSS) on-board and a short range Phase Shift (PS) laser scanner. The choice of the PS laser scanner for full mobile mapping is obvious to cope with the speed of the moving vehicle. That comes with the price of an expensive system and shortage in coverage especially with high buildings. To overcome the drawback of the full mobile mapping, the long range Time of Flight (ToF) laser scanner is used with the SAG mode. SAG mode requires registration of the point clouds obtained from each scan (stop). The registration error increases with the increase of number of scans. In the case of ToF long range TLS, a few number of scans can cover a large area that requires many scans if we use PS laser scanners.
The problem arising with ToF data is their low density. This low density lowers the accuracy of the registration especially when matching points that are manually selected. Camera nowadays are associated with many TLS and obtains images at each scan. These images can be utilized to obtain the relative orientation of the TLS at each scan.
In this research paper we investigate the automatic registration of ToF laser scanner point cloud. We perform automatic registration based on the image matching for images associated with each scan. The most efficient algorithm used nowadays for image matching is the Speeded-Up Robust Features (SURF) algorithm. After using the SURF algorithm we use the tie points in each
* Corresponding author.
image to estimate the relative orientation between images. Relative orientation parameters are then fed to the Iterative Closest Point ICP algorithm to find the best registration parameters for the scans.
2. AUTOMATIC REGESTRATION OF POINT CLOUD
The registration process usually involves manual selection of matching points between the scans to be registered (at least three non collinear points to apply Least Squares (LS)). Manual selection of the matching points is an inaccurate and time consuming process, especially when the number of points is limited.
The technique used to overcome the inaccuracy of the manual registration is to use a transformation parameters obtained from the manual registration and fed it to the ICP algorithm. Nowadays most of the Laser scanners are equipped with metric cameras. The images associated with each scan can be utilized to obtain their relative orientation parameters. These parameters could be used as an estimate for the initial transformation parameters used in the ICP algorithm.
At least five tie points must exist between the stereo images in order to obtain the relative orientation. In this paper, the tie points are determined via the feature selection algorithm known as SURF (Bay, Ess, Tuytelaars, & Van Gool, 2007) .
In the following subsection we are going to review the algorithms used to obtain perform automatic registration of point cloud using images.
2.1 SURF ALGORITHM
SURF algorithm was proposed to overcome the slow performance of the Scale Invariant Feature Transformation (SIFT) algorithm. SIFT was Introduced by Lowe in 2004 (Lowe, 2014) to find matching features in images with different scales. Several tests on SIFT shows its robustness against illumination changes, rotation and scale change. The major problem with SIFT was its slow performance. To improve the performance of image matching based on key points detection and description SURF used integral images and approximated the Laplacian of Gaussian (LoG) with a Box filter.
The way that SURF work is to find interest points such as corners and blobs. Then neighbourhood of every interest point is represented by feature vector (descriptor). Finally the descriptor vectors in the two images are matched.
2.2 Estimation of orientation parameters from stereo images
The problem of relative orientation can be solved using at least five tie points and applying the coplanrity condition. The solution of the relative orientation parameters based on the coplanarity condition is described in several literatures such as (Jue, 2008) and (Pozzoli & Mussio, 2003).
The baseline vector between the two images described in the first image’s coordinate system is = [ , , ]�.
And the coordinates of a point in the first image is described
in the first image’s coordinate system as , , . Similarly for a point in the second image’s coordinate system is , , . The coplanarity condition is a constraint for a number of vectors to be in a plane (Mullen, Mikhail, McGlone, & Bethel, 2004). For the three vector case, the coplanarity condition is that their triple product is zero. That is:
= . � × � = |
coordinate and the second image’s coordinates and is a function
of the rotation angles , �, � .
The determinant can be computed in terms of the base vector and the rotation angles. Parameters (IOPs) of the camera.
The estimation of the parameters is straight forward via LS:
� = �� − (4)
The following equations are used to simplify the derivatives of the elements of the rotation matrix � with respect to the rotation angles: registration parameters of two scans with which the stereo images are associated. The initial estimate is fed to the ICP algorithm to have an accurate registration parameters.
2.3 ICP
The ICP algorithm is used to get an accurate estimate of the registration parameters. The basic idea about this method is to minimize the square distance between neighbouring points in the two scans.
Suppose that the points in the reference scan are � � = , … , and the points in the other scan are � � = , , … , ,
where each point is described by three coordinates in the scan’s
local coordinate system.
The equation of transformation is given by:
�= � �+ + � (9)
Where �the translation vector between the two scans’ coordinate systems and � is the rotation matrix between the scans. � is the distance between the two points in the two scans.
One can think of it as an error originating from the registration (Vosselman & Maas, 2010). This algorithm is first proposed by Besl and McKay (Besl & McKay, 1992) for shape registration
and is based on Horn’s method for estimating the transformation
parameters (Horn, 1987).
Then the coordinates of each point in both scans is shifted such that the centroid is its origin.
�
′=
�− (13)
�′= �− (14)
This allows separate estimation of rotation and translation. The square error is then written as:
� = ∑ ∥ � �′− �′∥ parameters appearing in the rotation matrix. In order to minimize � then, the last term should be maximum.
∑ �′�� �′ �
⟹ � (16)
The rotation matrix is defined in terms of the quaternions to simplify the manipulation of the equations.
The elements of the rotation matrix in terms of the quaternions are given as:
Where the unit quaternion is defined as:
��= [ ]� (18)
Now the matrix �is constructed from the elements of the cross covariance matrix of the two point clouds. The cross covariance matrix is given by:
� is the symmetric matrix whose elements are as follows:
= � + � + �
eigenvector corresponding to the largest eigenvalue of the matrix �.
After estimating the quaternion, the rotation matrix is constructed and we can use the equation
= �− � � (23)
to estimate the translation.
In computing the covariance matrix between the two sets of point clouds, the two sets must be organized to get the nearest points in the two sets. This is required because simply the term ∑� � �′� is the sum of points in one scan and their corresponding points in the other scan.
3. RESULT ANALYSIS AND DISCUSSION
3.1 Test data
The test data were collected using the ToF long range laser scanner. The site of data collection was done at North West Calgary, AB, Canada.
The point spacing of the point cloud was chosen to between 1.5 cm and 2cm for the sake of fast data collection.
The laser scanner is equipped with a DSLR camera with the parameters:
= . mm ��= − . mm
�= . mm
3.2 Visual assessment of the results
In Figure (1) and (2) the two images are shown with the results of the image matching points using SURF Algorithm. The coloured circles in both images indicates the matching points.
Figure 1.Image taken by the ILRIS Camera associated with reference Scan
Figure 2. Image taken by the ILRIS Camera associated with the second scan
In Figure (3), the result of point cloud registration is zoomed in to show the scale of the building. The RGB colour points are the registered point cloud and the intensity colour points are the reference point cloud.
Figure 3. Result of registration the two scans.
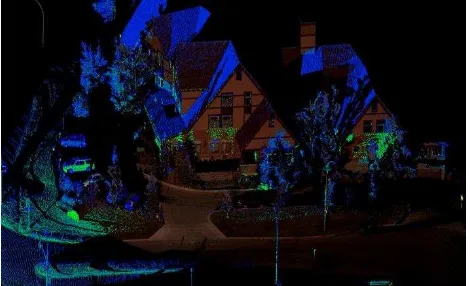
Figure (4) shows part of the scan scene to show the large area that can be covered with two scan using long range ToF laser scanner.
Figure 3. Result of registration the two scans.
3.3 Statistical assessment of the registration results
The Root Mean Square Error (RMSE) is computed for the registration. It is given by the equation:
= ∑ ∥ � �+ �− �∥ �
(24)
This error is computed at the final estimate of the registration parameters to assess our registration quality.
The RMSE for the registration between the scans was found to be 1.888 cm.
Compared to the point spacing of the point cloud of the reference scan the value of the RMSE is satisfactory.
4. CONCLUSION
The research paper investigates the registration of ToF laser scanner data in the SAG mode. The images associated with the scans taken by this type of scanners are utilized to get an estimate for the relative orientation between the two scans. The initial estimate of the orientation parameters is used in the ICP algorithm to enhance the registration between the scans. The overall accuracy of the registration process can be assessed with the RMSE with comparison to the point spacing. It was shown that the RMSE of the registration process is 1.888 cm. Compared to the point spacing of the scan this is a good result.
The visual assessment of the results shows that with only few scans with a ToF scanner a 3D model can be generated for a very large area that requires many scans of a PS scanner, which leads to larger registration error in the case of PS scanner.
REFERENCES
Bay, H., Ess, A., Tuytelaars, T., & Van Gool, L. (2007). Speeded-Up Robust Features (SURF). Computer Vision and Image Understanding, 110(3), 346–359.
Besl, P. J., & McKay, N. D. (1992). A Method of Registration of 3-D shapes. IEEE Transactions on Pattern Analysis and Machine Intelligence, 14(2), 239 - 256.
Horn, B. K. (1987). Closed-form solution of absolute orientation using unit quaternions. Journal of the Optical Society of America, 4(4), 629-642.
Jue, L. (2008). RESEARCH ON CLOSE-RANGE PHOTOGRAMMETRY WITH BIG ROTATION ANGLE. The
International Archives of the Photogrammetry, Remote Sensing and Spatial Information Sciences. XXXVII, 157-162.
Lowe, D. G. (2014). Distinctive image features from scale-invariant keypoints. International journal of computer vision, 60(2), 91-110.
Mullen, R., Mikhail, E. M., McGlone, J. C., & Bethel, J. S. (2004). Manual of Photogrammetry. American Society for Photogrammetry and Remote Sensing.
Pozzoli, A., & Mussio, L. (2003). QUICK SOLUTIONS
PARTICULARLY IN CLOSE RANGE
PHOTOGRAMMETRY. The International Archives of the Photogrammetry, Remote Sensing and Spatial Information Sciences, XXXIV (5/W12), 273-278.
Vosselman, G., & Maas, H.-G. (2010). Airborne and Terrestrial Laser Scanner. Boca Raton, FL, USA: Whittles Publishing.