GROUND-BASED CLOUD OBSERVATION FOR SATELLITE-BASED CLOUD
DISCRIMINATION AND ITS VALIDATION
M. Yamashita a, M. Yoshimura b a
Survey College of Kinki, 1-5-9 Yata, Higashi-sumiyoshi-ku, Osaka, 546-0023, Japan –yamashita@kinsoku.ac.jp
bPASCO Corporation, Research and Development Center, 2-8-11 Higashiyama, Meguro-ku, Tokyo, 153-0043, Japan –
mairtu1698@pasco.co.jp
Commission VIII, WG VIII/3
KEY WORDS: Atmosphere, Weather, Development, Application, Radiation, Observations
ABSTRACT:
Solar radiation is a source of energy for ground surfaces. Clouds control energy budget on both local and global scales. We propose the simple ground-based observation method for various sky conditions instead of the existing visual observation. In the paper, we mainly describe how to discriminate clouds area on whole sky images, how to overlay the cloud areas to the satellite-based images and the test experiment. As for the discrimination of sky conditions, we use Sky Index (SI) and Brightness Index (BI) calculated from whole sky imageries. SI shows the extent of the blueness and grayscale and BI indicates the extent of the brightness. Sun, cloud and blue sky areas are divided by SI and BI threshold. As an extension of ground-based observation to satellite-based observation, clouds area discriminated by ground-based observation overlay to satellite images. Through this experiment, the utilities of ground-based cloud observation are discussed.
The proposed ground-based cloud observation method and its satellite-based extension should be connected to satellite products with high quality by implementation of sky and clouds observation covering a wide area.
1. INTRODUCTION
Clouds control energy budget on both local and global scales. Generally, it is well known that lower clouds cool the surface and upper clouds have the effects to warm the surface (Clement et al, 2009). Cumulus clouds especially in atmospheric boundary layer play crucial role in modulating the exchange of radiation, heat and moisture (Freedman et al. 2001). The size and the lifespan of cumulus clouds are small and short, therefore it is difficult to observe and monitor them spatially and temporally.
Satellite-based observation and its products related to clouds properties have been useful to estimate some physical values such incident radiation/ Photosynthetic Active Radiation (PAR) and Fraction of PAR etc., and to be advanced various high quality satellite products. However, there are still some uncertainness such as cloud motion, cloud coverage, cloud type and these effects by satellite-based observation. Therefore, the efficient ground-based cloud observation is necessary to validate satellite-based observation such existing Terra & Aqua/ Moderate Resolution Imaging Spectroradiometer (MODIS) and under planning Global Change Observation Mission - Climate (GCOM-C) / Second generation GLobal Imager (SGLI) etc. Recently, the ground-based cloud observation systems have been developed by using whole sky camera in world widely instead of the existing visual observation (Calbo and Sabburg, 2008; Yamashita and Yoshimura, 2008; Heinle et al., 2010). The purpose of this study is to discriminate the cloud and overlay the cloud areas with satellite-based images by the efficient and simple ground-based cloud observation using commercial based digital camera and fish eye lens in order to validate the satellite-based observation. In the paper, we mainly describe how to discriminate the cloud area on whole sky images, how to overlay the cloud areas to the satellite-based images and the test experiment. Through this experiment, the utilities of ground-based cloud observation are discussed.
2. GROUND-BASED CLOUD OBSERVATION
2.1 Camera system
Automatic-capturing Digital Fisheye Camera (ADFC) is the instruments to take and accumulate the whole sky imageries. ADFC consists of digital camera (Nikon, Coolpix4500) with fisheye lens (Nikon, Fisheye Converter FC-E8), waterproof hard case and remote controlled cable connected to PC (Tsuchida et al, 2005).
In order to decrease the influence for CCD saturation caused by the strong sun light, the neutral density filter with 10% transparency (FUJIFILM, ND1.0) puts between the digital camera and the fisheye lens. The camera is set up to take imageries at every two-minute interval by fixed exposure of the aperture as F2.6 and shutter speed as 1/500s. The image size has 2204pixels by 1704lines with RGB colors and JPEG (1/4 compressed) format instead of RAW or Tiff format to accumulate the large volume of image files. In this study, we already have confirmed that the almost no influences between JPEG (1/4 compressed) and RAW/Tiff formats after image processing. Also, digital number (DN) of RGB channels can be used instead of radiance by fixing aperture and exposure. The head of digital camera of ADFC is fixed to north direction and levelled to horizon.
2.2 Discrimination of cloud, blue sky and sun
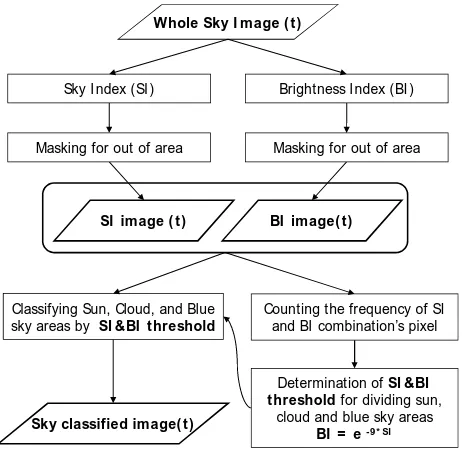
The sky conditions consist of each state of sun, clouds and blue sky. In order to discriminate the sky conditions from whole sky imageries, we use two indices which show the levels of the blueness/greyscale and the brightness calculated from the imageries. Here, the method how to discriminate the sky condition is described. Figure 1 shows the flowchart to classify cloud and blue sky areas from the whole sky imagery taken at the time (t).
International Archives of the Photogrammetry, Remote Sensing and Spatial Information Sciences, Volume XXXIX-B8, 2012 XXII ISPRS Congress, 25 August – 01 September 2012, Melbourne, Australia
In order to discriminate cloud and blue sky areas from the whole sky imageries, we use Sky Index (SI) and Brightness Index (BI) which are calculated from RGB channels of the image. SI shows the blueness/greyscale and BI shows the brightness in pixels. SI and BI are expressed by equation (1) and (2).
(1)
∗ (2)
where DNB ; digital number of Blue channel
DNG ; digital number of Green channel
DNR ; digital number of Red channel n ; bit number of quantization level
SI values have the range between –1.0 and 1.0. The blue sky
area in the RGB image has the higher digital number in blue channel and the lower digital number in red channel. On the other hand, the clouds show white or grey on the image. Thus, the higher value of SI shows bluer sky, the value of near zero shows the clouds and the sun. BI values are expressed by the range between 0 and 1.0. The bright pixels on the image show high BI. The pixels in the sun area have BI = 1 and SI = 0. The whole sky areas consisted of the sun, clouds and blue sky are classified by the threshold curve which was derived from two dimensions of SI and BI coordinates. The threshold curve for sky area classification was determined by counting the frequency of SI and BI combination’s pixel. In this case, the threshold curve was used as BI = e-9*SI. When the coordinates plot under the threshold curve, these are classified as cloud area. The coordinates upper the curve are classified as blue sky area. The sun area in the imagery has the coordinates of SI = 0 and BI = 1. In this way, the sky classified image was generated by SI &
BI threshold.
3. OVERLAYING TO SATELLITE IMAGE
As for the method of overlaying with cloud areas of both ground and satellite-based images, the cloud area on whole sky image are projected to ground surface plane with map coordinate. Our used fisheye lens has equidistant projection. In case of setting the ADFC fixed to north direction and levelled horizontally, the central pixel of whole sky (hemisphere) image corresponds to the zenith.
According to equidistant projection, the distance from the image centre is in proportion to zenith angle shown in equation (3).
R (3)
where ded ; distance from zenith (image centre) R; Radius of whole sky image area (pixels) ; Zenith angle (degrees)
Consequently, the zenith () and azimuth () angles on whole sky image are able to calculate from the image coordinates (u, v). And then, the horizontal distance (HD) from the ground-based observation point, that is central position of whole sky image, to the target cloud can be estimated by given the approximate cloud height supposed from each cloud type, and the cloud areas on whole sky image are projected to map coordinates (x, y) using , and HD.
In these calculation and conversion, any distortions of fisheye lens and the curvature of ground surface are left out of considerations.
3.1 Calculation of zenith and azimuth angles
Calculation of zenith and azimuth angles at any hemisphere image coordinates can be shown in equation (4) and (5).
R (4)
when 0 ≤ < 180,
cos R
when 180 ≤ < 360,
cos R
(5)
where ui, vi ; Image coordinates of column and row (pixels)
uo, vo ; Image centre coordinates (pixels) i ; Zenith angle (degrees) at (ui, vi) i ; Azimuth angle (degrees) at (ui, vi)
In this study, the image size of hemispherical area has 1650 pixels and 1650 lines. Therefore the radius of circle (R) is 825 pixels and the image centre coordinate (uo, vo) is (824, 824) in case of the image upper left coordinates as (0, 0).
3.2 Cloud area conversion to map coordinates
For each pixel classified as cloud area on whole sky image, the projected cloud area on the ground can be converted to map Figure 1. The flowchart of cloud, blue sky and sun
discrimination by whole sky imageries Whole Sky I mage ( t)
Sky I ndex (SI ) Brightness I ndex (BI )
SI image ( t) BI image( t)
Counting the frequency of SI and BI combination’s pixel Masking for out of area Masking for out of area
Classifying Sun, Cloud, and Blue sky areas by SI &BI threshold
Sky classified image( t)
Determination of SI &BI threshold for dividing sun,
cloud and blue sky areas BI = e - 9* SI
International Archives of the Photogrammetry, Remote Sensing and Spatial Information Sciences, Volume XXXIX-B8, 2012 XXII ISPRS Congress, 25 August – 01 September 2012, Melbourne, Australia
coordinates using zenith () and azimuth () angles by given any cloud heights approximately. Generally, lower clouds such stratocumulus appears from near the ground to 2km and in case of cumulus, it appears from 0.6 to 6km.
The conversion from the each pixel (ui, vi) of cloud area on whole sky image to map coordinates (xi, yi ) can be shown in equation (6) and (7).
tan (6)
sin x
cos y (7)
where HDi ; the horizontal distance from ground-based cloud observation point (m)
CHapr ; approximate cloud height (m)
xi, yi ; map coordinates of image coordinates ui, vi (m) xo, yo ; map coordinates of ground-based cloud observation point (m)
4. RESULT AND DISCUSSSION
As one of experiment, we examine to compare and overlay with several whole-sky images of different cloud types and those synchronous Terra & Aqua/ MODIS images observed in central Kyoto, Japan. The grand-based cloud observation point is located at (N35.018243°, E135.768278°). In this experiment, we use UTM (Zone53N, WGS84) as map projection.
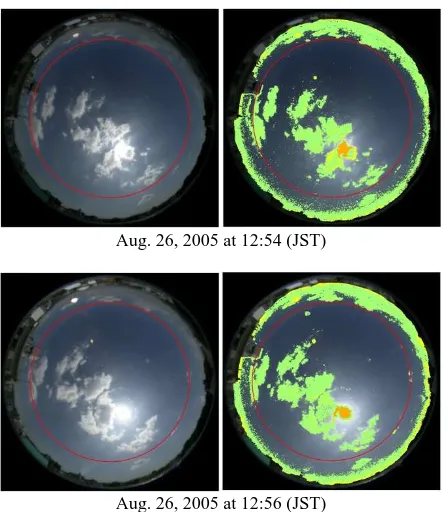
Figure 2 shows one of the results of cloud discrimination from whole sky images taken at 12:54 and 12:56 on Aug. 26th 2005.
Red circle corresponds to the area of zenith angle less than 65 degrees. Cloud type is recognized as cumulus of small size visually. Also cloud type such cumulus and stratocumulus have low SI, very close to SI = 0, and high BI values digitally. Outside of this red circle seems to overestimate cloud coverage because of the long pass of atmospheric layer from the view at large zenith angle. Here, the target area is in less than 65 degrees of zenith angle.
Figure 3 shows Aqua/ MODIS observed at 12:55(JST) on Aug. 26th 2005 as one of the sample satellite images in this experiment.
There are not seen so much cloud coverage around the observation point by comparing with northern part of this MODIS image. However, it is certainly confirmed the clouds existence in the red circle visually.
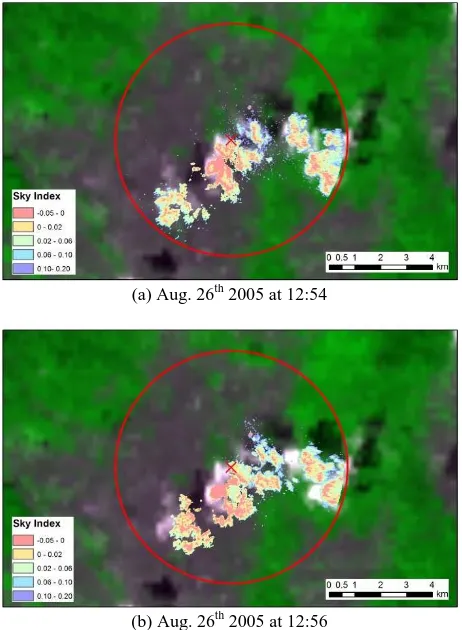
For overlaying clouds area, the horizontal distribution of cumulus clouds area discriminated from whole sky image are calculated in four cases of CHapr = 600, 1000, 1500, 2000m by considering general cloud height of cumulus firstly. After calculations, it is the best fit to both ground and satellite-based images in the case of CHapr = 2000m.
Figure 4 shows the results of overlaying the cumulus clouds area discriminated from whole sky images taken at 12:54 and 12:56 (figure 2) to Aqua/ MODIS observed at 12:55 on Aug. 26th 2005 (figure 3). Legend colors show SI value calculated from whole sky image. SI in almost clouds area shows very low. Aug. 26, 2005 at 12:54 (JST)
Aug. 26, 2005 at 12:56 (JST)
Figure 2. Results of sky classified image (right) from whole sky images (left) of 2-minutes different images.
Cloud discrimination area is painted as light green on whole sky image. Red circle shows the area of zenith angle less than 65
degrees.
Figure 3. Aqua/ MODIS VIS (ch.1) and NIR (ch.2) composite image (RGB: ch.1,2,1) with 250m ground resolution observed at
12:55(JST) on Aug. 26th, 2005.
Red x is the point of ground-based cloud observation. Red circle indicates the overlaying area with zenith angle less than 65
degrees in case of HD calculation as CHapr = 2000m. International Archives of the Photogrammetry, Remote Sensing and Spatial Information Sciences, Volume XXXIX-B8, 2012
XXII ISPRS Congress, 25 August – 01 September 2012, Melbourne, Australia
Comparing with two figures of two minutes difference, there is no big movement on the image. Measured approximate distance of movement for two minutes on two figures is about 500m (velocity: 4-5m/s). As one of others applications of the overlaying clouds area to satellite image, there is clouds motion analysis by calculating the moving distance for two minutes in this case. For more high accuracy of horizontal clouds distribution, cloud height data with high accuracy is needed. As for the measurement of cloud height with high accuracy, Seiz et al. (2002) have developed the method to estimate cloud bottom height by digital photogrammetric technique using two more cameras.
Furthermore, there is another application for cloud fraction analysis of different cloud fraction definitions. Satellite-based observation derives cloud fraction which means the horizontal area fraction covered by clouds as viewed from nadir, it corresponds clouds horizontal distribution on satellite image. On the other hand, ground-based cloud observation using whole sky camera derives the cloud fraction as hemispherical sky covered by clouds. It is the definition of ground meteorological studies, so-called cloud amount. As for the calculation of both defined cloud fractions, Kassianov et al. (2005) have demonstrated using hemispherical ground-based observation. Also, there is the possibility of this study on the assumption that this ground-based clouds observation method is applied across a wide area. For the validation of satellite-based clouds and earth surface observation, it seems that this observation system is suitable to set up at many sites, and also useful to collaborate with the existing ground-based observation networks such Asia Flux, AERONET and SKYNET etc. The proposed observation method and its applications should be connected to satellite
products with high quality by implementation of sky and clouds observation covering a wide area.
5. CONCLUSION
We proposed the simple ground-based observation method to discriminate clouds on whole sky image and one of extensions to the satellite-based observation by overlaying both ground and satellite-based images.
Through this study, we confirmed that our developed ground-based cloud observation method is useful to discriminate cloud existence and area of cloud coverage, and to overlay with satellite-based cloud image. Also, this ground-based cloud observation can be expanded into wide area and set many observation points for application to various satellite images including geostationary satellites with very high temporal resolution.
References
Calbo J. and Sabburg J., 2008. Feature Extraction from Whole-Sky Ground-Based Images for Cloud-Type Recognition.
Journal of Atomospheric and Oceanic Technology, 25, pp.3-14.
Clement C. A., Burgman R. and Norris R. J., 2009. Observational and Model Evidence for Positive Low-Level Cloud Feedback, SCIENCE, 325, pp.460-464.
Freedman J. M., Fitzjarrld D. R, Moore K. E., and Sakai R. K., 2001. Boundary Layer Clouds and vegetation - Atmosphere Feedbaks. Journal of Climate, 14, pp.180-197.
Heinle A., Macke A. and Srivastav A., 2010. Automatic cloud classification of whole sky images. Atmospheric Measurement
Techniques Discussions, 3, pp.269-299.
Kassianov E., Long N. C. and Ovtchinnikov M. (2005): Cloud Sky Cover versus Cloud Fraction: Whole-Sky Simulation and Observations. Journal of Applied Meteorology, 44, pp.86-98.
Seiz G., Baltsavias E.P., and Gruen A. (2002): Cloud Mapping from the Ground: Use of Photgrammetric Methods.
Photogrammetric Engineering & Remote Sensing, 68(9),
pp.941-951.
Tsuchida S., Nishida K., Iwao K., Kawato A., Oguma H. and Iwasaki A., 2005. Phenological Eyes Network for Validation of Remote Sensing Data (abstract only). Journal of The Remote
Sensing Society of Japan, 25 (3), pp.282-288.
Yamashita M. and Yoshimura M., 2008. Development of Sky Conditions Observation Method using Whole Sky Camera (abstract only). Journal of the Japan Society of Photogrammetry
and Remote Sensing, 47(2), pp.50-59.
(a) Aug. 26th 2005 at 12:54
(b) Aug. 26th 2005 at 12:56
Figure 4. Overlaying clouds area discriminated from whole sky image to MODIS image.
International Archives of the Photogrammetry, Remote Sensing and Spatial Information Sciences, Volume XXXIX-B8, 2012 XXII ISPRS Congress, 25 August – 01 September 2012, Melbourne, Australia