LIGHT-WEIGHT MULTISPECTRAL UAV SENSORS AND THEIR CAPABILITIES FOR
PREDICTING GRAIN YIELD AND DETECTING PLANT DISEASES
S. Nebiker, N. Lack, M. Abächerli, S. Läderach
FHNW University of Applied Sciences and Arts Northwestern Switzerland, Institute of Geomatics Engineering, Gründenstrasse 40, 4132 MUTTENZ, Switzerland - (stephan.nebiker, natalie.lack)@fhnw.ch
Commission ICWG I/Vb
KEY WORDS: UAV, multispectral, multi-temporal, agriculture, plant vitality, NDVI, predicting yield
ABSTRACT:
In this paper we investigate the performance of new light-weight multispectral sensors for micro UAV and their application to selected tasks in agronomical research and agricultural practice. The investigations are based on a series of flight campaigns in 2014 and 2015 covering a number of agronomical test sites with experiments on rape, barley, onion, potato and other crops. In our sensor comparison we included a high-end multispectral multiSPEC 4C camera with bandpass colour filters and reference channel in zenith direction and a low-cost, consumer-grade Canon S110 NIR camera with Bayer pattern colour filters. Ground-based reference measurements were obtained using a terrestrial hyperspectral field spectrometer. The investigations show that measurements with the high-end system consistently match very well with ground-based field spectrometer measurements with a mean deviation of just 0.01-0.04 NDVI values. The low-cost system, while delivering better spatial resolutions, expressed significant biases. The sensors were subsequently used to address selected agronomical questions. These included crop yield estimation in rape and barley and plant disease detection in potato and onion cultivations. High levels of correlation between different vegetation indices and reference yield measurements were obtained for rape and barley. In case of barley, the NDRE index shows an average correlation of 87% with reference yield, when species are taken into account. With high geometric resolutions and respective GSDs of down to 2.5 cm the effects of a thrips infestation in onion could be analysed and potato blight was successfully detected at an early stage of infestation.
1. INTRODUCTION
1.1 Background and Motivation
Over the last few years, mini and micro UAVs (unmanned aerial vehicles) in combination with cost-efficient and light-weight RGB cameras have become a standard tool for typical photogrammetric tasks. Multispectral or thermal sensors, in contrast, have long been too heavy and bulky for the use in small UAVs. However, using early research prototype sensors, the great potential of UAV-based high-resolution remote sensing was demonstrated almost a decade ago (Annen et al., 2007; Nebiker et al., 2008). Recently, first light-weight multispectral sensors for micro-UAVs have become commercially available. The spectrum ranges from simple low-cost consumer-grade multispectral cameras to complex high-end multi-sensor systems. In our article, we investigate the capabilities of such commercial sensors as well as their applicability to selected practical agronomical tasks.
1.2 Related Works
Numerous recent publications address UAV platforms as such. Colomina and Molina (2014), for example, give a good overview of UAV for photogrammetry and remote sensing. Zecha et al. (2013) provide a valuable categorisation of mobile sensor platforms and sensors in the areas of agronomical research and precision farming. Numerous recent research efforts focussed on the development and validation of specific imaging sensors for civilian mini and micro UAVs. This started with early light-weight multispectral sensors (Nebiker et al.,
2008) with an increasing focus on hyperspectral sensors (Mäkynen et al., 2012; Suomalainen et al., 2014).
In contrast, research on the application of UAV remote sensing to specific agronomical problems and tasks has been relatively limited but is now rapidly catching up with the increasing availability of suitable sensors. Salami et al. (2014) give a good overview of recent experiments applying UAVs to the remote sensing of vegetated areas. While earlier UAV research in agronomy primarily focused on geometric aspects, e.g. by determining crop surface models, these investigations were recently extended to incorporate multispectral and hyperspectral data (e.g. Bendig et al., 2015). For our UAV-based detection of plant diseases, the development and investigation of suitable spectral indices as by Mahlein et al. (2013) become an important issue. The following paper builds upon earlier research by Läderach (2014) and Nebiker et al. (2015).
1.3 Goals and Structure of the Paper
The main goals of this paper were to investigate the characteristics and performance of a new generation of light-weight multispectral sensors for UAVs in a real-world environment and to evaluate their suitability for typical tasks in agronomical research and precision farming. The investigated cameras included a high-end multi-head system and a consumer-grade multispectral camera which can be operated with a fixed-wing micro UAV. The agronomical investigations were carried out in cooperation with the Agronomical Centre Liebegg (Switzerland). The main research questions were: 1) Are there significant benefits from using expensive high-end sensors over low-cost systems? 2) What is the suitability of The International Archives of the Photogrammetry, Remote Sensing and Spatial Information Sciences, Volume XLI-B1, 2016
UAV-based multispectral remote sensing for a) yield estimation and b) plant disease detection both in agronomical research and agronomical production?
For this purpose, we first introduce the sensor platform and the multispectral sensors with their different characteristics in Section 2. We then describe the test areas with the respective agronomical questions and reference data in Section 3. In Section 4 we present the sensor comparison. This is followed by yield estimations for different types of crops with different kinds of treatment in Section 5. Finally, we present first results from plant vitality assessments and disease detection in Section 6, followed by conclusions and an outlook.
2. UAV PLATFORM AND SENSORS
2.1 UAV Platform
The following investigations were carried out using micro UAVs of the type eBee by senseFly. In comparison to multicopter UAVs, these popular light-weight fixed-wing UAVs (Figure 1 and Table 1) can be operated fully autonomously, require hardly any piloting skills and are ideal for covering relatively large areas.
Figure 1. eBee micro UAV by SenseFly
Weight (incl. camera) approx. 700 g
Wing-span 96 cm
Table 1. Specifications of the eBee UAV. Legend: (*) sensors with autonomous power supply,
(**) prototype sensor without own power supply.
2.2 Multispectral Sensors
The following sensors were investigated: the low-cost system Canon S110 NIR (Figure 2) and the high-end system senseFly multiSPEC 4C in a prototype version in 2014 and a final version in 2015 (Figure 3). The low-cost system is based on the popular compact camera Canon S110 with modified Bayer exactly co-registered colour channels but the disadvantage of overlapping spectral sensitivities of the individual colour
channels (Figure 2 and Table 2). Contrary to this, the multiSPEC 4C is a multi-head system with four optical lenses and four monochromatic CCD sensors. Here the colour separation takes place at the optical units via band-pass interference filters with well-defined central frequencies and bandwidths (Figure 3 and Table 2). Additionally, the multiSPEC features a zenith-looking panchromatic sensor. It provides a reference channel for normalising the reflected radiation registered by the four nadir-looking spectral sensors.
2014).
NIR und deren Figure 2.Canon S110 NIR with normalised sensitivity of
channels G, R and NIR in [%]
Figure 3. multiSPEC 4C with normalised sensitivity of channels, G, R, Red Edge and NIR [%]
Table 2. Overview of investigated UAV multispectral sensors
2.3 Field Spectrometer
For spectral reference measurements, a calibrated portable field spectrometer HandySpec Field by tec5 was used. It provides hyperspectral point measurements in the range of 360-1000 nm with a spectral resolution of 3.3 nm. The field spectrometer also features a zenith-directed reference channel.
3. INVESTIGATION AREAS
3.1 Test Areas and Agronomic Questions
Test fields of the Agricultural Centre Liebegg (Switzerland) with different crop cultures have been available for technical and agricultural scientific investigations.
In grain crops and rape two different treatment methods were applied which define what measures and methods farmers are allowed to use in order to receive so-called 'direct payments' from the government. In 'Extenso' practice, extensive crop cultivation methods are used, meaning that no growth regulators, fungicides or insecticides are allowed (FOAG, 2015a). The 'ÖLN' ('Ökologischer Leistungsnachweis') practice uses cultivation methods, whereas pesticides and fertilizer can be used but are limited to certain amounts consistent with ecological goals (FOAG, 2015b).
In a first study carried out in 2014, a rape test field was covered (Figure 4). The agronomical questions included the determina-tion of optimal harvesting time as well as crop yield estimates related to species and treatment. At the same time, this study provided the basis for the sensor comparisons in Section 4.
Figure 4. Rape species study with fungicide treatment (orange, left) and without treatment (blue, right).
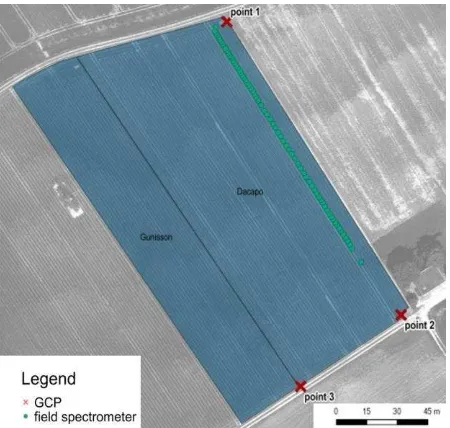
Figure 5. Onion field (15.07.14) with spectrometer measure-ments (light green dots) and GCP positions (red crosses).
In a second study area, different experiments could be covered with each flight during late spring and summer 2014. An onion test field (Figure 5) was captured with two flights in order to study the potential of very high-resolution UAV-based remote
sensing in speciality crops and vegetation farming. Among the other experiments were a potato species study (Figure 6) with potato blight monitoring and with the question of the ideal timing for crop desiccation. In each study area, 3 to 7 ground control points with a horizontal and vertical point accuracy of approx. 2 cm were established.
Figure 6. Potato field (31.07.14) with field spectrometer measurements (green dots) and GCP positions (green crosses).
Figure 7. Barley test field with plots of 20 different species and two different treatments: Extenso (bottom) and ÖLN (top)
The crop vitality studies were commenced in 2015 with new wheat and barley test sites and with the final commercial multiSPEC 4C sensor. Based on the experiences from 2014, three flight campaigns were carried out during the main growth period from May to June. The barley investigations were carried out on the test site shown in Figure 7. It consists of a field with The International Archives of the Photogrammetry, Remote Sensing and Spatial Information Sciences, Volume XLI-B1, 2016
20 different species and two treatment techniques. A total of six test plots were available per species, three for each treatment method. The lower half of the barley plots shown in Figure 7 had been treated extensively according to the Extenso standard, the upper half had been treated more intensively following the ÖLN rules.
3.2 Flight Campaigns and Data Processing
A total of more than 30 imaging flights were carried out, each with a duration of 20-40 minutes and approx. 40-900 images per flight. The ground sampling distance (GSD) was between 10 cm and 2.5 cm. The multiSPEC 4C prototype used in the early experiments still had some limitations due to its reduced sensor dimensions, reduced sensor resolution and the very high power consumption (Läderach, 2015). While the first two issues were resolved with the final version of the multiSPEC sensor, high power consumption remains an issue. Flight missions during hot days in summer 2015 with temperatures around 40°C also showed that the multiSPEC camera is prone to overheating.
The image data was processed using the supplied standard software Postflight Terra 3D. For remote sensing tasks, this processing encompasses the following steps: image orientation / bundle block adjustment; generation of a surface model by means of dense image matching; orthoimage generation and mosaicking; the calculation of reflectance maps and the subsequent deviation of vegetation indices. In case of the multi-head multiSPEC sensor, the actual processing is preceded by a radiometric calibration of the individual channels, which is carried out using images of a special calibration table. The achievable geometric accuracies of the image orientation have not been the focus of this study. Nevertheless, sigma0 values of 0.2-0.3 pixels, equivalent to 1.5-4 cm in object space were consistently obtained (Nebiker et al, 2015).
4. COMPARISON OF SENSORS
In order to evaluate the performance of the different multispectral sensors under real-world conditions, rather than in a laboratory setting, several field tests with ground-based hyperspectral reference measurements were carried out. The following different characteristics of our multispectral sensors influenced the comparison of the different measurements: The multiSPEC 4C camera delivers reflectance values for
the different channels which a) have been calibrated using the above mentioned radiometric calibration targets and b) have been normalized using the simultaneous measurements of the panchromatic reference channel in zenith direction. The S110 NIR camera provides R, G and NIR readings
from a single CCD chip, thus avoiding inter-channel variations. But the readings are fully dependent on scene illumination and camera settings such as exposure and aperture.
Due to these different characteristics, multiple vegetation indices were employed for comparing the two sensors and their measurements. First, these vegetation indices are based on reflectance ratios and do not rely on calibrated or normalized reflection values. Second, these indices provide the basis for many practical applications, both in terms of biomass or yield estimates as well as plant vitality assessment.
For a comparison of the S110 NIR the Normalized Difference Vegetation Index NDVI [NDVI = (NIR – R) / (NIR + R)] was
used. Other indices such as the Green Normalized Difference Vegetation Index GNDVI [GNDVI = (NIR – G) / (NIR + G)] and the Normalized Difference Red Edge Index NDRE [NDRE = (NIR – RE) / (NIR + RE)] have been used to evaluate additional sensors not covered in this paper (see Läderach, 2015). The respective index values derived from field spectrometer measurements served as reference. At the time, only a single field spectrometer reading per plot had been taken.
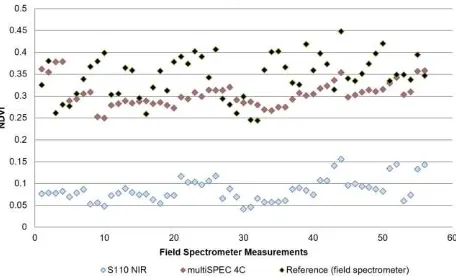
A first sensor investigation was carried out using observations of the rape test field shown in Figure 4. A comparison of the resulting NDVI values of the multiSPEC 4C prototype and the Canon S110 NIR sensors in relation to the spectrometer reference are shown in Figure 8 and summarized in Table 3.
Figure 8. NDVI values of the multiSPEC 4C prototype, S110 NIR and field spectrometer for identical rape test plots
Index NDVI
Sensor multiSPEC 4C (Proto) S110 NIR
Mean deviation -0.040 -0.260
Standard deviation 0.057 0.048
Table 3. Comparison of multispectral sensors with field spectrometer measurements based on derived NDVI values.
The values of the multiSPEC 4C sensor prototype correspond well with the terrestrial reference data with a mean deviation of -0.040 NDVI units. However, the comparison with the low-cost S110 NIR sensor reveals a significant bias of -0.260 NDVI units (LÄDERACH, 2015). These too low values are primarily caused by the overlapping spectral channels (Figure 2). It should be noted that the NDVI values from the spectrometer reference measurements exhibit a significantly higher noise level than the values of the two multispectral sensors. This can most likely be attributed to the fact that the spectrometer values are based on a single point measurement per plot, in contrast to the airborne multispectral measurements which were averaged over the sampling areas of approx. 1m x 1m. Thus, these airborne measurements are expected to be more representative for entire test plots. The good agreement between the multiSPEC 4C and the spectrometer measurements with a small mean deviation indicate that this sensor could be used without a need for ground-based spectral reference measurements.
A second sensor performance study was carried out in 2015 with the goals of investigating the final commercial multiSPEC 4C sensor and of verifying the results from the first spectrometer measurements per plot were taken. These The International Archives of the Photogrammetry, Remote Sensing and Spatial Information Sciences, Volume XLI-B1, 2016
spectrometer measurements were averaged per plot, to provide representative figures for the test plots.
The results of the 2015 sensor study are illustrated in Figure 9 and summarized in Table 4. They show an excellent agreement between the NDVI values obtained from the commercial multiSPEC 4C measurements and the reference values with a mean deviation of -0.014 NDVI units and a standard deviation of 0.045 units. The tests also reveal an almost perfect correlation between the two data sets of 0.99.
Figure 9. Average NDVI values per plot from MultiSPEC 4C measurements (blue) and field spectrometer measurements (red)
Index NDVI
Sensor multiSPEC 4C (commercial)
Mean deviation -0.014
Standard deviation 0.045
Correlation with reference 0.999
Table 4. Comparison of the multiSPEC sensor with field spectrometer measurements based on derived NDVI values.
The results of this second experiment indicate that the final multiSPEC 4C sensor delivers equivalent or even better results than the prototype used in the 2014 experiments. It could further be confirmed that the noise in the reference data observed in 2014 has effectively been removed with the new sampling strategy applied in 2015. While all crop plots (1-4) show almost identical results with slightly higher reference values, we see an inverse effect for the driveway plot number 5. This could be caused by the fact that the extents of this plot were poorly defined.
5. CROP YIELD ESTIMATION
Several of the agronomical studies presented in this paper were focussed on the effects of different species and treatment methods on crop yield. In all following experiments, crop yield data for each individual plot obtained with a special harvester was made available by the Agronomical Center Liebegg. This harvested crop yield data served as reference for the subsequent remotely sensed crop yield experiments.
5.1 Rape Yield Estimation
First experiments on rape yield estimation were carried out in summer 2014 using the rape species and treatment test field shown in Figure 4. Unfortunately, the test flight campaign had been delayed due to the bad weather conditions in summer 2014 and could only be conducted on the 16th of July, a few days before harvest on the 28th of July.
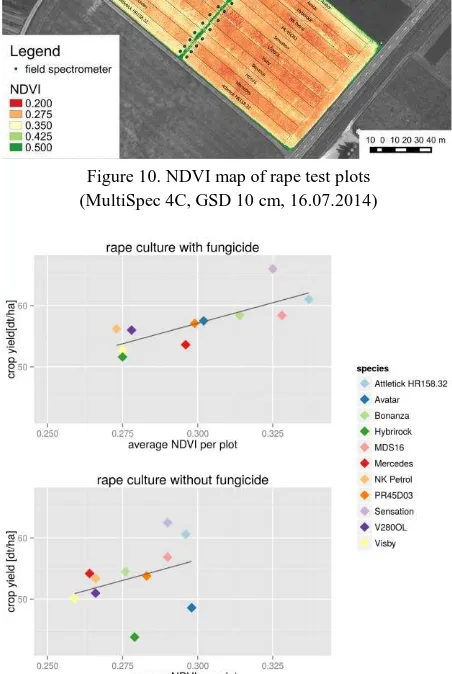
Figure 10. NDVI map of rape test plots (MultiSpec 4C, GSD 10 cm, 16.07.2014)
Figure 11. Crop yield [dt/ha] (equiv. to 100 kg/ha) in relation to the mean NDVI values per plot by species with fungicide
treatment (top) and without treatment (bottom).
Läderach (2015) had used this data set to test several different vegetation indices, including NDVI, NDRE and GNDVI, and their correlation to the reference data. In her studies she found the NDVI and the GNDVI to deliver similar results which were consistently better than those obtained with the NDRE. Figure 10 represents an NDVI map of the test area. The results showing the observed NDVI values in relation to the reference yield data are depicted in Figure 11 – with treated plots at the top and untreated plots shown at the bottom. The correlation between crop yield and NDVI values across all species was 0.78 for treated plots and 0.35 for untreated plots.
Despite the late flight date with a nearly ripe crop, significant vitality differences between individual rape species and between treated and untreated crop could still be detected. Apparently, treatment with fungicides leads to a prolonged plant activity up to harvest time. However, it should be noted that a comparison across multiple species with only a single 'measurement' is problematic since individual crop species can exhibit largely different spectral characteristics (see also barley experiments in The International Archives of the Photogrammetry, Remote Sensing and Spatial Information Sciences, Volume XLI-B1, 2016
the following section). Thus, further species-specific investi-gations with multiple plots per species would be required.
5.2 Barley Yield Estimation
The barley test field described in Section 3.1 was covered by two flight campaigns using the commercial multiSPEC 4C camera: one on the 21st and one on the 28th of May 2015. Index maps using different vegetation indices were calculated, including NDVI, GNDVI and NDRE. The NDVI index map with masked test plots for the 28th of May 2015 is shown in Figure 12. Table 5 summarizes correlation coefficients between reference yield measurements and the three vegetation indices for different data subsets which have been extracted by the following criteria: a) by treatment (including the measurements for all species), b) by species (incorporating the measurements for both treatments). In addition to a mean correlation value across all species, the table also contains the specific results for four selected species.
Figure 12. NDVI-average values (multiSPEC 4C) for the barley plots 28th May 2015 (ÖLN above, Extenso below)
The summary in Table 5 shows that in the case of barley the correlation between yield and vegetation indices and thus the yield prediction quality largely depend on individual species. Only the NDRE index shows a species-independent correlation of 60% (21st May) or better (68% for 28th of May). When looking at correlations for individual species, there are considerable differences. Some species such as California show a poor correlation with the NDVI (0.25) and GNDVI (0.08) indices and only a fair correlation of 0.68 with the NDRE values. Others such as KWS 6-329 show excellent correlations of better than 0.91 with all three indices. Yet others such as KWS Kosmos or KWS meridian show excellent agreements with the NDVI and NDRE and fair to poor correlations with the
GNDVI. If barley species are known and correlations are considered on a per species basis, then the NDRE delivers a very good average correlation of 0.87 across all species.
Correlation Coefficients
between yield an … NDVI GNDVI NDRE
By Treatment (all species)
ÖLN 0.21 0.26 0.24
Extenso 0.23 0.22 0.30
By Species (both treatments)
Mean (all species) 0.42 0.17 0.68
Example species 1: California 0.25 -0.08 0.68 Ex. species 2: KWS 6-329 0.91 0.96 0.92 Ex. species 3: KWS Kosmos 0.92 -0.08 0.99 Ex. species 4: KWS Meridian 0.96 0.57 0.98 Avg. correlation of all species 0.68 0.13 0.87
Table 5. Summary of correlation between crop yield and respective index values (for the 28th of May 2015) It should be noted that the statistical basis for barley is not very large (with 6 plots per species, of which only 3 per treatment). Thus, further investigations with more plots per species would be recommended.
6. DETECTION OF PLANT DISEASES
In summer 2014 the multiSPEC 4C prototype was only available for a short period of time. Therefore, the low-cost camera Canon S110 NIR was used for further studies of vegetation stress induced by different plant diseases and for investigations of applications requiring very high-resolution remote sensing data.
6.1 Thrips in Onion Cultures
The original goal of a study on onion cultures was to investigate the potential of very high resolution remote sensing data in assessing the vitality of vegetation, in particular vegetable such as carrots or onions with very thin foliage. It turned out that these first high-resolution test flights helped to monitor a thrips infestation within the test field. Thrips are tiny, slender insects with fringed wings and a typical length of about 1 mm, which makes them very difficult to detect in the field. Thrips feed on plants by puncturing them and sucking up the contents.
The onion test field introduced in Figure 5 was covered with two flight campaigns on the 16th and 31st of July 2014. On the first date, imagery was acquired with GSDs of 10 cm, 5 cm and 2.5 cm; on the second date with a GSD of 2.5 cm only. NDVI maps with a 2.5 cm GSD acquired with the S110 NIR camera for the two flight campaigns are shown in Figure 13.
Läderach (2015) already showed the advantages of the 2.5 cm image resolution over the 5 cm resolutions in improving the discrimination between vegetation foliage and background. This allows to effectively filter the background from the index map and to obtain significantly better plant vitality information.
In the index map in Figure 13 we observe a clear distinction between the two species Gunisson (left) and Dacapo (right), in particular for the second observation epoch. The sharp decrease of the NDVI values between mid and end of July in the Dacapo field can be attributed to a thrips infestation. It can be assumed, that a shorter observation interval (e.g. of one flight per week), would have helped to detect the infestation at an earlier stage and thus might have helped to facilitate treatment and to minimize the effects on yield and quality.
Figure 13. NDVI of an onion field infested by thrips on 16th July (top) and 31st July 2014 (bottom); green = vital plants, red
= affected plants (Canon S110 NIR, GSD 2.5 cm).
6.2 Potato Blight
The original goal of using UAV-based remote sensing in the potato experiment introduced in Section 3.1 was to investigate whether it is possible to remotely determine the ideal time for crop desiccation in order to obtain optimal harvesting results.
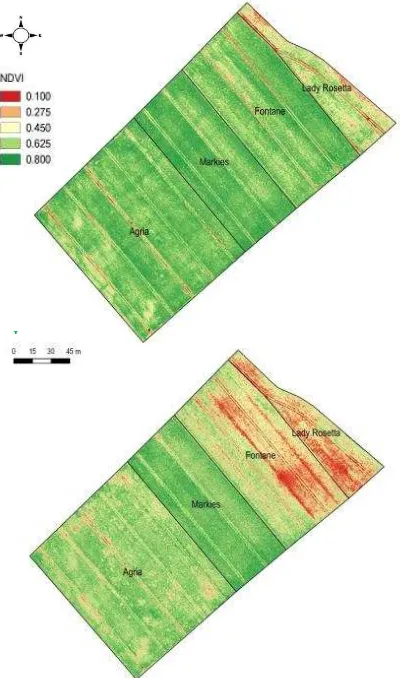
The test field was covered twice with flights on the 17th and 31st of July 2014 with GSDs of 10 cm and 5 cm. On the first date the multiSPEC 4C and the S110 NIR sensors were used, on the second date only the S110 NIR was available. NDVI maps of the potato test field with a GSD of 5 cm and acquired with the S110 NIR camera are shown in Figure 14.
The index maps show clear distinctions between the four species. In particular, the late ripening species Markies in the middle of the field shows the highest vitality during both flight missions. A significant decrease in plant vitality between the two flights can be observed in the other three species with earlier ripening. These first results indicate that the ripening process can indeed by monitored, if the species is taken into account.
The multispectral image and the NDVI map reveal some distinct features and irregular patterns, which are caused by a potato blight infestation in the Fontane and Lady Rosetta species. The original sites of infestation can be clearly located in the index map of the first flight in mid-July (red spots in Figure 15, left)
and were confirmed by the farmer. The expansion of the disease could be monitored with the second flight mission two weeks later. The NDVI map (Figure 15, right) shows striped expansion patterns (marked by white dashed lines) running in parallel to the tractor lanes. In consultation with the farmer this could be tracked down to too short application arms, leading to gaps in the fungicide treatment. The experiments clearly demonstrate the great potential for early detection of potential potato blight infestation sites.
I
Figure 14. NDVI of potato fields with developing potato blight (red spots) monitored on the 17th of July (top) und 31st of July
2014 (bottom) (Canon S110 NIR, GSD 5 cm).
Figure 15. Detail view of potato field NDVI map highlighting the three original sites of potato blight infestation (dotted
circles) and the subsequent spreading of the infestation.
7. CONCLUSIONS
In our investigations on the performance of new light-weight multispectral sensors for micro UAVs we found some significant differences between the high-end multiSPEC 4C camera and the low-cost consumer-grade S110 NIR camera. In The International Archives of the Photogrammetry, Remote Sensing and Spatial Information Sciences, Volume XLI-B1, 2016
our experiments we used different test fields and compared the vegetation indices obtained from the different multispectral UAV sensors with reference measurements from a hyperspectral field spectrometer. It could be shown that the values obtained from the high-end system consistently agree very well with the reference values with a mean difference in the order of 0.01-0.04 NDVI values. The values obtained with the low-cost system exhibited significant biases but showed a reasonable correlation with the values of the high-end system. The excellent results of the high-end system can be attributed to the clear separation of the spectral channels by the interference filters and the availability of a reference channel in zenith direction. All our experiments indicate that the high-end multiSPEC 4C system can be used without terrestrial spectral reference measurements. On the other hand, low-cost sensors such as the Canon S110 NIR with their much higher spatial resolution are very interesting for very high-resolution remote sensing and for the qualitative monitoring of in-field variability – including the early detection of plant diseases.
In the subsequent studies on UAV-based yield estimates, rape and barley crops were investigated. In the experiments on rape we found high correlations between NDVI and GNDVI values and the respective yield reference data. These results were obtained despite a very late flight which had been carried out shortly before harvest. It was further shown that fungicide treatment in rape appears to prolong plant activity. In subsequent yield estimation experiments with barley, different vegetation indices were investigated. The NDRE showed the best performance with an average correlation of 60-68% between index values and reference yield measures across all species. It was also shown that species-specific investigations can provide excellent results with correlations better than 95% and an averaged correlation for all species of 87%. In conclusion, both experiments on rape and barley indicate that information on planted species should be considered for optimal yield estimation.
In the second series of experiments on plant vitality assessment and plant disease detection, very high spatial resolutions down to the level of a few centimetres were shown to be useful in specialty crops, in particular in vegetable farming. Using multispectral imagery with a GSD of 2.5 cm, for example, high-quality vegetation index maps could be created for onion cultures despite their thin-leafed foliage. Based on these high-resolution index maps it was possible to monitor the spreading of a thrips infestation. In a second experiment on potato crop, we were able to detect the original spots of a potato blight infestation. It was also possible to monitor its spreading along narrow corridors which had been omitted from fungicide treatment. All experiments provided valuable further informa-tion on optimal times and intervals for UAV-based monitoring.
Emerging light-weight multi-head multispectral cameras for UAVs (e.g. Parrot Sequoia) combining a high-resolution RGB sensor with individual multispectral sensors combine the strengths of the investigated two camera types. These sensors are very promising for a number of reasons. Their high spatial resolution is valuable for geometric aspects including bundle adjustment and the extraction of geometric parameters such as crop surface models. Additionally, it allows to apply UAV-based remote sensing to cost-intensive speciality crops and vegetable cultivations with thin-leafed foliage. The individual multispectral sensors with their superior interference filters and the reference channel in zenith direction, on the other hand, ensure a high quality of the spectral measurements and remove the need for ground-based spectral reference measures. Thus,
they will enable long-term time series and highly efficient quantitative studies, e.g. on a per-species or per-treatment basis with numerous small test plots.
ACKNOWLEDGEMENTS
We acknowledge the support by the Agronomical Center Liebegg for providing the various field tests, the corresponding agronomical reference data and for their agronomical advice on the interpretation and validation of the results.
REFERENCES
Annen, A., Nebiker, S., Oesch, D., 2007. Einsatz von Mikro- und Minidrohnen für Fernerkundungsaufgaben in der agrochemischen Forschung und Entwicklung. DGPF Tagungsband Nr. 16, pp. 399–406.
Bendig, J. et al., 2015. Combining UAV-based plant height from crop surface models, visible, and near infrared vegetation indices for biomass monitoring in barley. Int. Journal of Applied Earth Observation and Geoinformation, 39, pp.79–87. Colomina, I., Molina, P., 2014. Unmanned aerial systems for photogrammetry and remote sensing: A review. ISPRS Journal of Photogrammetry and Remote Sensing, 92, pp. 79–97. FOAG Federal Office for Agriculture, 2015a. Beitrag für die extensive Produktion von Getreide, Sonnenblumen, Eiweiss-erbsen, Ackerbohnen und Raps (Extenso)“. Schweizerische Eidgenossenschaft - Bundesamt für Landwirtschaft BLW. www.blw.admin.ch [last accessed: 04.12.2015]
FOAG Federal Office for Agriculture, 2015b. Ökologischer Leistungsnachweis. Schweizerische Eidgenossenschaft - Bundesamt für Landwirtschaft BLW. http://www.blw.admin.ch [last accessed: 04.12.2015]
Läderach, S., 2015. Fernerkundung in der Agronomie mit Micro-UAV und neuen leichtgewichtigen Multispektralsenso-ren. Masterthesis. Fachhochschule Nordwestschweiz, Muttenz. Mahlein, A.-K. et al., 2013. Development of spectral indices for detecting and identifying plant diseases. Remote Sens. Environ, 128, pp. 21–30.
Mäkynen, J. et al., 2012. Multi- and hyperspectral UAV ima-ging system for forest and agriculture applications. Druy, Mark A.; Crocombe, Richard A. (eds.) SPIE 8374, Next-Generation Spectroscopic Technologies V, 837409, pp. 837409–837409–9.
Nebiker, S., Annen, A., Scherrer, M., Oesch, D., 2008. A Light-weight Multispectral Sensor for Micro UAV – Opportunities for Very High Resolution Airborne Remote Sensing. International Archives of the Photogrammetry, Remote Sensing and Spatial Information Sciences. Beijing, China: ISPRS, pp. 1193–1200.
Nebiker S., Läderach S., Matti, E., 2015. Neue leichtgewichtige Multispektralsensoren für Micro-UAVs – Sensorvergleiche und Leistungsuntersuchungen in der Agronomie. DGPF Tagungsband 24/2015, Köln: 35-44.
Salamí, E., Barrado, C., Pastor, E., 2014. UAV Flight Experiments Applied to the Remote Sensing of Vegetated Areas. Remote Sensing, 6(11), pp. 11051–11081.
Suomalainen, J. et al., 2014. A Lightweight Hyperspectral Map-ping System & Photogrammetric Processing Chain for Unman-ned Aerial Vehicles. Remote Sensing, 6(11), pp. 11013–11030. Zecha, C., Link, J, Claupein, W., 2013. Mobile sensor platforms: categorisation and research applications in precision farming. Journal of Sensors and Sensor Systems, 2, pp. 51–72. The International Archives of the Photogrammetry, Remote Sensing and Spatial Information Sciences, Volume XLI-B1, 2016
![Figure 3. multiSPEC 4C with normalised sensitivity of channels, G, R, Red Edge and NIR [%]](https://thumb-ap.123doks.com/thumbv2/123dok/3293021.1403787/2.595.308.534.176.387/figure-multispec-normalised-sensitivity-channels-red-edge-nir.webp)