WALKABILITY FOR DIFFERENT URBAN GRANULARITIES
D. Hollenstein a*, S. Bleischa
a
FHNW University of Applied Sciences and Arts Northwestern Switzerland, Institute of Geomatics Engineering – (daria.hollenstein, susanne.bleisch)@fhnw.ch
ThS 17
KEY WORDS: Walkability, Cities, Geographic Information Systems, Analysis, Geovisualization
ABSTRACT:
The positive effects of low-intensity physical activity are widely acknowledged and in this context walking is often promoted as an active form of transport. Under the concept of walkability the role of the built environment in encouraging walking is investigated. For that purpose, walkability is quantified area-wise by measuring a varying set of built environment attributes. In purely GIS-based approaches to studying walkability, indices are generally built using existing and easily accessible data. These include street network design, population density, land use mix, and access to destinations. Access to destinations is usually estimated using either a fixed radius, or distances in the street network. In this paper, two approaches to approximate a footpath network are presented. The two footpath networks were built making different assumptions regarding the walkability of different street types with respect to more or less restrictive safety preferences. Information on sidewalk presence, pedestrian crossings, and traffic restrictions were used to build both networks. The first network comprises car traffic free areas only. The second network includes streets with low speed limits that have no sidewalks. Both networks are compared to the more commonly used street network in an access-to-distance analysis. The results suggest that for the generally highly walkable study area, access to destination mostly depends on destination density within the defined walkable distance. However, on single street segments access to destinations is diminished when only car traffic free spaces are assumed to be walkable.
*
Corresponding author
1. INTRODUCTION 1.1 Walkability
Walking, as a basic form of physical activity and an active form of transport, combines the benefits of promoting health (US Department of Health and Human Services, 1996), facilitating social contact, and maintaining independence especially also in old age (Hirvensalo, Rantanen and Heikkinen, 2000; Pahor, et al. 2014). Under the concept of walkability, the role of the built environment in encouraging walking by providing safety, comfort and access to destinations is investigated (Southworth, 2005). For that purpose, various measures of the built environment are combined in composite indices to estimate and compare walkability areas-wise (Weiss, Maantay and Fahs, 2010). However, there is no agreement on a standardized set of measures to be included in those indices, since the evidence on the influence of the different built environment features on physical activity is not conclusive (Weiss, Maantay and Fahs, 2010).
Since walkability is a fundamentally spatial concept, Geographic Information Systems (GIS) are a helpful tool to manage, process, and visualize walkability related data. GIS have been used variously in walkability studies, e.g. to investigate the correlation between objective measures of the built environment and perceived walkability as assessed from population surveys (Cho, Rodriguez and Khattak, 2009; Weiss, Maantay and Fahs, 2010), to assess and compare walkability of
different cities or urban areas (Giles-Corti et al., 2014) and to explore the influence of built environment features on physical activity in older adults (King et al., 2010). In purely GIS-based approaches, walkability indices are generally calculated based on existing and easily accessible data (Weiss, Maantay, and Fahs, 2010). These are mainly indices on street network design, population density, land use mix diversity, and access to various destinations (Cervero and Kockelman 1997; Saelens, Sallis, and Frank 2003; Leslie et al., 2007; Knight and Marshall 2015). Composite indices are then computed over areas at the granularity of neighbourhoods or census blocks (Leslie et al. 2007; Weiss, Maantay and Fahs 2010; Freeman et al. 2012; Giles-Corti et al., 2014; Buck and Tkaczick 2014). However, the actual relation between those variables and walkability is not uncontested (Grant et al. 2010 and references therein). On a more functional level, walkability is quantified using data that is generally surveyed specifically to suit this purpose using audit forms, e.g. PEDS – Pedestrian Environment Data Scan (Clifton, Livi Smith, and Rodriguez, 2007), which include data about side walk presence and quality, pedestrian crossings, speed limits, traffic calming (chokers, chicanes), road surface, lighting, noise level, enclosure, architectural variety, tree and green space presence, bustle etc., as well as subjective measures of attractiveness or perceived safety. If suitable input data exists, quantitative data on these functional attributes may be generated using GIS as well, hence sparing the costs of extra surveys.
1.2 Motivation
In Switzerland, data to infer some functional features, e.g. sidewalk presence, or green space buffer zones that separate sidewalks from roads, are part of the cadastral land cover data model. Cadastral survey data are freely available for download for most Swiss Cantons. This offers the opportunity to investigate the purely GIS-based quantification of functional walkability features. Further, if high-resolution input data on various features and infrastructural elements are combined in a GIS, analysis resolution can be scaled as required and results can be visualized at different granularity levels, such as neighbourhoods, blocks, single lots or street segments.
The present study is part of a project concerned with walkability and old age in an urban area in Olten, Switzerland (the study area is indicated in Figure 2). The project is aimed at investigating how older women are supported or limited by the built environment around their domicile to meet the needs of everyday life, use health services, stay socially connected and pursue leisure time activities. The project provides an opportunity to test, whether easily accessible geo-data provides a suitable basis to make GIS-based statements about walkability that account for the needs of elderly women with potentially limited mobility.
Preliminary results presented in this paper include two footpath networks that were built based on different input information and access-to-destination maps computed on these networks. The results are compared to each other and to the more commonly used street network. Finally, we discuss the cost-benefit question with respect to input data generation.
2. ANALYSIS LEVELS AND METHODS A network of “walkable” paths is an essential prerequisite for walkability analysis. The network can be used to infer access to destinations, walking comfort, and pedestrian safety, which are central aspects of the concept of walkability (Southworth, 2005). Street networks are generally used as a basis for walkability analyses. Using street networks as an approximation to footpaths has an influence on all results that are based on network attributes, as e.g. access to destination or connectivity. The results derived from street network attributes will deviate with varying degree from those based on actual footpath routes depending on the situation within the study perimeter. However,
it is hard or impossible to generally define a “walkable” path, since, besides requiring a variety of infrastructural detail that is not normally provided in suitable categories within the available data sources, the term “walkable” implies a personal judgement.
Therefore, some assumptions concerning the types of paths that are included in a footpath network have to be made. In the following, two footpath networks are presented, each of which was built making different assumptions regarding the definition of the term “walkable”. In contrast to the street network, both networks factor in information on sidewalks, pedestrian crossings, and traffic restrictions. Following, the datasets and methods that were used to create the footpath networks are described. Cadastral land cover data (Amt für Geoinformation Kanton Solothurn 2016), Cantonal street network data (Amt für Geoinformation Kanton Solothurn 2016) and data from OpenStreetMap (OpenStreetMap Contributors 2016) are the main sources for the footpath networks. All of these datasets are freely available. The land cover polygon dataset is spatially comprehensive and includes the categories “sidewalk”, “street / path”, “subway / tunnel” and “other paved area”. “Other paved area” is a mixed category that mainly contains parking lots and building access paths or areas.
2.1 Footpath network 1
The first network was created using a narrow interpretation of the word “walkable”. Walkable paths in the very narrow sense comprise car traffic free paths only. According to this definition and deduced from the available data sources, footpaths include car traffic free streets and paths, sidewalks, crossings and subways that connect these elements. Further, some parts of the “other paved area” category of the land cover dataset practically function as sidewalks too. The respective parts were defined and identified through their association with the mentioned footpath elements: Paved areas which are connected directly to a crossing or which connect a car traffic free road and a sidewalk were extracted and treated as sidewalks.
Still, this selection of data categories does not provide a comprehensive footpath network in line with the specified definition: There may be further footpath categories, such as traverses through malls, which are not identifiable given the available input data.
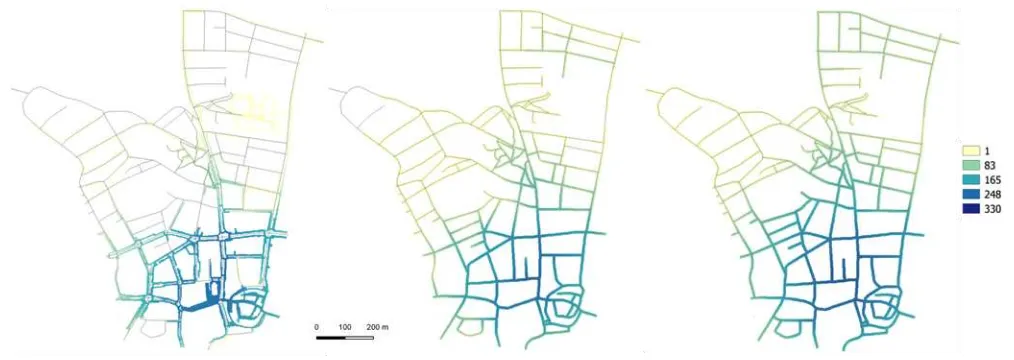
The processing steps for generating the footpath network as outlined above, included extracting the relevant objects from the Figure 1. Footpath network 1 (left) comprising car traffic free paths only; footpath network 2 built from walkability rated streets (middle, the colour coding is explained in Table 1); and the unrated street network (right). (Data sources: Amt für Geoinformation
Kanton Solothurn 2016; Direktion Öffentliche Sicherheit, Stadt Olten)
land cover dataset, adding information about traffic restrictions to the street network and extracting the car traffic free segments, and extending lines from the point positions of crossings to sidewalks, other paved areas, or car traffic free roads. The locations of pedestrian crossings were extracted from OpenStreetMap (OpenStreetMap Contributors 2016), but were updated to the current traffic routing in Olten. The information on speed limits is the only data not publicly available.2
The resulting network (Figure 1, left) might partly meet the reality of some of the survey participants, but for people with no mobility limitations, it is unlikely to reflect actual walking habits, as streets with low speed limits may be crossed or even walked along.
2.2 Footpath network 2
Therefore, a second footpath network that caters for a broader definition of the term “walkable” was created. Based on the routing of hiking trails within the study area as well as personal experience, streets without sidewalks but maximum speed limits of 30kmh were included. Consequently, streets without sidewalks and speed limits above 30kmh were categorized as non-walkable. This categorization is somewhat arbitrary and may not be appropriate for more rural areas where street networks are less dense but streets are also less busy. Of course, it may also conflict with personal preferences, as some people may not feel safe on streets that are shared with car traffic.
To generate the second network, information about speed limits, sidewalks (none, one or two), and crossing presence (presence / absence) was assigned to each street network segment within the perimeter. Segments were then rated according to sidewalk and crossing presence, or in absence of sidewalks, according to speed limits (Table 1, Figure 1, middle).
Street types Grade
Traffic free streets 1
Streets with two sidewalks and crossing 1 Streets with two sidewalks, no crossing 1.5 Streets with one sidewalk and crossing, 20/30kmh 1.5 Streets with one sidewalk and crossing, 50kmh 3 Streets with one sidewalk, no crossing, 20/30kmh 2 Streets with one sidewalk, no crossing, 50kmh 3.5 Streets without sidewalk, speed limit, 20kmh 2.5 Streets without sidewalk, speed limit, 30kmh 3 Streets without sidewalk, speed limit, 50kmh
non-walkable
Table 1. Rating of streets with respect to footpath features
The choice of grades is arbitrary. The analysis results, which are discussed below, can give some indication on the degree to which the rated street network mirrors the properties of the footpath network 1 and to what degree using the rated street network might overcome shortcomings of the latter, where people without mobility limitations and a lesser need for safety are concerned.
2.3 Access-to-Destinations Analysis
The footpath networks were compared to each other and to the standard street network in an access-to-destination analysis. Relevant destinations, such as shops, restaurants, cafes, libraries, parks, health service providers, banks, hair dressers, other service providers, recycling stations, leisure activity
2
Courtesy of the Direktion Öffentliche Sicherheit of the city of Olten.
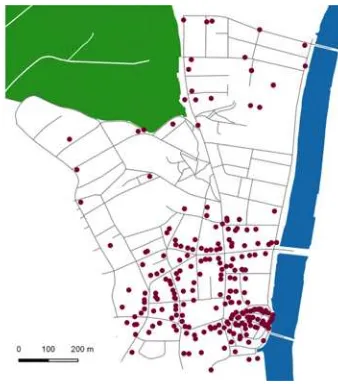
facilities, post offices and letter boxes etc., were extracted from OpenStreetMap (2016) and collected from the local yellow pages3 and the Swiss Post website4. Bus stop locations are freely available from the Cantonal geoportal (Amt für Geoinformation 2016). Altogether, these data amount to 330 destinations. Destinations are not evenly distributed within the perimeter (Figure 2). Numerous destinations are found in the south of the area where the city center is located, while few destinations are found to the north, where residential areas including a park and a hospital are located.
For access-to-destinations analyses a procedure similar to the one described in Holbrow (2010) was followed: A cost distance raster for each destination was calculated using a raster of walkable paths as cost surface and limiting the maximum cost to 400. Hence, with a cell value of 1 and the distance being multiplied by the cell value, the maximum cumulative costs in one direction amount to a 400m distance. In the cost surface that was rasterized from the network of rated streets, the cell value corresponds to the grade. The maximum distance that can be walked thus diminishes according to the decreasing walkability. For example, when streets with grade 2 are walked, the walkable distance diminishes by a factor 0.5. Segments that were categorized as non-walkable consequently were assigned the value 400. The cost distance rasters for individual
Figure 2. Study Perimeter with various amenities (red dots). (Data Sources: Amt für Geoinformation Kanton Solothurn 2016, OpenStreetMap Contributors 2016, Yellow Pages3 and
Post website4)
3. PRELIMINARY RESULTS 3.1 Footpath networks
As seen from Figure 1, footpath network 1 (left), which is built from car traffic free streets, sidewalks, crossings, and subways,
3
http://yellow.local.ch/ 4
https://www.post.ch
has a coverage that differs from the street network (Figure 1, right): Not every street segment is covered by sidewalks. As a consequence, it is the less walkable streets according to the rating outlined in 2.2 (Figure 1, orange: grade 2.5 or higher) that are not covered by the footpath network 1. On the other hand, including paved areas, as outlined in 2.1, adds paths to footpath network 1 that are not present in the street network dataset. Likewise, the connectivity of the two networks differs in detail: Only streets rated 1 in footpath network 2 (Figure 1, middle, dark green) are fully connected in the footpath network 1.
Figure 3: Study Perimeter with test locations A and B. (Data Sources: Amt für Geoinformation Kanton Solothurn 2016)
Altogether, Figure 1 shows that the study area is highly walkable in general, with only small groups of street segments that are not well walkable or poorly connected. However, the streets at the western and northern margins of the area potentially function as barriers for people with limited mobility.
In order to further compare the properties of footpath network 1 and footpath network 2 to the properties of the unrated street network (Figure 1, right), cost distance surfaces for two single locations (A and B, Figure 3) were computed on each network type (Figure 4, top row of figures for location A and bottom row of figures for location B).
Analysis for location A (Figure 4, top row) results in lesser coverage to the north and to the southeast for both footpath networks as compared to the street network (Figure 4, top row, right). More specifically, both footpath networks lack a connection to the north, as indicated by the larger orange circle in Figure 4. This correspondence indicates that towards the margins of the defined maximum walkable distance (400m), the network of rated streets mirrors to some degree the properties of footpath network 1. In contrast, the smaller orange circle indicates the location of a missing eastward link according to footpath network 1, where a connection is present according to footpath network 2, due to the segment’s location at short distance from the starting point. This illustrates the problems that arise when grades are used to rate the distance-independent walkability of street segments and rated street segments are then used in cost distance analyses to calculate the walkable range from a specific location. Nonetheless, the segment under consideration is clearly walkable (grade 2.5) for people with no or minor mobility limitations. Cost distance analysis from location B (Figure 4, bottom row) emphasizes this aspect: When footpaths in the strict ⁄sense are used, the walkable area around
Figure 4. Cost distance maps for location A (top row) on footpath network 1 (left), on footpath network 2 (middle), on street network (right). Cost distance maps for location B (bottom row) on footpath network 1 (left), on footpath network 2 (middle), on street network
(right). (Data Sources: Amt für Geoinformation Kanton Solothurn 2016; Direktion für Öffentliche Sicherheit, Stadt Olten).
the starting point B is restricted. In terms of connectivity, footpath network 1 might not reflect actual conditions well: In residential areas, many sidewalks are not connected through pedestrian crossings. Effectively, they are still accessible, as low capacity streets can be crossed without pedestrian crossings. This issue is overcome by using footpath network 2 instead, which still indicates the somewhat diminished walkability of the area as compared to the unrated street network. The diminished walkability is due to the lack of connections between sidewalks and the lack of sidewalks on some streets. Footpath network 1, which includes data from the land cover category “other paved area”, reveals an additional link to the south. This link is not evident, when street network data only is used.
3.2 Access-to-Destination Analysis
The different access-to-destinations analysis results (Figure 5) mainly reflect the location and distribution of amenities within the perimeter. Having said that, in the maps based on footpath networks, areas with no access to destinations within the 400m limits are identified and network segments with low access to destinations (e.g. only 1 amenity reachable) are found in places where the map based on unrated streets indicates medium access to destinations. There is limited correspondence between footpath network 1 (Figure 5, left) and footpath network 2 (Figure 5, middle) regarding segments with low and medium access to destinations. However, it is not possible to decide which one of the maps reflects actual walkability better. Footpath network 2 has the advantage of providing connections that are missing from footpath network 1 but are likely used on walking routes. On the other hand, using car traffic free routes only, prevents from making wrong assumptions regarding people walking on streets with low speed limits, where this is not actually the case, because the street is either too busy, or otherwise too dangerous to walk along.
In conclusion it can be said, that using the street network as an approximation to footpaths probably yields acceptable results in an access-to-distance analysis on a generally walkable area, as long as non-walkable (e.g. as defined in 2.2) streets are excluded from the analysis and pedestrians have no mobility limitations.
4. ONGOING WORK AND OUTLOOK
In this paper, the influence of input data with different levels of detail on the derived access-to-destination analysis has been addressed. The next step will be to use further walkability attributes to characterize the area at varying granularity with respect to walking comfort and pedestrian safety. It is planned to include data on green space buffer presence, traffic light position, slope, supporting infrastructure, such as benches, shelters and public bathrooms, land use mix, population density, and street lighting. Results considering all variables will be compared to results based on population density, street network design and land use mix only. Results will be visualized at different granularity levels, such as neighbourhoods, street blocks, single addresses or street segments.
ACKNOWLEDGEMENTS
The presented work was conducted as a part of the interdisciplinary study “Mit den Augen betagter Frauen” under the lead of the Institute for Social Work and Health5 at the University of Applied Sciences and Arts Northwestern Switzerland FHWN. The study pertains to the strategic initiative “Alternde Gesellschaft” by the FHWN (2016). The initiative is aimed at promoting applied research that addresses challenges in an ageing society. The GIS-based analyses would not be possible, without the support by the Olten City Council: For the presented analyses the Direktion Öffentliche Sicherheit kindly provided the data on traffic restrictions and speed limits.
REFERENCES
Amt für Geoinformation Kanton Solothurn 2016. Geoportal. Available at: www.so.ch/verwaltung/bau-und-justizdepartement/amt-fuer-geoinformation/geoportal/, 12.2.2016.
Bowling, A., Banister, D., Sutton, S., Evans, O., Windsor, J., 2002. A multidimensional model of the quality of life in older age. Aging & Mental Health, 6(4), pp. 355-371.
5
Project lead by N. Bachmann and S. Süsstrunk
Figure 5. Access-to-destination maps (number of accessible amenities within 400m) calculated based on footpath network 1 comprising car traffic free paths only (left); based on footpath network 2 built from walkability rated streets (middle); and based on unrated street network (right). (Data Sources: Amt für Geoinformation Kanton Solothurn 2016; Direktion für Öffentliche Sicherheit,
Stadt Olten)
Cervero, R., Kocklman, K., 1997. Travel deman and the 3 D’s: density, diversity and design. Transport Research Part D, 3, pp. 199-219.
Cho, G., Rodriguez, D.A., Khattak, A.J., 2009. The role of the built environment in explaining relationships between perceived and actual pedestrian and bicyclist safety. Accident Analysis and Prevention, 41, pp. 692-702.
Clifton, K., Livi Smith, A.D., Rodriguez, D., 2007. The development and testing of an audit for the pedestrian environment. Landscape and Urban Planning, 80, pp. 95-110.
Freeman, L., Neckerman, K., Schwartz-Soicher, O., et al., 2012. Neighborhood walkability and active travel (walking and cycling) in New York City. Journal of Urban Health, 9758-9765.
Giles-Corti, B., Macaulay, G., Middelton, N., et al., 2014. Developing a research and practice tool to measure walkability: a demonstration project. Health Promotion Journal of Australia, 25, pp. 160-166.
Grant, T. L., Edwards, N., Sveistrup, H., Andrew, C., Egan, M., 2010, Neighborhood Walkability: Older People’s Perspectives From Four Neighborhoods in Ottawa, Canada. Journal of Ageing and Physical Activity, 18, pp. 293-312.
Hirvensalo, M., Rantanen, T., Heikkinen, E., 2000. Mobility difficulties and physical activity as predictors of mortality and loss of independence in the community-living older population. J Am Geriatr Soc, 48(5), pp. 493-498.
Holbrow, G., 2010. Walking the Network. A Novel Methodolgoy for Measuring Walkability Using Distance to Destinations Along a Network. Department of Urban and Environmental Policy and Planning, Tufts University. Available at: http://sites.tufts.edu/gis/files/2013/02/Holbrow_Gabriel.pdf, 4.4.2016.
King, A.C., Sallis, J.F., Frank, L.D., et al. 2011. Aging in neighborhoods differing in walkability and income: Associations with physical activity and obesity in older adults.
Social Science & Medicine, 73, pp. 1525-1533.
Knight, P.L., Marshall 2015. The metrics of street network connectivity: their inconsistencies. Journal of Urbanism: International Research on Placemaking and Urban Sustainability, 8(3), pp. 241-259.
Leslie, E., Coffee, N., Frank, L., Owen, N., Baumann, A., Hugo, G., 2007. Walkability of local communities: Using geographic information systems to objectively assess relevant environmental attributes. Health & Place, 13, pp. 111-122.
OpenStreetMap Contributors, 2016. OpenStreetMap. Available at: www.openstreetmap.org, 12.02.2016.
Pahor, M., Guralnik, J.M., Ambrosius, W.T., et al., 2014. Effect of Structured Physical Activity on Prevention of Major Mobility Disability in Older Adults: The LIFE Study Randomized Clinical Trial. JAMA, 311(23), pp. 2387-2396.
Post CH AG, 2016. Die Post. Available at: https://www.post.ch/de/privat, 13.02.2016.
Saelens, B.E., Sallis, J.F., Frank, L.D., 2003. Environmental correlates of walking and cycling: findings from the transportation, urban design, and planning literatures. Annals of Behavioral Medicine, 25(2), pp. s80–91.
Southworth, M., 2005. Designing the walkable city. Journal of Urban Planning and Development, 131, pp. 246–257.
Swisscom Directories AG, 2016. local.ch. Available at: https://yellow.local.ch/, 13.02.2016.
University of Applied Sciences and Arts Northwestern Switzerland FHWN, 2016. Strategische Initiative “Alternde Gesellschaft. Available at: http://www.fhnw.ch/forschung-und-entwicklung/strategische-initiativen/alternde-gesellschaft, 04.04.2016.
US Department of Health and Human Services 1996, Physical Activity and Health: A Report of the Surgeon General. Atlanta, GA: U.S. Department of Health and Human Services, Centers for Disease Control and Prevention, National Center for Chronic Disease Prevention and Health Promotion. Available at: http://www.cdc.gov/nccdphp/sgr/pdf/sgrfull.pdf, 04.04.2016.
Weiss, R.L., Maantay, J.A., Fahs, M., 2010. Promoting Active Urban Aging: A Measurement Approach to Neighborhood Walkability for Older Adults. Cities Environ., 3(1), 12-.