THE CLASSICAL ASSUMPTION TEST TO DRIVING FACTORS OF LAND COVER
CHANGE IN THE DEVELOPMENT REGION OF NORTHERN PART OF WEST JAVA
Nur Ainiyah1*, Albertus Deliar2, Riantini Virtriana2 1
Student in Geodesy and Geomatics, Remote Sensing and Geographic Information System Research Division, Faculty of Earth Science and Technology, Institut Teknologi Bandung, Indonesia; [email protected]
2
Lecturer in Geodesy and Geomatics, Remote Sensing and Geographic Information System Research Division, Faculty of Earth Science and Technology, Institut Teknologi Bandung, Indonesia; [email protected]
Youth Forum
KEY WORDS: Land Cover Change, Driving Factors, Classical Assumption Test, Binary Logistic Regression
ABSTRACT:
Land cover changes continuously change by the time. Many kind of phenomena is a simple of important factors that affect the environment change, both locally and also globally. To determine the existence of the phenomenon of land cover change in a region, it is necessary to identify the driving factors that can cause land cover change. The relation between driving factors and response variables can be evaluated by using regression analysis techniques. In this case, land cover change is a dichotomous phenomenon (binary). The BLR’s model (Binary Logistic Regression) is the one of kind regression analysis which can be used to describe the nature of dichotomy. Before performing regression analysis, correlation analysis is carried it the first. Both correlation test and regression tests are part of a statistical test or known classical assumption test. From result of classical assumption test, then can be seen that the data used to perform analysis from driving factors of the land cover changes is proper with used by BLR’s method. Therefore, the objective of this research is to evaluate the effectiveness of methods in assessing the relation between driving factors of land cover change that assumed can affect to land cover change phenomena. This research will use the classical assumed test of multiple regression linear analysis, showing that BLR method is efficiency and effectiveness solution for researching or studying in phenomenon of land cover changes. So it will to provide certainty that the regression equation obtained has accuracy in estimation, unbiased and consistent.
INTRODUCTION
Rarely for researchers related of land cover change that performing statistical tests prior to the data that will be used to determine the type of data and the relation between the data. Therefore, the result of obtained in order to provide high precision and have a foundation and a strong argument in choosing method, in this research will be performed statistical test before analyzing driving factors of land cover change and prediction of it.
The statistical tests intended to determine the significance of relationship between variables. This test includes: correlation test and regression test (predictions). Before performing prediction of land cover change from driving factors has been assumed to have a relation and influence, it must be known in advance the relation between variables that occur. The classical assumption test is a statistical test used to determine the relation between variables, including: multicollinearity test, heteroscedasticity test, autocorrelation test, normality test, and linearity test.
I. MAIN BODY
1.2 Study Area
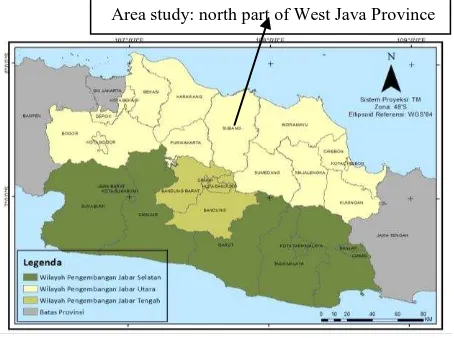
The study area conducted in North Part of Development Region of West Java Province (Figure 1). The province area of the study is approximately 35,000 km2. Surface topography is dominated by mountainous are in the centre to the south and the
vast plains in the north. Geographical conditions of West Java Province is situated between 104 ° 48 '00" until 108 ° 48' 00" East longitude and 5 ° 50 '00 "until 7 ° 50' 00" South Latitude. The boundaries of West Java: north side is bordering with Jakarta Special Capital Region (DKI Jakarta) and Java Sea, east side is bordered by Central Java province, and south side by the Indian Ocean and the west side is bordering the province of Banten. Based on the available facts and data, West Java has a high economic activity that will have an impact on changes in land cover. Availability of data and information is very supportive to the West Java province, especially sufficient satellite image data, so that the region of West Java province is considered good as the research area.
Figure 1. Area study
Area study: north part of West Java Province The International Archives of the Photogrammetry, Remote Sensing and Spatial Information Sciences, Volume XLI-B6, 2016
1.3 Datasets Used
The data used in this study primarily consists of five main data, namely:
• SRTM (Shuttle Radar Topographic Mission) Digital Elevation Model with a resolution of 90 meters derived from USGS,
• Thematic Map of Land Cover 2005, 2010 and 2015 derived from Geospatial Information Agency (BIG),
• Administrative Boundary Map derived from Geospatial Information Agency (BIG), earth's surface, land cover portrait of the circumstances and the physical condition of the surface of agricultural land as mountains and forests (Turner et al, 1995 in Brissoulis, 2000).
According of Food and Agriculture Organization (FAO) in the documentation of the Convention to Combat Desertification in 1996, that the land use is a description of the physical condition of the Earth's surface (Brisoulis, 2000; Jensen, 2000), such as types of vegetation, water, desert, forest, land, and buildings.
Now days the land cover changes are mostly caused by human activity in the use of such land use for residential and production land (Lambin, 2004). Group or individual may use the land based on various considerations, both from the physical aspects (including environmental change), social, economic, cultural and even political though that are intended to meet the interests of individuals or groups (Kaiser et al., 1995; Verburg et al., 1998). Based of reference, the process of land cover or land use changes can also be in the form of conversion or modification. The conversion process happens if a land use is converted to other types of use, while the modification process occurs if there is a change in the intensity of use (Briassoulis, 2000).
1.5 Classical Assumption Test
1.5.1 Multicollinearity Test: is used to determine existence of high correlation between variables in a multiple regression model. If there is a high correlation between the independent variables, then relation between them of the dependent variable will be disrupted. As such, a good regression model should not be a correlation between independent variables, or may be mutually collinear but not highly correlated (Gani, 2015). Figure 2 explanations the type of correlation.
(a) (b) (c)
Figure 2. Correlation type of independent variables (a) not collinear, (b) weak collinear, and (c) perfect collinear
Multicollinearity testing can be done by looking at value of Variance Inflation Factors (VIF) and Tolerance. VIF is a function of R2 between independent variables that can be written with formula below (Nachrowi, 2006):
(1) and the value of Tolerance <0.10, then there is multicollinearity. There is also a reference that says that if VIF> 5, then it must be careful.
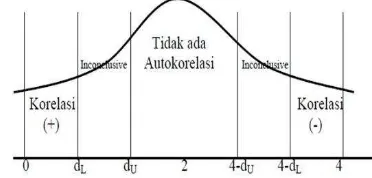
1.5.2 Autocorrelation test: is used to see that there is a linear relation between the errors on a series of observations, sorted by time (time series). Autocorrelation test needs to be done if the analyzed data is time series data (Gujarati, 1993) on the condition that must be met is not autocorrelation. Figure 3 is an illustration of autocorrelation test area.
Figure 3. Area of autocorrelation test (Darmawan, 2015)
Autocorrelation testing can be done by value of Durbin Watson (DW). Equation Durbin Watson (calculated as) can be written Summary SPSS output. The indicator test: if the DW’s value of calculated is outside the lower limit (dL) and the upper limit (dV), then the model is not autocorrelation.
1.5.3 Heteroscedasticity test: is used to test there is a regression model residual variance inequality from one observation to another observation. Regression formula obtained by assuming confounding variables (error) has a constant residual variance (range of errors approximately equal). Heteroscedasticity occurs if there is residual variance is not constant. The regression model to be good if there is not heteroscedasticity (Ghozali, 2007).
Heteroscedasticity testing can be done by Glejser Test method. Glejser test is conducted by regression between independent variable and absolute residual as dependent variable. Glejser test equation can be written as follows below (Gujarati, 1993):
|Un| = a + bnXn + Vn (3)
Where:
|Un| = Absolute value of residuals Xn = Variable of independent Vn = Variable of residual (errors)
The result value of test can be seen from value of significant. If the significance value > 0.05, then there is no heteroscedasticity. Conversely, if the significance value <0.05, then occurs heteroscedasticity (Hill, Griffiths and Lim, 2011).
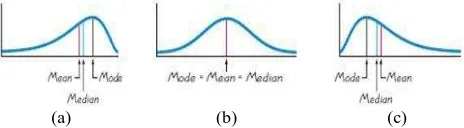
1.5.4 Normality test: is used to determine whether or not the normal distribution of data (Santoso, 2010). Good research data is data that has a normal distribution. The normal distribution (bell shaped) means the data has spread evenly so that it can represent the population. Data that is not normal can be distinguished from the level of skewed (skewness). If the data tends to be skewed to the left is called positive skewness, if the data tend to be skewed to the right is called negative skewness, and the data is said to be normal if the data is symmetrical (Figure 4).
(a) (b) (c)
Figure 4. Normality of data (a) negative skewness (median and mean tends to the right), (b) zero skewness (median, mean, mode and the same), and (c) positive skewness (median and mean tends to the left)
The normality testing can be done by Shapiro Wilk test. Shapiro Wilk method uses a data base that has not been processed in the frequency distribution table. Data is sorted then divided into two groups to be converted in the Shapiro Wilk (Rahman et al, 2014). Shapiro Wilk equation can be written as follows:
T3 = (4)
Where:
D =
= Coefficient of Shapiro Wilk test
= Variable of independent at-
= Average of data
Significance test of the value of T3 with Shapiro Wilk table can be seen in the probability value (p). If the value of p> 5%, then the data are normally distributed. Conversely, when the value of p <5%, then the data were not normally distributed.
1.5.5 Linearity test: is used to determine whether two or more variables have a significant linear relationship or not. The results of these tests can then be used to help make decisions in determining the regression model that will be used appropriately.
Linearity testing can be done by the Sig. linearity and Sig. deviation from linearity in Table ANOVA. Value Sig. linearity indicates the extent to which the independent variable value just in a straight line. If the value of Sig. linearity < significance
level (α), then the linear regression can be used to explain the influence of variables that exist. While the value of Sig. deviation from linearity shows what the data is used as linear. If the value of Sig. deviation from linearity > significance level
(α), then the linear regression can be used to explain the influence of variables that exist (Widhiarso, 2010).
1.6 BLR Method
Binary Logistic Regression (BLR) is a regression model where variable responses (dependent) are binary (dichotomous or categorical). RLB formulated to predict and explain a phenomenon (the dependent variable) is dichotomous with use of all data types as the independent variables (Hair, 2010). The main purpose of RLB is to determine the effect of the independent variables and the dependent variable with the probability of occurrence of categories 0 (unchanged) and 1
: The probability of not occurrence of event i ⍺ : Constant of regression equation
: Coefficient of predictor variable (1, 2, …, n)
: Variables of predictor or independent (1, 2, n)
II. RESULT AND DISCUSSION
After statistic test on the data, it will be known condition data. So the result from test will help facilitate in determining a proper techniques and equations applied to existing data. Not all of statistical tests should be done, but depending on the type of data. For a regression analysis that is not based on the OLS (Ordinary Least Square) example logistic regression, then the concept of the requirements of the classical assumptions is not required. Likewise, not all classical assumption test must be performed on linear regression analysis, for example multicolinearity test is not performed on a simple linear regression analysis and autocorrelation test does not need to be applied to the data cross sectional.
2.1 Result of Multicollinearity Test
The results of the multicollinearity test between driving factors in land cover change (as variable x) can be seen in Table 1:
Driving Factors Tolerance VIF
Distance to CBD of Bandung City 0.081 12.289
Distance to CBD of Bekasi Regency 0.002 438.833
Distance to CBD of Bekasi City 0.003 289.013
Distance to CBD of Bogor Regency 0.004 279.998
Distance to CBD of Karawang Regency
0.012 85.072
Distance to CBD of Sukabumi Regency
0.007 149.149
Distance to the capital of province 0.092 10.821
Distance to settlement 0.678 1.475
Distance to main road 0.877 1.141
Population 0.842 1.188
Slope 0.567 1.763
Curvature 0.994 1.006
Height 0.304 3.285
Table 1. Result of multicollinearity test using VIF and Tolerance value
Based on the output of results in Table 1, shows that there is high multicollinearity among the driving factors in regression model for the value of Tolerance < 0.1 and VIF > 10, including: the distance to CBD of Bandung city, distance to CBD of Bekasi regency, distance to CBD of Bekasi regency and city, distance to CBD of Bogor regency, distance to CBD of Karawang regency, distance to CBD of Sukabumi regency, and distance to the capital of province.
The existence of multicollinearity problems caused the relation between independent variables and the dependent variable to be disrupted. This is because the independent variables are mutually orthogonal (correlation values between the members of the independent variables are not equal to zero). One of kind the way to overcome the problems of multicollinearity is transform data into another form, namely the logarithm (log) or the natural logarithm (ln) (Kutner et al, 2004). Therefore, in this study used a method Binary Logistic Regression (BLR).
2.2 Result of Autocorrelation test
The general objective of this study was to quantify the size of the driving factors of land cover change at the time or a certain period. Subject or phenomenon in this study is classified into two categorical, that changed and unchanged (is binary or dichotomous). Evaluation of the measurement results in the form of odd ratio, which is a measure the strength of relation between the drivers of land cover changes. Then the magnitude of the effect is intended to predict land cover changes. Of all the features already mentioned, this study is cross sectional (transverse or prevalence). Autocorrelation test is only performed on the time series data, so in this study is not necessary to autocorrelation testing.
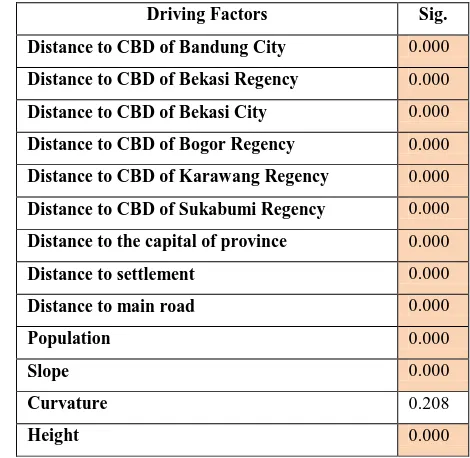
2.3 Result of Heteroscedasticity test
The result of heteroscedasticity test can be seen from the value of output in Table 2 below:
Driving Factors Sig.
Distance to CBD of Bandung City 0.000
Distance to CBD of Bekasi Regency 0.000
Distance to CBD of Bekasi City 0.000
Distance to CBD of Bogor Regency 0.000
Distance to CBD of Karawang Regency 0.000
Distance to CBD of Sukabumi Regency 0.000
Distance to the capital of province 0.000
Distance to settlement 0.000
Distance to main road 0.000
Population 0.000
Slope 0.000
Curvature 0.208
Height 0.000
Table 2 Result of heteroscedasticity test using Glejser method
From Table 2 shows that the value of significance <0.05 for all drivers of land cover change, except curvature. Thus there has been a problem heteroscedasticity on data. In a significant column shows that the critical value of reception Ho = 0%. When used confidence level of 95%, the figure in region of rejection Ho or accepted hypothesis that residual coefficients in heteroscedasticity test effect on dependent variable. One of kind the ways to overcome the problem of heteroscedasticity is transform data into logarithms (log) or the natural logarithm (ln) (Kutner et al, 2004). Therefore, in this study used a method Binary Logistic Regression.
2.4 Result of Normality test
The results of normality test showed that the data are not normally distributed. It can be seen from the graph output histogram graph in Figure 5. The result shows that the distribution pattern of the data that is uneven or not symmetry. Thus, it is said that the data has not normal distribution.
Figure 5. Result of normality test The International Archives of the Photogrammetry, Remote Sensing and Spatial Information Sciences, Volume XLI-B6, 2016
The phenomenon of land cover change is a phenomenon that does not always follow the normal assumptions. If the data is not normally distributed, then one kind of the way to overcome that is to use a device (method or model) that does not require assumption of normality. Binary Logistic Regression is a mathematical model does not require the assumption of normality, so in this study used BLR method for studying the phenomenon of land cover changes.
2.5 Result of Linearity test
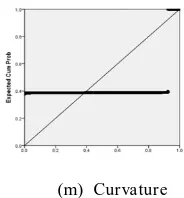
The results of linearity test indicate that there is no linear relationship between each of the factors driving the changes in land cover. This is because the point distributions are not followed and away from diagonal lines (Figure 6)
(a)Distance to CBD of Bandung City
(b)Distance to CBD of Bekasi Regency
(c)Distance to CBD of Bekasi City
(d)Distance to CBD of Bogor Regency
(e)Distance to CBD of Karawang Regency
(f) Distance to CBD of Sukabumi Regency
(g)Distance to the capital of province
(h)Distance to settlement
(i) Distance to main road
(j)Height (k)Population (l) Slope
(m) Curvature
Figure 6 Results of linearity test
The form of influence between the variables in this study is not linear. This means that relation between variables to be analyzed does not follow a straight line. After knowing the form of influence between variables, then be decide the appropriate regression model to be used. Later in this study used a Binary Logistic Regression model, which form between variables influence logarithmic form.
III. CONCLUSION
Based on the results of the study, the data used to conduct research land cover change has the properties are: the dependent variable type of categorical data (dichotomous, binary), the independent variable type of all the data, the relation between dependent variable and independent variable that there are problems: multicollinearity, heteroscedasticity, the data cross sectional (not time series data), the data were not normally distributed, and data is not linear. Therefore, a suitable methods used to conduct the research of land cover change is to use Binary Logistic Regression (BLR).
ACKNOWLEDGMENT
The author grateful to Remote Sensing and Geographic Information Sciences Research Division, Instiute of Technology Bandung for the funding, so this recearch can be run. Author also would like to thankful to BIG (Geospatial Information Agency) for supporting the land cover data.
REFERENCES
Allen, Ralph C; Stone, Jack H. Textbook Neglect of the Constant Coefficient. Journal of Economic Education36.4 (Fall 2005): 379-384.
Arsanjani, J.J., Helbich, M., Kainz, W., & Boloorani, A.D. 2013. Integration of Logistic Regression, Markov Chain and Cellular Automata Models to Simulate Urban Expansion. International Journal of Applied Earth Observation and Geoinformation, 21 (1), 265 – 275.
Brissoulis, H. (2000, Juli). Analysis of Land Use Change: Theoritical and Modeling Approach. Retrieved from The
Web Book of Regional Science:
http://www.rri.edu/WebBook/Brissoulis/
FAO, F. a. (1995). Planning for Sustainable Use of Land Resources. FAO Land and Water (Vol. Bulletin). Rome: Food and Agriculture Organization of the United Nations.
Darmawan, Hanna. 2015. Uji Asumsi Klasik. Semarang: Penerbit Undip.
Dougherty, C. 2002. Introduction to econometrics. 2nd ed. New York: Oxford University Press.
Ghozali, Imam. 2007. Aplikasi Analisis Multivariate dengan Program SPSS. Semarang: Penerbit Undip.
Gujarati, Damodar. 1988. Ekonometrika Dasar. Jakarta: Erlangga.
Hair, J. F. Et al. 2010. Multivariate Data Analysis: A Global Perspective. 7th Edition. New Jersey: Pearson Prentice Hall.
Hill, Griffiths dan Lim. 2011. Principles of Econometrics. United States of America.
Kutner, M.H., C.J. Nachtsheim dan J. Neter. 2004. Applied Linear Regression Models (Fourth Ed). The McGraw-Hill Company, Inc. New York.
Jensen, J. R. 2000. Remote Sensing of the Environment: An Earth Resource Perspective. Prentice-Hall, Inc, 544 p.
Lambin, E. 2004. Modelling Land-Use Change, in Wainwright, J. and Mulligan, M., Eds, Environmental Modeling: Finding Simplicity in Complexity, John Wiley, 430 p.
Larsen, R. J. 2006. Introduction to Mathematical Statistics and Its Applications. Pearson/ Prentice Hall.
Rahman, D. Cahya, dkk. 2014. Uji Normalitas dengan Shapiro Wilk. Jakarta: Sekolah Tinggi Ilmu Statistik.
Santoso, Singgih. 2010. Statistik Multivariat. Jakarta: PT. Elex Media Komputindo.
Turner, B. L., Skole, D., Sanderson, S., Fischer, G., Fresco, L., dan Leemans, R. 1995. Land-Use and Land-Cover Change Science/ Research Plan, International Human Dimension Programme on Global Environmental Change. Report No. 7
Widhiarso, Wahyu. 2010. Catatan Pada Uji Linearitas Hubungan. Yogyakarta: Fakultas Psikologi UGM.
Xie, Y., Mei, Y., Guangjin, T., & Xuerong, X. 2005. Socio-economic driving forces of arable land conversion: A case study of Wuxian City, China in Global Environmental Change (Vol. 15, p. 238-252).