A STUDY OF THE IMPACT OF INSOLATION ON REMOTE SENSING-BASED
LANDCOVER AND LANDUSE DATA EXTRACTION
K. Becek a, b, *, A. Borkowski c, Ç. Mekik b
a
Dept. of Geomatics, Bülent Ecevit University, Zonguldak, Turkey – [email protected] b Dept. of Geodesy & Geoinformatics, Wroclaw University of Sciences & Technology, Wroclaw, Poland –
Inst. of Geodesy and Geoinformatics, Wroclaw University of Environmental and Life Sciences, Wroclaw, Poland – andrzej.borkowski@ igig.up.wroc.pl
Commission VII, WG VII/3
KEY WORDS: LiDAR, DSM, NTII, Insolation, Hyperspectral Imaging Spectrometer Data
ABSTRACT:
We examined the dependency of the pixel reflectance of hyperspectral imaging spectrometer data (HISD) on a normalized total insolation index (NTII). The NTII was estimated using a light detection and ranging (LiDAR)-derived digital surface model (DSM). The NTII and the pixel reflectance were dependent, to various degrees, on the band considered, and on the properties of the objects. The findings could be used to improve land cover (LC)/land use (LU) classification, using indices constructed from the spectral bands of imaging spectrometer data (ISD). To study this possibility, we investigated the normalized difference vegetation index (NDVI) at various NTII levels. The results also suggest that the dependency of the pixel reflectance and NTII could be used to mitigate the shadows in ISD. This project was carried out using data provided by the Hyperspectral Image Analysis Group and the NSF-funded Centre for Airborne Laser Mapping (NCALM), University of Houston, for the purpose of organizing the 2013 Data Fusion Contest (IEEE 2014). This contest was organized by the IEEE GRSS Data Fusion Technical Committee.
* Corresponding author
1. INTRODUCTION
Passive remote sensing (RS) is based on the assumption that solar energy reflected from objects varies in intensity across spectral bands as a function of the physicochemical properties of these objects. It is also known that the properties of the reflected energy depend on its incidence angle in respect to the surface of the object reflecting it. The impact of this effect on the classification of imaging spectrometer data (ISD) sets has been addressed in several studies (Henrich et al., 2014, Teillet, 1982, Meyer et al., 1993, Sandmeier, et al., 1997, Richter, 1998, Riaño, et al., 2003, Conese, et al., 1993, Civco, 1989, Chavez, 1996). Most of these studies have focused on finding a way to compensate for the variable incidence angle. Based on these studies, a few terrain-correction procedures have been proposed (Henrich et al., 2014, Yuan, et al., 1996, Shepherd, et al., 2003). A concise overview of the most successful terrain-correction methods can be found in Riaño et al., (2003). The performance of topography-correction methods for selected types of ISD data sets and selected types of land cover (LC) has also been reported (Riaño, et al., 2003, Shepherd, et al., 2003, Alonzo, et al., 2014). These methods use digital surface models (DSMs) to estimate the incidence angle of the solar irradiation. Various sources of topography data are available. These include the Shuttle Radar Topography Mission (SRTM), the Advanced Spaceborne Thermal Emission and Reflection Radiometer (ASTER), SPOT DEM, and Light Detection and Ranging Laser (LiDAR) models. The accuracy of these DEMs varies from approximately 0.15 m (LiDAR) and 2.0 m (SRTM) to 7.0 m (ASTER v2.0) (Becek, 2014).
In this report we summarize our investigations of the relationship between the pixel intensity of 144 bands of an ISD set for 15 land use/land cover classes, in addition to the impact of our findings on remote sensing (RS) studies. This study differs from previous work by its use of an HISD set (144 bands) and by its assessment of the solar incidence of objects at a very high spatio-temporal resolution.
The key variable considered in this study is the insolation. Insolation is defined as the total solar irradiance arriving at a unit of horizontal surface of the Earth within a unit of time (Dubayah et al., 1995, Fu et al., 2002, Justice et al., 1981). Insolation depends on a number of factors. These include atmospheric effects, site latitude and elevation, slope and aspect, effects of shadows cast by surrounding topographic features and daily and seasonal shifts in the Sun’s angle. Insolation is expressed in watt hours per square meter (Whm-2). Insolation is composed of direct and indirect components. The latter component originates from the solar irradiation diffused by the atmosphere (Justice et al., 1981). The defused component of solar irradiation means that objects in shadow can still be seen. The major differences between direct and indirect components of the insolation are: a) The intensity of defused insolation is lower, and b) the spectrum of defused insolation is significantly different from the spectrum of direct insolation (Civco, 1989, Churma, 1994).
The calculation of the insolation at a given location and time is relatively easy because it requires only a DSM. The calculation becomes more difficult in the presence of cloud shadows because they are random events. In this project, we used pixels The International Archives of the Photogrammetry, Remote Sensing and Spatial Information Sciences, Volume XLI-B7, 2016
affected by a cloud shadow to investigate the spectral differences between the direct and defused components of solar irradiance. The cloud shadow was present when the hyperspectral imaging spectrometer data (HISD) set was captured.
To summarize, one may state that the characteristics of the intensity of solar energy across the spectrum depend not only on the physicochemical properties of objects but also on their orientation in relation to solar irradiance, topography and shadows. In addition, the spectrum of the defused solar irradiance is different from that of direct solar irradiation. Thus, the results of RS are subject to the aforementioned factors.
The aim of this contribution is to demonstrate the impact of solar irradiation on HISD sets and their resulting classification.
2. METHOD
Insolation can be expressed as follows:
diff period can be calculated from the following integral:
According to Richter (1998), in rugged, hilly terrain, the slopes of the surrounding hills contribute extra irradiance to nearby areas and this additional irradiance should be considered in the calculations of insolation. However, this additional irradiance has not been considered in this study.
In the present study, the total insolation, G, was calculated using the dedicated Toolbox of the ArcGIS software package. The solar constant was assumed to be 1367 Wm-2. To calculate the defused component, the sky was divided into 200 sectors. In this study we use a normalized representation of the total insolation: the normalized total insolation index (NTII). In a designated area, the NTII was defined as the ratio between the total insolation at a given pixel and the maximum value of the total insolation within the investigated area. To calculate the NTII, the acquisition time of the ISD set (2 min and 40 sec) and the geographical coordinates of the centre of the site (29° 43’ 15’’ N and 95° 20’ 43’’W - WGS 84) were used.
To demonstrate the potential impact that different NTII values may have on the results of RS investigations, we selected the were captured on June 22, 2012. The data were collected from an approximate altitude of 600 m. The elevation was in (m) above the Geoid 2012A. The elevations for the DMS were between 4.4 m and 70.8 m. No details were available on the instrument model, average LiDAR point density or accuracy of the elevations. The DSM was at 2.5 m spatial resolution and the accuracy of the model was not stated.
A HISD set with 144 spectral bands in the 364–1046.1 nm region was acquired at a 2.5 m spatial resolution. The data were captured on June 23, 2012 over a period of 2 min. and 40 sec, beginning at 17:37:10 UTC (11:37:10 CDT). They were acquired from an approximate altitude of 1676 m (IEEE 2014) from a strip of 4762.5 m by 872 m (1905 × 349 pixels = 664,845 pixels). Figure 1 shows the area of interests.
Figure 1. The area of interests. A cloud shadow is visible in the eastern part of the scene
The ground truth data contained 15 classes of LC/LU. In each class, there were approximately 190 pixels. Table 1 lists the ground truth classes. Column 3 shows a histogram of the classes identified. Some of the classes represent only a very small part of the AOI. We focused our investigations on classes that made up 2% or more of the AOI.
Table 1. Ground truth classes and the number of pixels selected in each class. Some of the pixels were collected in the
shadowed area
The ground truth data were collected around the same time as the HISD. Some 19.8% of the total image area was under a cloud shadow. The extent of the shadow was estimated by visual interpretation.
The HISD set was classified using a novel method developed by Debes et al., (2014). According to the authors, the accuracy of the classification exceeded 90%. We used the classification data obtained by this method in the present study.
4. RESULTS
The calculations of the total insolation for the period of acquisition (2’ 40”) of the HISD set yielded values between 0.115 and 36.518 Whm-2. The total insolation was subsequently normalized, as described above. The new variable was termed the normalized total insolation index (NTII). Figure 2 shows a histogram of the NTII. As shown in Figure 2, the NTII exceeded 0.8 for approximately 74% of the area of the site. The remaining 26% constituted areas were exposed to less direct solar radiation due to the slope and aspect, or they were in shadows cast by elevated objects. This finding indicated that the topography of the site was relatively featureless and that the lower values of NTII were caused by shadows cast by elevated objects, including buildings.
Objects in shadows are highlighted only by defused irradiance. Consequently, they appear darker in images.
0 0.2 0.4 0.6 0.8 1
Figure 2. Histogram of the NTII for the AOI
To assess the impact of cloud shadows on the pixel reflectance across spectral bands, the mean pixel intensities of both the in-shadow and no-in-shadow pixels were calculated for each spectral band. Figure 3 shows the ratio between the in-shadow and no-shadow pixel intensities vs. the wavelength.
200 400 600 800 1000 1200
Figure 3. Ratio between the in-shadow and not in-shadow pixel intensities vs. the wavelength. The in-shadow pixels clearly appear more bluish and less reddish than the not in-shadow pixels
The curve in Figure 3 confirms that the indirect component of the solar irradiation ‘promoted’ shorter rather than longer wavelengths. This observation may provide a clue as to how to mitigate effects of variable irradiation in a multi-spectral image across spectral bands.
Note that the relationship between the NTII and pixel intensities shown in Figures 3 was calculated from all the pixels, irrespective of the material they represent. This may obscure the true picture of the relationship between the NTII vs. the wavelength.
Figure 4 presents the results of an experiment with the not in-shadow pixels only for all classes of LC/LU in which we evaluated the relationship of the reflectance with the wavelength and the NTII. A clear conclusion from Figure 4 is that the character of the relationship depends on the wavelength: the pixel reflectance is less susceptible to the NTII for shorter wavelengths, and more so for longer wavelengths. This observation is consistent with the curve shown in Figure 3 and subsequent comments. The examples of extreme high pixel reflectance, which are clearly visible in Figure 4, are outliers.
Figure 4. Mean pixel intensity vs. the NTII and wavelength. Only not in-shadow pixels were considered
The relationship of the mean pixel intensity vs. the NTII and reflectance with NTII and wavelength. This phenomenon may have some implications for the use of spectral indices in the identification of LC materials. To confirm this assertion we conducted some experiments which we report on herewith.
Figure 4. Mean pixel intensity vs. the NTII and wavelength for selected classes of LC/LU
A well-known RS index - the normalized difference vegetation index was selected for the test (Equations 4). The average pixel values of the bands from 59–65 (640.7–669.3 nm, respectively) were assumed to represent the R band, and the average value of the bands from 103–109 (850.4–879 nm, respectively) were The International Archives of the Photogrammetry, Remote Sensing and Spatial Information Sciences, Volume XLI-B7, 2016
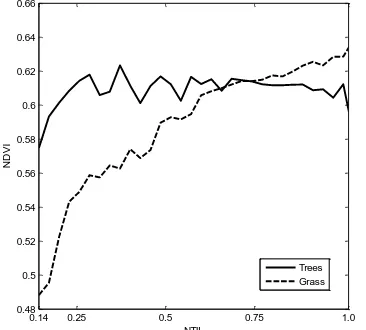
assumed to represent the NIR band. The above band ranges ‘Tree’, NDVI steadily increased with an increase in the value of the NTII, and less so for the ‘Grass healthy’ class. NDVI was approximately higher by 0.15 for the lowest vs. the highest values of the NTII. This is an important finding that may be used to improve the accuracy of classification of RS imagery using other types of spectral indices.
0.14 0.25 0.5 0.75 1.0
Figure 5. Mean NDVI vs. NTII for ‘Grass healthy’ and ‘Trees’ classes
5. CONCLUSIONS
Our investigations of the relationship of the pixel reflectance to the NTII, wavelength and selected LC/LU classes, and also the relationship between NDVI and the NTII allow for a few concluding statements.
1. The inclusion of the NTII into a processing chain of ISD has the potential to improve the accuracy of the classification of RS images.
2. The NTII of areas in shadows cast by clouds can also be estimated, although a procedure for doing so has yet to be proposed. It is anticipated that such a procedure would play an important role in improving the accuracy of the RS investigations.
3. Our study confirms the best practice method for choosing training samples which is proposed in (Richter, 1998). According to this method the selected LC samples should also have similar solar irradiation conditions. There are a number of limitations of the present study. Despite these, the achieved results justify further studies on the relationship between solar irradiation and the outcomes of ISD-based studies.
ACKNOWLEDGEMENTS
The authors would like to thank the Hyperspectral Image Analysis group and the NSF Funded Centre for Airborne Laser Mapping (NCALM) at the University of Houston for providing the data sets used in this study, and the IEEE GRSS Data Fusion Technical Committee for organizing the 2013 Data Fusion Contest.
REFERENCES
Alonzo, M., Bookhagen B., Roberts, D.A., 2014. Urban tree species mapping using hyperspectral and lidar data fusion. Remote Sens. Environ., 148, pp. 70–83.
Becek, K., 2014. Assessing Global Digital Elevation Models Using the Runway Method: The Advanced Spaceborne Thermal Emission and Reflection Radiometer Versus the Shuttle Radar Topography Mission Case. IEEE Trans. Geosci. Remote Sens., 52, pp. 4823–4831.
Chavez, P.S., 1996. Image-based atmospheric corrections. Revisited and improved. Photogramm. Eng. Remote Sens., 62, pp. 1025–1036.
Churma, M.E. 1994. Blue shadows: physical, physiological, and psychological causes. Appl. Opt., 33, pp. 4719–4722.
Civco, D.L., 1989. Topographic normalization of Landsat Thematic Mapper digital imagery. Photogramm. Eng. Remote Sens., 55, pp. 1303–1309.
Conese, C., Gilabert, M.A., Maselli F., Bottai, L., 1993. Topographic normalization of TM scenes through the use of an atmospheric correction method and digital terrain models. Photogramm. Eng. Remote Sens., 59, pp1745–1753.
Debes, C., Merentitis, A., Heremans, R., Hahn, J., Frangiadakis, N., van Kasteren, T., Liao, W., Bellens, R.; Pižurica, A., Gautama, S., Philips, W., Prasad, S., Du, Q., Pacifici, F. 2014. Hyperspectral and LiDAR Data Fusion: Outcome of the 2013 GRSS Data Fusion Contest. IEEE J. Selec. Topics In App. Earth Obs. and Rem. Sen., 7(6), pp. 2405 – 2418.
Dubayah, R., Paul, M., 1995. Topographic solar radiation models for GIS. Int. J. Geogr. Inf. Syst., 9, pp. 405–419.
Fu, P., Rich, P.M., 2002. A Geometric Solar Radiation Model with Applications in Agriculture and Forestry. Comput. Electron. Agric., 37, pp. 25–35.
Henrich, V., Krauss, G., Götze C., Sandow, C. Index DataBase; A database for remote sensing indices. http://www.indexdatabase.de (24 Nov. 2014).
IEEE GRSS Data Fusion Contest. http://www.grss-ieee.org/community/technical-committees/data-fusion/. (24 Nov. 2014).
Jiang, Z., Huete, A., Didan, K., Miura, T., 2008. Development of a Two-Band Enhanced Vegetation Index without a Blue Band. Remote Sen. Environ., 112, pp. 3833–45.
Justice, C.O., Wharton S.W., Holben, B.N., 1981. Application of digital terrain data to quantify and reduce the topographic effect on Landsat data. Int. J. Remote Sens., 2, pp. 213–230.
Law, K.H., Nichol, J., 2004. Topographic Correction for Differential Illumination Effects on Ikonos Satellite Imagery. The International Archives of the Photogrammetry, Remote Sensing and Spatial Information Sciences, Istanbul, Turkey,
Vol. XXXV, part B3. Online:
http://www.isprs.org/proceedings/XXXV/congress/comm3/pape rs/347.pdf.
Liu, B.Y.H., Jordan, R. C., 1960. The interrelationship and characteristic distribution of direct, diffuse and total solar radiation. Solar Energy., 4, pp. 1–19.
Meyer, P., Itten, K.I., Kellenberger, T., Sandmeier S., Sandmeier, R., 1993. Radiometric corrections of
topographically induced effects on Landsat TM data in an alpine environment. ISPRS J. Photogramm. Remote Sens., 48, pp. 17–28.
Richter, R., 1998. Correction of satellite imagery over mountainous terrain., Appl. Opt. 37, pp. 4004–4015.
Riaño, D., Chuvieco, E., Salas, J., Aguado, I., 2003. Assessment of different topographic corrections in Landsat TM data for mapping vegetation types. IEEE Trans. Geosci. Remote Sens., 41, pp. 1056–1061.
Sandmeier S.R., Itten, K.I., 1997. A physically–based model to correct atmospheric and illumination effects in optical satellite data of rugged terrain. IEEE Trans. Geosci. Remote Sens., 35, pp. 708–717.
Sellers, P., 1985. Canopy Reflectance, Photosynthesis and Transpiration. Int. J. Remote Sen., 6, pp. 1335–72.
Shepherd J.D., Dymond, J.R., 2003. Correcting satellite imagery for the variance of reflectance and illumination with topography. Int. J. Remote Sens., 24, pp. 3503–3514.
Teillet, P.M., Guindon B., Goodenough, D.G., 1982. On the slope–aspect correction of multispectral scanner data. Can. J. Remote Sens., 8, pp. 84–106.
Qi, J., Chehbouni, A., Huete, A., Kerr, Y., Sorooshian, S., 1994. A Modified Soil Adjusted Vegetation Index. Remote Sen. Environ., 48, pp. 119–26.
Yuan D., Elvidge, C. D., 1996. Comparison of relative radiometric normalization techniques. ISPRS J. Photogramm. Remote Sens., 51, pp. 117–126.