RAPID EXPOSURE ASSESSMENT OF NATIONWIDE RIVER FLOOD FOR DISASTER
RISK REDUCTION
Y. Kwak a, *, J. Park b, B. Arifuzzaman c, Y. Iwami a, Md. Amirul c, A. Kondoh d a
International Centre for Water Hazard and Risk Management (ICHARM), PWRI, 1-6 Minamihara, Tsukuba, Ibaraki, Japan - [email protected]
b
Dept. of Environmental Information, Tokyo University of Information Sciences, Wakaba, 1200-2 Chiba, Japan - amon@ rsch.tuis.ac.jp
c
Flood Forecasting & Warning Center, Bangladesh Water Development Board, 1000 Dhaka, Bangladesh - [email protected]
d
Center for Environmental Remote Sensing (CEReS), Chiba University, 1-33 Yayoi, Inage, Chiba, Japan - [email protected]
Commission VIII, WG VIII/1
KEY WORDS: Nationwide flood, MODIS, MLSWI, Affected people, Risk reduction
ABSTRACT:
Over the last decades, the number of affected people and the scale of economic damage caused by inland flood disasters have considerably increased. For flood disaster risk reduction, it is important to identify and characterize flood area, locations (particularly lowland along rivers), and durations. For this purpose, flood mapping and monitoring are an imperative process and the fundamental part of risk management as well as emergency response. Our ultimate goal is to detect flood inundation areas over a nationwide scale despite limitations of optical and multispectral images, and to estimate flood risk in terms of affected people. We propose a methodological possibility to be used as a standard approach for nationwide rapid flood exposure assessment with the use of the multi-temporal Moderate Resolution Imaging Spectrometer (MODIS), a big contributor to progress in near-real-time flood mapping. The preliminary results in Bangladesh show that a propensity of flood risk change strongly depends on the temporal and spatial dynamics of exposure such as distributed population.
* Corresponding author
1. INTRODUCTION
1.1 Background
Global risk in terms of human and economic exposure to natural disasters has been increasing over the past few decades (UNISDR, 2011). Asia is the world’s most disaster-prone region, registering the largest number of people affected, as well as death toll, by disasters (UNESCAP, 2012). Floods were the most common natural disaster in Asia in the period of 1980-2010. In particular, human exposure to floods has been increasing to a greater extent in South Asia, East Asia and the Pacific areas (UNISDR, 2012). In recent years, too, devastating floods occurred in Myanmar and Bangladesh in July 2015 as well as in eastern Japan in September of the same year. Large-scale floods have become frequent in both developed and developing countries.
Feature extraction, including flood detection and flood change detection, are one of the traditional themes of satellite-based observation with optical and synthetic aperture radar (SAR) sensors. The detection of water-body boundaries in a large flood area is a more specific topic of challenge in relation to the selection of suitable sensors, and many methods have been developed (Alsdorf et al, 2003; Brakenridge et al., 2012). For example, since its launch in December 1999, the Moderate Resolution Imaging Spectroradiometer (MODIS) has been one of the main contributors to progress in near real-time mapping (Pinheiro et al, 2007). Flood mapping systems utilizing MODIS multispectral sensors are now able to generate near-real-time
flood maps with a global coverage on a daily basis (NASA, 2015). Compared with passive optical technologies, SAR systems are more attractive because they are independent from the solar illumination and relatively insensitive to atmospheric weather conditions. However, SAR images have some limitations such as geometric distortion (e.g., layover and shadowing), roughness, moisture, and speckle noise. Nevertheless, many researchers use very high spatial resolution SAR images to distinguish and extract disaster areas, because advanced SAR is currently the most effective sensor to detect dynamic earth surface, e.g., the extent of floodwater, landslide, earthquake, volcanic eruption, subsidence and other movements, even when it is covered with cloud, rain and smoke, owing to the near all-weather/day-night acquisition capabilities.
1.2 Objectives
Although central and local governments of developing countries make efforts to collect as much flood disaster information as possible from their branch offices, it is not still enough to accurately identify and classify the distribution and location of damaged and affected areas temporally and spatially during flooding. The purpose of this study was to detect flood inundation areas nationwide in near real time despite limitations of optical and multispectral images and to estimate flood risk in terms of affected people. We propose a methodological possibility to be used as a standard approach for nationwide rapid flood exposure assessment using the multi-temporal MODIS, a big contributor to progress in near-real-time mapping. In addition, we introduce a proxy risk indicator of flood impact and a prompt risk mapping approach through the preliminary results of Bangladesh concerning how to quantify flood risk and changes in the extent of inundation, and consequently suggest the effectiveness of risk assessment for the ultimate goal of flood risk reduction.
1.3 Study Area
This study selected Bangladesh as the study area. The country is over 147,570 km2,and located at the downstream end of the floodplain delta formed by three major rivers, i.e., Ganges, Brahmaputra, and Meghna (GBM), lying between latitude 20°– 27°N and longitude 88°–93°E.
The GBM river basin is a transboundary river basin with a total area of over 1.7 million km2, spreading over several countries of India (occupying 64% of the total basin area), China (18%), Nepal (9%), Bangladesh (7%) and Bhutan (3%). This river system is the third largest freshwater outlet to the world's oceans; the peak discharge of the Brahmaputra River is about 103,100m3/sec with an area of 552,000 km2.
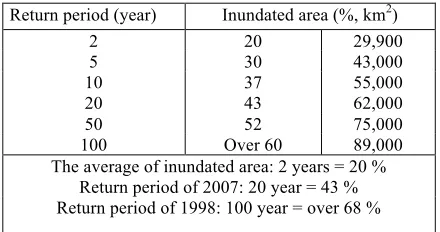
Bangladesh is one of the most flood-prone country in the Asian monsoon region and suffers from flood disasters every year due to its geographical location and extreme rainfall, which, for example, recorded a highest average annual rainfall of 5,690 mm and a highest annual total rainfall of 4,939mm at the Sylhet station in 2010. More than 160 million people, or 2.19% of the total world population, live in Bangladesh, and most of them are directly exposed to floods. In a 1998 flood, the death toll reached over a thousand, and more than 30 million people were left homeless (BBS, 2012). Kwak et al. (2014) conducted flood risk assessment in case of a 50-year return period flood under climate change scenarios on 14 Asian developing countries, and found that Bangladesh is the highest flood risk country because of its largest vulnerable population (also Lee et al., 2014). Table 1 shows the average inundated area due to floods of a given return period from historical records after 1950 in Bangladesh. For example, 2-year return period floods have caused, on average, an inundated area accounting for about 20% of the total area. Among the extremely large floods in history after 1950, four events were recorded as the most devastating: the flood in 1988 affected approximately 89,970 km2, or about 63%, of the total area of the country; the flood in 1998 affected 100,200 km2, or about 68%; the flood in 2004 affected approximately 55,000 km2, or about 37%; and the flood in 2007 affected approximately 62,000 km2, or about 43% (Hofer and Messerli, 2006; BWDB, 2007; World Bank, 2010).
Return period (year) Inundated area (%, km2)
The average of inundated area: 2 years = 20 % Return period of 2007: 20 year = 43 % Return period of 1998: 100 year = over 68 %
Table 1. Return periods with corresponding inundated areas in Bangladesh (Hofer and Messerli, 2006)
2. METHOD OF RAPID EXPOSURE ASSESSMENT
2.1 Data Used
This study used five sets of primary data to calculate affected population at each pixel (approximately 500 m spatial resolution), as listed in Table 1.
First, to detect water bodies for flood mapping, MODIS data were derived from the MOD09A1 (Terra), level-three eight-day composite surface reflectance products in the sinusoidal projection (MOD09A1), which contains the best observations during an eight-day period. We used MOD09A1 data to analyze the sensitivity of water indices to spectral characteristics between 12-19 July and 14-21 September in 2007 and between 22-29 July and 14-21 September in 2015.
In order to compare MODIS-derived water index with a high spatial resolution image, we selected and verified MODIS-derived flood areas by using Advanced Land Observing Satellite (ALOS), the Advanced Visible and Near Infrared Radiometer type 2 (AVNIR-2), and ALOS-2 Phased Array type L-band Synthetic Aperture Radar 2 (PALSAR-2) data on 10 August 2007 and 10 September 2015, respectively. ALOS and ALOS-2 were launched by the Japan Aerospace Exploration Agency (JAXA).
Next, the Bangladesh Water Development Board (BWDB) has a nationwide hydrological network, which regularly measures surface water levels and water discharges year-round. To compare the characteristics of relationship between inundation areas and the peak level, we used water level data of 2007 and 2015 from hydrological data collected by the BWDB.
Finally, for flood exposure assessment, distributed population data from the LandScanTM (Budhendra, 2007) was used. Floodwater depth was estimated to classify exposure risk categories from topographic data (DEM: digital elevation model) acquired from HydroSHEDS (hydrological data and maps based on the SHuttle Elevation Derivatives at multiple Scale) (Lehner et al, 2008).
Selected data Spatial resolution Sources
MODIS 500 m USGS, 2007, 2015
ALOS/ALOS-2 10 m / 100 m JAXA, 2007, 2015
Population 1 km Landscan, 2009
DEM 450 m SRTM, 2000
Water level points BWDB, 2007, 2015
2.2 Nationwide Flood Hazard Mapping
2.2.1 Flood Mapping: For nationwide flood mapping, it is important to determine floodwater pixels more accurately through the development of a floodwater index. Among MODIS-derived water indices, the most optimized index was selected as the floodwater index, which was considered effective in detecting water bodies (Kwak et al, 2014). The modified land surface water index (MLSWI) was developed as a new index from LSWI and NDWI specifically for floodwater detection in Equation 1 (Kwak et al, 2015).
ρ
where ρ = atmospherically corrected surface reflectance of MODIS
ρNIR = surface reflectance of MODIS band 2 (NIR: 841–876 nm)
ρSWIR = surface reflectance of MODIS band 7 (SWIR: 2105–2155nm)
For quality assessment, the MOD09A1 products were checked for cloud cover in reference to the quality layer of the Quality Assessment (QA) Science Data Sets (SDS) by visually inspecting cloud QA because the image quality decreases due mainly to cloud cover during floods.
For accuracy assessment of the water-related pixels of MLSWI, the ALOS AVNIR-2 and ALOS-2 PALSAR-2 data in this study were captured over the Sirajganj district (approximately 2480 km2) during the pre- and flood-time conditions on 23 December 2006 and 10 August 2007, and 7 September 2015.
2.2.2 Flood Extent: In the hydrological network of BWDB (Bangladesh Water Development Board), the Flood Forecasting & Warning Center (FFWC) under BWDB is in charge of flood monitoring and forecasting for flood damage reduction. Their gauging stations issue a warning when the floodwaters rise very close to the danger level, the river water level which indicates that the floodwaters are reaching immediately below the maximum river water level and that they may cause damage to nearby crops and homesteads when continuing rising beyond that level. (FFWC, 2014).
We used the stage data of water level obtained from the stations, which conduct measurements regularly five times a day at 6 a.m., 9 a.m., 12 p.m., 3 p.m., and 6 p.m. in Bangladesh standard time, 6 hours ahead of Universal Time Coordinated (UTC/GMT). To establish a flood propagation scenario for Bangladesh, stage point data were converted into spatial and temporal data, based on the relationship between the water level focusing on the danger level and the flooding start time. The spatial and temporal data were used to monitor the propagation of the flood to provide improved flood forecasting coupled with flood risk in order to achieve better flood operations and flood management.
2.3 Nationwide Exposure Assessment
The GBM river basin of Bangladesh contains the larger number of the world’s poor than any other region with the highest distributed population map (LandScanTM, 2009). Affected
population was estimated by population dynamics based on the 2009 population by using Equation (2) as follows:
where Pop = affected population at present in 2009 and 2015 r = population growth rate (CIESIN, 2013)
3. RESULTS
The preliminary results show that a propensity of flood risk changes, strongly depending on the temporal and spatial dynamics of exposure such as distributed population. The results of the flood exposure assessment are summarized in the following sections.
3.1 Nationwide Flood Hazard Mapping
3.1.1 Inundated Areas: In Bangladesh, a flood is considered to occur when the water level exceeds the danger level. We improved the water detection algorithm to achieve a better discrimination capacity to discern flood areas by using a modified land surface water index (MLSWI), and estimated flood extent by using an optimal threshold of water index (0.75) based on the spectral characteristics. The flood extent was found to be proportional to the flood duration in the 2007 and 2015 floods.
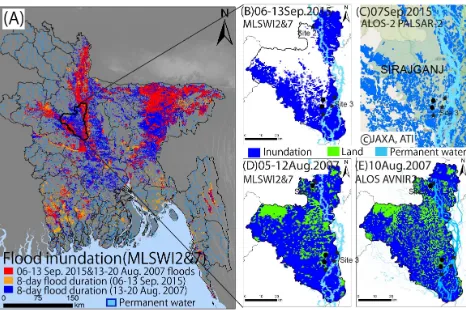
Figure 1 shows the maximum inundation areas in 2007 and 2015, approximately 40% (46,000 km2) and 32% (29,900 km2) of the total area of Bangladesh, respectively, at the flood peaks exceeding the flood danger water level. The inundation areas of the 2007 and 2015 floods were both underestimated as a 10- and 5-year return period flood, respectively, compared with the historical records in Table 1, because the maximum inundation areas were only counted using the composite MODIS images for 8 consecutive days, including the one-day duration of flood peaks, out of all 52 days of the flood season in 2007, for example.
The maximum inundation map in Figure 1a was produced with MLSWI2&7. The blue pixels represent the floodwater during the 8 days in 2007, the yellow pixels represent the floodwater during the 8 days in 2015, and the red pixels represent the floodwater in 2007 and 2015 (14,500 km2). Figures 1b and 1c show the comparison of MLSWI in the 2015 peak flood with ALOS-2 PALSAR-2 from JAXA’s emergency observation on 7 Sep 2015 in selected flood locations of the Sirajganj district along the Brahmaputra River.
Figure 1. (a) Maximum inundation extent map from MODIS images during the 8 days in 2007 (blue) and 2015 (yellow), and
a comparison of MLSWI with ALOS/ALOS-2 of the Brahmaputra River from (b) MLSWI in 2015 and (c) ALOS-2
PALSAR-2, (d) MLSWI in 2007 and (e) NDVI threshold classification of ALOS AVNIR-2 in the Sirajganj district.
3.1.2 Hydrological Verification: The results showed that this novel approach is capable of providing instant, comprehensive nationwide flood mapping over Bangladesh by using water-level data and multi-temporal MODIS data. Figure 2 shows the relationship between water level at a selected hydrological station and inundated area in the Brahmaputra River in 2007 and 2015. We clearly confirmed that the flood propagation was in good agreement with the timing of the water level exceeding the water danger level, which is 13.35m above mean sea level (MSL) in the case of the 10-year return period flood event at the Sirajganj station. According to the water level exceeding the danger level on 19 July 2007 in Figure 2, it was found that the total inundated area also increased from the MODIS-derived floodwaters during 20-27 July at the same time. In addition, according to the water level exceeding the danger level on 21 August 2015, we found that the flood propagation of 2015 was similar with the 2007 flood pattern in terms of time and spatial distribution due to continued overflow for 23 days even after the peak water level (14.13m above MSL) on 6 September 2015 at the Sirajganj station.
Figure 2. The relationship between water level (blue dots in 2007 and green dots in 2015) and maximum inundated area (red filled circles in 2007) at the Sirajganj station of the Brahmaputra
River in 2007 and 2015.
3.2 Exposure Assessment
According to the maximum flood exposure scenario, the number of potentially affected people was calculated and verified for part of the GBM basin in Bangladesh. Table 3 shows the comparison of inundation area and affected people during the 2007 and 2015 floods in the GBM basin. After counting the population in the inundation area based on Landscan TM 2009 data, affected people were represented in red pixels of the overlaying portion. They were estimated to be approximately 7.9 million, or 33%, of the total affected population in the 2007 and 2015 floods and considered to be at high risk of exposure in the GBM river basin of Bangladesh. Table 3 also reveals that the total number of affected people is similar between the 10-year return period flood in 2007 and the 5-year return period flood in 2015, assuming no changes of the 2009 population in temporal and spatial dynamics distribution, despite an 8% difference in total inundated area between 2007 and 2015. This discrepancy is attributable to possible difference in population within the flood extent between the floods in 2007 and 2015. More people may have lived in the flood extent in 2015 than in 2007. Although the 2007 flood covered a larger portion of the GBM river basin of Bangladesh (the red and blue pixels in Figure 1a) than the 2015 flood (the red and yellow pixels in Figure 1a), the flood in the former case may have spread over low density and uninhabited rural areas such as cropland and swamps.
Flood events (Return period: year)
Affected population / Inundated area (%, km2) 2015 (5~10 yr) 23,800,000 32%, 29,900 2007 (10~20 yr) 24,300,000 40%, 46,000 2015&2007 7,900,000 16%, 14,500 Table 3. Comparison of flood dimensions between 2007 and
2015
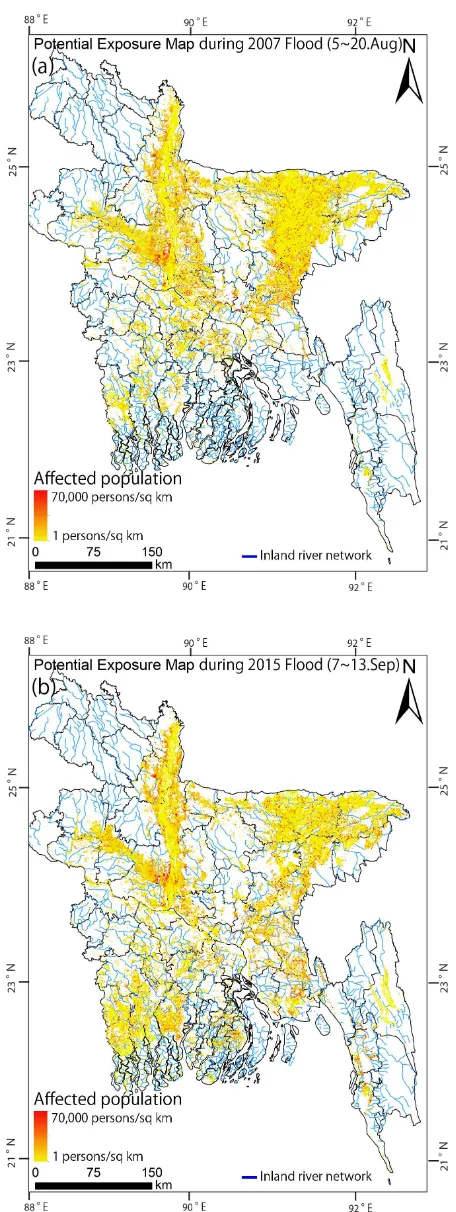
In Figure 3, the red pixels represent a high risk (over 70,000 person per sq.km or urban area) of physical exposure to flood damage, and the yellow cells a low risk of physical exposure (under 10 persons per sq.km or rural area) corresponding to the potential flood hazard areas (over 0.1 meters of water depth). Figure 3 shows the exposure similarity in a 10-year return period flood with affected population in consideration of spatial and temporal distribution of flood extent. Although the two large floods show difference in inundated area i.e, blue and yellow pixels in Figure 1 between 2007 and 2015, the total number of affected population was quite similar to historical record data: e.g., Koijuri union at site 3 in Figure 1 was damaged and 90% of its population were affected by the 2007 flood. In particular people living in the Sirajganj district were exposed to flood risk along the natural levees of the Brahmaputra River with the delta distributary system of Bangladesh.
Figure 3. Comparison of maximum potential affected population due to maximum flood extent map from MODIS-derived water
index during 16 days in (a) 2007 and (b) 2015.
4. CONCLUSIONS
This study is expected to be useful not only to monitor and analyze floods but also to standardize nationwide flood monitoring and to develop a framework to implement a national policy for disaster risk management. Near-real-time disaster monitoring technologies such as the ones proposed in this study will help provide local areas with important information for disaster prevention, and will be effective in assisting emergency restoration efforts when a large-scale water-related disaster occurs in a developing country with limited disaster-related information. We concluded that this risk mapping approach will have practical influence on the reduction of people affected in flood plains at the local and national levels. We confirmed that flood exposure mapping can be a key tool for planning land use programs, linking exposure assessment to risk assessment, and developing low-cost solutions for various risk reduction issues in different sectors. Flood exposure risk maps were produced based on the distributed hazard maps of the 2007 and 2015 floods, including flood plains where people may be affected. These exposure maps can represent a clear relationship between water levels and estimated water depths in Bangladesh. The preliminary results can be quickly shared among stakeholders, districts, and administrative agencies for supporting them to make decisions on issues such as effective emergency response procedures and annual plans in water resource and disaster risk management.
In near future, many improvements should be made to increase the accuracy of flood detection obtained by high temporal, spatial, and spectral information by coupling with water level and water depth data. The selection of suitable sensors is a major challenge in the development of disaster flood and risk maps, considering cost effectiveness and data quality. After that, the data collection of satellite image including radar (SAR) data needs to be considered in order to overcome the lack of data. In particular, the utilization of SAR data will be able to radically increase the availability of quality data during a flood. SAR can also be used for the derivation of added-value disaster information during rapid mapping activities and impervious surface estimation such as flood detection and damage mapping in large-scale areas in order to respond to an urgent demand instead of an interpretation method because the SAR can provide consistent high quality data during a monsoon season for flood monitoring and proxy damage estimation. Although the SAR data presents extraordinary sensitivity with regard to surface morphology and roughness differences, the filtering and interferometry algorithm of SAR power image should be improved to reduce speckle noise and signal ambiguities with different geometric behaviour. We are also considering a plan to produce a nationwide flood propagation map of Bangladesh with the characteristics of floodwater velocity coupling with a dynamic hydraulic model.
ACKNOWLEDGEMENTS
This work was supported by the Japan Society for the Promotion of Science (JSPS) KAKENHI Grant-in-Aid for Scientific Research B: 15H05136.
REFERENCES
Alsdorf, D.; Lettenmaier, D.; Vorosmarty, C., 2003. The need for global, satellite based observations of terrestrial surface waters. Eos Trans. Am. Geophys. Union, 84, pp.275–276. Bangladesh Bureau of Statistics (BBS), 2012. Yearbook of Agricultural Statistics; Statistics and Informatics Division (SID), Ministry of Planning, Government of the People’s Republic of Bangladesh: Dhaka, Bangladesh.
Bangladesh Water Development Board (BWDB), 2007. Annual flood report 2007, Flood Forecasting & Warning Centre (FFWC), Dhaka, Bangladesh.
Bangladesh Water Development Board (BWDB), 2014. Flood Forecasting & Warning Centre (FFWC), Available online: http://www.ffwc.gov.bd (20 September 2011).
Brakenridge, G.R.; Syvitski, J.P.M.; Overeem, I.; Stewart-Moore, J.A.; Kettner, A.J.; Westerhoff, R. 2012. Global mapping of storm surges, 2002-present and the assessment of coastal vulnerability. Nat. Hazards, 66, pp.1295–1312.
Budhendra, B., E. Bright, P. Coleman, and M. Urban, 2007. The LandScanTM USA: a high-resolution geospatial and temporal modeling approach for population distribution and dynamics, GeoJournal, 69, pp. 103-117.
Hofer, T.; Messerli, B., 2006. Floods in Bangladesh: History, Dynamics and Rethinking the Role of the Himalayas; United Nations University Press: Tokyo, Japan.
Kwak, Y., Iwami,Y., 2014. Global River Flood Exposure Assessment Under Climate Change: How Many Asians Are Affected By Flood In The Future? American Geophysical Union (AGU) 2014 Fall meeting Abstract.
Kwak, Y.J.; Park, K.; Fukami, J., 2014, Near real-time flood volume estimating from MODIS time-series imagery in the Indus River basin. IEEE J. Sel. Top. Appl. Earth Obs. Remote Sens. 7, pp. 578–586.
Kwak, Y.; Arifuzzanman, B.; Iwami, Y., 2015, Prompt Proxy Mapping of Flood Damaged Rice Fields Using MODIS-Derived Indices. Remote Sens. 7, pp. 15969-15988.
Lee, S., Okazumi, T., Kwak, Y., Takeuchi, K., 2015. Vulnerability Proxy Selection and Risk Calculation Formula for Global Flood Risk Assessment: a Preliminary Study, Water Policy, 17(1), pp. 8-25.
Lehner, B., Verdin, K., and Jarvis, A., 2008. New global hydrography derived from spaceborne elevation data. EOS Transactions, AGU, 89(10): pp.93-94. Available online: http://hydrosheds.cr.usgs.gov (15 January 2011)
Merz, B.; Kreibich, H.; Thieken, A.H.; Schmidtke, R., 2004. Estimation uncertainty of direct monetary flood damage to buildings. Nat. Hazards Earth Syst. Sci., 4, pp.153–163.
National Aeronautics and Space Administration (NASA). Near Real-Time (NRT) Global MODIS Flood Mapping. January 2015. Available online: http://oas.gsfc.nasa.gov/floodmap/ Pinheiro, A.C.T.; Descloitres, J.; Privette, J.L.; Susskind, J.; Iredell, L.; Schmaltz, J. Near-real time retrievals of land surface temperature within the MODIS rapid response system. Remote Sens. Environ. 2007, 106, 326–336.
The United Nations Economic and Social Commission for Asia and the Pacific (UNESCAP), Statistical Year for Asia and the
Pacific 2012. Available online:
http://www.unescap.org/stat/data/syb2013/F.5-Natural-disasters.asp (10 January 2014).
United Nations Office for Disaster Risk Reduction (UNISDR), 2011. Global assessment report on disaster risk reduction 178 p. New York, NY, USA; Geneva, Switzerland.
United Nations Office for Disaster Risk Reduction (UNISDR), 2012. Reducing vulnerability and exposure to disasters: Asia-Pacific disaster report 2012, New York, NY, USA; Geneva, Switzerland.
World Bank, 2010. Bangladesh - Economic of adaptation to climate change : Main report. 130 p, Washington, DC, USA.