CALIBRATING CELLULAR AUTOMATA OF LAND USE/COVER CHANGE MODELS
USING A GENETIC ALGORITHM
J.F. Masa∗, B. Soares-Filhob, H. Rodriguesb
a
Centro de Investigaciones en Geograf´ıa Ambiental, Universidad Nacional Aut´onoma de M´exico, 58190 Morelia, Mexico - [email protected]
b
Centro de Sensoriamento Remoto, Universidade Federal de Minas Gerais, Belo Horizonte 31270-900, MG, Brasil - [email protected]
Commission II, WG II/4
KEY WORDS:Stochastic spatial simulation, Genetic algorithm, Amazon deforestation, landscape pattern, fragmentation, connectivity
ABSTRACT:
Spatially explicit land use / land cover (LUCC) models aim at simulating the patterns of change on the landscape. In order to simulate landscape structure, the simulation procedures of most computational LUCC models use a cellular automata to replicate the land use / cover patches. Generally, model evaluation is based on assessing the location of the simulated changes in comparison to the true locations but landscapes metrics can also be used to assess landscape structure. As model complexity increases, the need to improve calibration and assessment techniques also increases. In this study, we applied a genetic algorithm tool to optimize cellular automata’s parameters to simulate deforestation in a region of the Brazilian Amazon. We found that the genetic algorithm was able to calibrate the model to simulate more realistic landscape in term of connectivity. Results show also that more realistic simulated landscapes are often obtained at the expense of the location coincidence. However, when considering processes such as the fragmentation impacts on biodiversity, the simulation of more realistic landscape structure should be preferred to spatial coincidence performance.
1. INTRODUCTION
Spatially explicit land use / land cover change (LUCC) mod-els aim at simulating the patterns of change on the landscape (Paegelow et al., 2013). Many of the models are based on a in-ductive pattern-based approach: In this approach, LUCC is mod-elled empirically using past LUCC spatial distribution and rate to develop a mathematical model that estimates the change poten-tial as a function of a set of explanatory spapoten-tial variables and the expected amount of change (Paegelow and Olmedo, 2005; Mas et al., 2014). In prospective modelling, allocation procedures are used to simulate the projected amount of change in the most likely locations. In order to simulate landscape structure and fragmen-tation pattern, the simulation procedures of most compufragmen-tational LUCC models use a cellular automata (CA) that intends to repli-cate the land use/cover (LUC) patches.
Generally, the assessment of model performance is based on the spatial coincidence between a simulated map and an observed LUC map for the same date and does not evaluate the model abil-ity to simulate the landscape pattern as, for instance, the size, the shape and the distribution of patches. Landscapes metrics can be used to assess simulated landscape structure (Mas et al., 2012). As model complexity increases, the need to improve calibration techniques also increases. This study aims at applying a genetic algorithm to optimize cellular automata’s parameters to simulate deforestation in a region of the Brazilian Amazon.
2. MATERIALS
Dinamica EGO freeware (hereafter DINAMICA) is an environ-mental modeling platform for the design of space-time models. It has been applied to a variety of studies, such as modeling tropi-cal deforestation (Soares-Filho et al., 2001, 2002, 2006; Cuevas and Mas, 2008), urban growth (Almeida et al., 2005), fire regimes
∗Corresponding author
(Silvestrini et al., 2011) and, landscape patterns (Pe’er et al., 2013; Soares Filho et al., 2003), among others. We chose it due to its flexibility and computing eficiency (Mas et al., 2014).
We used a portion of one of the 12 case-study areas from Soares-Filho et al. (2013), comprising a TM-Landsat scene map from the PRODES project (INPE, 2011). The study area is located in the State of Par´a along the road between Santar´em and Cuiab´a. Deforestation maps encompassing the years 1997 and 2001 were rasterized into a 250-m raster. As spatial drivers of deforesta-tion, we selected only three variables from the dataset: distance to previously deforested lands, proximity to roads and, elevation in order to have a simple model easier to interpret.
3. METHODS
DINAMICA uses transition probability maps that are based on a Bayesian method of conditional probability known the weight of evidence method. These maps of probability are used to simu-late landscape dynamics using both Markov matrices to project the quantity of change and a cellular automata (CA) approach to reproduce spatial patterns (Soares-Filho et al., 2002, 2010). Two complementary CA are available: the Expander, that simulates the expansion of previously formed patches and, the Patcher that generates new patches through a seeding mechanism. The be-haviour of the CA is controlled by four main parameters: the mean patch size, the patch size variance, the isometry and the prune factor. Increasing patch size value leads to simulated maps with a less fragmented landscape; increasing the patch size vari-ance leads to a more diverse landscape in term of size of the patches. Setting the isometry value greater than one leads to cre-ate more isometric patches. Increasing the prune factor allows simulated changes to occur in less likely areas. With a prune factor of one, the model becomes almost deterministic, that is changes are restricted to the areas with higher change probability (Soares-Filho et al., 2002; Mas et al., 2014).
DINAMICA has also a genetic algorithm tool which has been The International Archives of the Photogrammetry, Remote Sensing and Spatial Information Sciences, Volume XL-3/W3, 2015
ISPRS Geospatial Week 2015, 28 Sep – 03 Oct 2015, La Grande Motte, France
This contribution has been peer-reviewed. Editors: A.-M. Olteanu-Raimond, C. de-Runz, and R. Devillers
doi:10.5194/isprsarchives-XL-3-W3-67-2015
used to calibrate the weights of evidence (Soares-Filho et al., 2013). Genetic algorithms are based on the Darwinian mecha-nisms of evolution and attempt to mimic the natural evolution of a population by selection, combination, and mutations (random changes in genes). Each chromosome is composed of genes that define its characteristics. In computational models, a chromo-some is a string of numbers encoding the parameters that the ge-netic algorithm attempts to optimize. First, a population of chro-mosomes is created randomly. Subsequently, the genetic algo-rithm generates new individuals from the existing ones by means of processes of selection, crossover and mutation. The parents are selected from the best chromosomes, according to a fitness criterion. To increase genetic heterogeneity, mutation and cross-over operators randomly changes or interchange some genes on a chromosome sequence. A new generation is created by copy-ing the most successful individuals, by crosscopy-ing-over them and by mutating some chromosome sequences. These processes gen-erate a new population of chromosomes with a greater chance of including a near-optimum solution for the problem. This evo-lution process iterates until the fitness-stopping criterion is sat-isfied. Genetic algorithms have been shown to be able to opti-mize multi-parameter function Wang (1997). In the present study, the genetic algorithm optimizes the four main parameters of the Parcher CA: the mean patch size, the patch size variance, the isometry and, the prune factor.
Forest Maps of 1997 and 2001 were overlaid in order to map deforested and conserved forest area. This deforestation map al-lowed to compute a matrix of Markov, the weights of evidence and a map of probability using the three explanatory variables (see appendix). Then deforestation was simulated from 1997 to 2001 using the 1997 as initial LUC map, the matrix of Markov to calculate expected annual deforested area and the set of weights of evidence to compute the probability of change. The variable distance from previously deforested area is a dynamic variable, that is computed at each annual iteration of the simulation. It is worth noting that, in the present case, the training (or calibration) period is the same than the simulation period because the objec-tive of the study is fitting the model and not testing its prospecobjec-tive ability.
The CA calibration aimed at fitting the parameters in order to simulate a landscape similar to true landscape with regards to the size of the patches of deforestation and its general spatial distri-bution (e.g. avoiding that simulated changes concentrate in most likely areas, near previous deforested area when in true landscape there are also a little quantity of changes in remote areas). We calculated three indices which depict the landscape characteris-tics: The mean area of the deforestation patches (DPMA), the standard deviation of the deforestation patches area (DPASD) and the mean distance to deforested patches in remote areas (MDFPr) which is the mean distance of forest cells to deforested area tak-ing into account only cells located at a larger distance than the average distance. Fitness was assessed through the difference of the indices for the true change and the simulated change maps. The fitness criterion was computed by the weighted sum of three fitness components (equation 1).
δDP M A= Absolute value of the difference of
index DPMA between simulated and true map,
δDP SD= Absolute value of the difference of index DPSD between simulated and true map,
δM DF Pr= Absolute value of the difference of
indexM DF Prbetween simulated and true map.
Final simulated map was assessed by visual inspection and through the computing of the spatial coincidence between true change and simulated changes during 1997-2001.
4. RESULTS
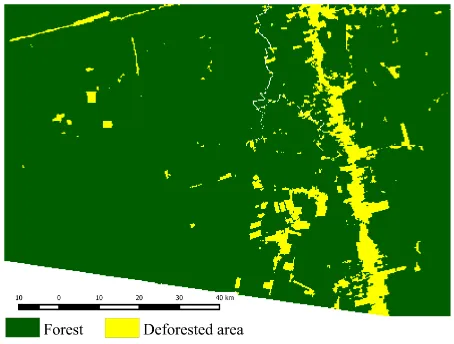
Figures 1, 2 and 3 present the forest in 1997, 2001 and the de-forested areas during the period 1997-2001 respectively. Fig-ure 4 shows the map of probability of deforestation according to the weights of evidence based on the three explanatory vari-ables (maps of explanatory varivari-ables are in appendix). It can be observed that change presents a clear spatial pattern (patches) and occurred mainly on high probability areas but also in less likely areas (e.g. remote areas).
Figure 1: Land use / cover map (1997)
Figure 2: Land use / cover map (2001)
Figures 5 represents the simulated LUCC map from the modelled which CA was calibrated by the genetic algorithm. As compar-ison, figure 6 shows the simulated LUCC map thresholding the cells with the highest probability to simulate the change. It can be observed that the map obtained using CA is more realistic in term of landscape structure because it presents patches of defor-estation of broadly the same size and distribution than the true map of change (Figure 3). However, the unrealistic map obtained without CA has a higher coincidence with true map (29%) than the more realistic map obtained with the CA calibrated by the ge-netic algorithm (22%).
The International Archives of the Photogrammetry, Remote Sensing and Spatial Information Sciences, Volume XL-3/W3, 2015 ISPRS Geospatial Week 2015, 28 Sep – 03 Oct 2015, La Grande Motte, France
This contribution has been peer-reviewed. Editors: A.-M. Olteanu-Raimond, C. de-Runz, and R. Devillers
doi:10.5194/isprsarchives-XL-3-W3-67-2015
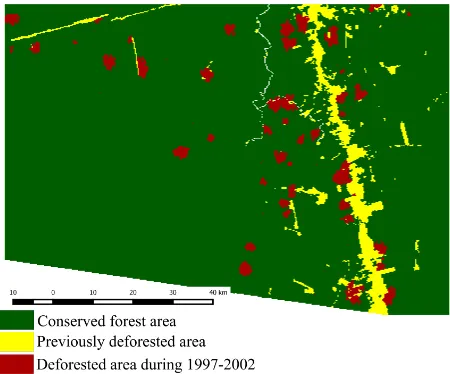
Figure 3: LUCC map (1997-2002). Previously deforested area refers to forest area cleared before 1997. Some deforestation patches are located in remote areas
Figure 4: Map of probability of deforestation (1997)
Figure 5: Simulated LUCC map (1997-2002) using the CA cali-brated by the genetic algorithm. Previously deforested area refers to forest area cleared before 1997
Figure 6: Simulated LUCC map (1997-2002) applying a thresh-old to the probabilities. Previously deforested area refers to forest area cleared before 1997
5. CONCLUSION
We found that the genetic algorithm was able to calibrate the model’s CA to simulate more realistic landscape in term of con-nectivity. Different spatial patterns can be observed depending on human activities contributing to deforestation as cattle ranching, shifting cultivation, commercial agriculture or logging (Anwar and Stein, 2015; Lorena and Lambin, 2007). This approach can be used to calibrate LUCC models and other types of models aim-ing at simulataim-ing landscape patterns. Results show also that more realistic simulated landscapes are often obtained at the expense of the location coincidence. However, when LUCC modelling is used to assess processes such as the fragmentation impacts on biodiversity, the simulation of more realistic landscape structure and change dynamics should be preferred to spatial coincidence performance (Malanson et al., 2007; Mas et al., 2012).
ACKNOWLEDGEMENTS
This study was supported by theConsejo Nacional de Ciencia y Tecnolog´ıa(CONACYT) and theSecretar´ıa de Educaci´on P´ublica
through the project¿Puede la modelacin espacial ayudarnos a entender los procesos de cambio de cobertura/uso del suelo y de degradacin ambiental?-Fondos SEP-CONACyT 178816.
References
Almeida, C. M. D., Monteiro, A. M. V., Cˆamara, G., Soares-Filho, B. S., Cerqueira, G. C., Pennachin, C. L. and Batty, M., 2005. GIS and remote sensing as tools for the simulation of ur-ban landuse change. International Journal of Remote Sensing 26(4), pp. 759–774.
Anwar, S. and Stein, A., 2015. Spatial pattern development of selective logging over several years. Spatial Statistics 13(0), pp. 90–105.
Cuevas, G. and Mas, J., 2008. Land use scenarios : a communica-tion tool. In: M. Paegelow and M. T. Camacho-Olmedo (eds), Modelling Environmental Dynamics, Springer Berlin Heidel-berg, Berlin, chapter Land use s, pp. 223–246.
INPE, 2011. PRODES: Assessment of Deforestation in Brazilian Amazonia.
The International Archives of the Photogrammetry, Remote Sensing and Spatial Information Sciences, Volume XL-3/W3, 2015 ISPRS Geospatial Week 2015, 28 Sep – 03 Oct 2015, La Grande Motte, France
This contribution has been peer-reviewed. Editors: A.-M. Olteanu-Raimond, C. de-Runz, and R. Devillers
doi:10.5194/isprsarchives-XL-3-W3-67-2015
Lorena, R. and Lambin, E., 2007. Linking spatial patterns of deforestation to land use using satellite and field data. In: Geoscience and Remote Sensing Symposium, 2007. IGARSS 2007. IEEE International, pp. 3357–3361.
Malanson, G. P., Wang, Q. and Kupfer, J. A., 2007. Ecological processes and spatial patterns before, during and after simu-lated deforestation. Ecological Modelling 202(34), pp. 397– 409.
Mas, J.-F., Kolb, M., Paegelow, M., Camacho Olmedo, M. T. and Houet, T., 2014. Inductive pattern-based land use/cover change models: A comparison of four software packages. En-vironmental Modelling & Software 51, pp. 94–111.
Mas, J.-F., P´erez-Vega, A. and Clarke, K. C., 2012. Assessing simulated land use/cover maps using similarity and fragmen-tation indices. Ecological Complexity 11, pp. 38–45.
Paegelow, M. and Olmedo, M. T. C., 2005. Possibilities and limits of prospective GIS land cover modellinga compared case study: Garrotxes (France) and Alta Alpujarra Granad-ina (Spain). International Journal of Geographical Information Science 19(6), pp. 697–722.
Paegelow, M., Camacho Olmedo, M. T., Mas, J.-F., Houet, T. and Pontius Jr., R. G., 2013. Land change modelling: mov-ing beyond projections. International Journal of Geographical Information Science 27(October), pp. 1691–1695.
Pe’er, G., Zurita, G. A., Schober, L., Bellocq, M. I., Strer, M., M¨uller, M. and P¨utz, S., 2013. Simple Process-Based Simula-tors for Generating Spatial Patterns of Habitat Loss and Frag-mentation: A Review and Introduction to the G-RaFFe Model. PLoS ONE 8(5), pp. e64968.
Silvestrini, R. A., Soares-Filho, B. S., Nepstad, D., Coe, M., Ro-drigues, H. and Assunc¸˜ao, R., 2011. Simulating fire regimes in the Amazon in response to climate change and deforestation. Ecological Applications 21(5), pp. 1573–1590.
Soares-Filho, B., Moutinho, P., Nepstad, D., Anderson, A., Ro-drigues, H., Garcia, R., Dietzsch, L., Merry, F., Bowman, M., Hissa, L., Silvestrini, R. and Maretti, C., 2010. Role of Brazil-ian Amazon protected areas in climate change mitigation. Pro-ceedings of the National Academy of Sciences of the United States of America 107, pp. 10821–10826.
Soares-Filho, B., Rodrigues, H. and Follador, M., 2013. A hybrid analytical-heuristic method for calibrating land-use change models. Environmental Modelling and Software 43, pp. 80– 87.
Soares-Filho, B. S., Assunc¸˜ao, R. M. and Pantuzzo, A. E., 2001. Modeling the Spatial Transition Probabilities of Landscape Dynamics in an Amazonian Colonization Frontier. BioScience 51(12), pp. 1059.
Soares Filho, B. S., Corradi Filho, L., Coutinho Cerqueira, G. and Leite Ara´ujo, W., 2003. Simulating the spatial patterns of change through the use of the DINAMICA model. In: INPE (ed.), Anais do XI Simp´osio Brasileiro de Sensoriamento Re-moto - SBSR, Belo Horizonte, MG, Brasil, pp. 721–728.
Soares-Filho, B. S., Coutinho Cerqueira, G. and Lopes Pen-nachin, C., 2002. DINAMICA - A stochastic cellular au-tomata model designed to simulate the landscape dynamics in an Amazonian colonization frontier. Ecological Modelling 154, pp. 217–235.
Soares-Filho, B. S., Nepstad, D. C., Curran, L. M., Cerqueira, G. C., Garcia, R. A., Ramos, C. A., Voll, E., McDonald, A., Lefebvre, P. and Schlesinger, P., 2006. Modelling conservation in the Amazon basin. Nature 440, pp. 520–523.
Wang, Q., 1997. Using genetic algorithms to optimise model parameters. Environmental Modelling & Software 12, pp. 27– 24.
APPENDIX
Figure 7: Map of distance from roads used as explanatory vari-able
Figure 8: Digital model elevation used as explanatory variable
Figure 9: Map of distance from previously deforested area (1997). This map is updated at each modeling step
The International Archives of the Photogrammetry, Remote Sensing and Spatial Information Sciences, Volume XL-3/W3, 2015 ISPRS Geospatial Week 2015, 28 Sep – 03 Oct 2015, La Grande Motte, France
This contribution has been peer-reviewed. Editors: A.-M. Olteanu-Raimond, C. de-Runz, and R. Devillers
doi:10.5194/isprsarchives-XL-3-W3-67-2015