FOREST TREE SPECIES DISTRIBUTION MAPPING USING LANDSAT SATELLITE
IMAGERY AND TOPOGRAPHIC VARIABLES WITH THE MAXIMUM ENTROPY
METHOD IN MONGOLIA
Shou Hao Chianga*, Miguel Valdeza, Chi-Farn Chena
a Center for Space and Remote Sensing Research, National Central University, Jhongli City, Taoyuan 32001, Taiwan
Commission WG VIII/7
KEY WORDS: Tree species mapping, Landsat imagery, Maximum Entropy, Terrain variable, Mongolia
ABSTRACT:
Forest is a very important ecosystem and natural resource for living things. Based on forest inventories, government is able to make decisions to converse, improve and manage forests in a sustainable way. Field work for forestry investigation is difficult and time consuming, because it needs intensive physical labor and the costs are high, especially surveying in remote mountainous regions. A reliable forest inventory can give us a more accurate and timely information to develop new and efficient approaches of forest management. The remote sensing technology has been recently used for forest investigation at a large scale. To produce an informative forest inventory, forest attributes, including tree species are unavoidably required to be considered.
In this study the aim is to classify forest tree species in Erdenebulgan County, Huwsgul province in Mongolia, using Maximum Entropy method. The study area is covered by a dense forest which is almost 70% of total territorial extension of Erdenebulgan County and is located in a high mountain region in northern Mongolia. For this study, Landsat satellite imagery and a Digital Elevation Model (DEM) were acquired to perform tree species mapping. The forest tree species inventory map was collected from the Forest Division of the Mongolian Ministry of Nature and Environment as training data and also used as ground truth to perform the accuracy assessment of the tree species classification. Landsat images and DEM were processed for maximum entropy modeling, and this study applied the model with two experiments. The first one is to use Landsat surface reflectance for tree species classification; and the second experiment incorporates terrain variables in addition to the Landsat surface reflectance to perform the tree species classification. All experimental results were compared with the tree species inventory to assess the classification accuracy. Results show that the second one which uses Landsat surface reflectance coupled with terrain variables produced better result, with the higher overall accuracy and kappa coefficient than first experiment. The results indicate that the Maximum Entropy method is an applicable, and to classify tree species using satellite imagery data coupled with terrain information can improve the classification of tree species in the study area.
1. INTRODUCTION
Forests are one of the most valuable natural resources on Earth and play a vital role in achieving ecological balance (Torahi, Rai, and Al 2011). The importance of forests and the benefits they provide, locally and globally, have been extensively documented (FAO 2011). Acquiring relevant inventory information, such as tree species composition in forests, is an important tool to support sustainable forest management practices. Forest inventories are defined by Scott & Gove (2002)
as “an accounting of trees and their related characteristics of
interest over a well-defined land area,” and they have the overall purpose to compute the population of trees inside a forest and determine other relevant information to reach knowledgeable conclusions about the stand treatment required (Scott and Gove 2002).
Mongolia is a country with few forest resources when compared to its territorial extension; however, it holds 10th place in forestland area and 1st place in forest area per capita in the Asian continent (Tsogtbaatar 2000). The importance of Mongolian forests is also based on the benefits they provide for the local population, such as wood for fuel in rural areas, commercial logs, and wood for the industry sector (Dorjsuren 2008). Additionally, forests provide other non-timber related benefits, such as plants for subsistence, consumption, and household income. All forests in Mongolia are state-owned, and the Ministry of Nature and Environment (MNE) has the overall
responsibility to carry out a forest survey and inventory; to determine forest distribution, composition, and quality; and from that information determine conservation and restoration practices (Tsogtbaatar 2000).
Previous studies have demonstrated the use of remotely acquired data as complementary information with traditional methods such as interpretation of aerial photographs and field sampling to improve accuracy, minimize costs, and widen the array of possible applications to optimize forest management. Typically, a forest inventory requires acquiring specific tree species information, but using remote sensing data is still a challenging task, although some recent advances have been made (Foody et al. 2005). Ecological models are commonly used to predict geographic distributions of tree species. Other approaches for species distribution modelling and classification include the Maximum Entropy algorithm (MaxEnt) developed by Phillips et al. (2006), which requires a series of occurrence locations and a set of explanatory variables defining features that potentially influence the suitability of a species or an event. MaxEnt has been extensively applied for species distribution mapping (Kumar et al. 2014) for one-class classification purposes (Lin et al. 2014) and probability distribution in various other fields (Petrov and Wessling 2014). Because MaxEnt has shown higher predictive accuracy for classification problems and distribution modelling than other methods such as SVM and artificial neural networks (ANN) (Lin et al. 2014; Phillips et al. 2006), it was selected for this study.
The International Archives of the Photogrammetry, Remote Sensing and Spatial Information Sciences, Volume XLI-B8, 2016 XXIII ISPRS Congress, 12–19 July 2016, Prague, Czech Republic
This contribution has been peer-reviewed.
Our overall purpose was to classify different tree species within the forest of Erdenebulgan, Huwsgul province in Mongolia using the MaxEnt algorithm by linking the samples acquired with the topographic variables and spectral information from satellite imagery. We applied two acquired models to classify the forest tree species, the first using only satellite imagery as explanatory variables, and the second including satellite imagery coupled with topographic variables derived from a DEM. The forest tree species classification scheme proposed in this study aims to improve efficiency of forest classification in extensive mountainous regions with complex structures to aid sustainable forest management efforts.
2. STUDY AREA
The study site is a forest located between the Siberian taiga and the Mongolian plateau of grassland, a region that plays a vital role in preventing soil erosion, regulating the water regime, and providing suitable conditions for wildlife and biodiversity conservation (Tsogtbaatar 2000). However, forests in Mongolia grow in harsh climatic conditions where low precipitation and high radiation rates prevail throughout the year (FAO 2011); hence, they have a low capability to restore naturally and a heightened sensitive to forest wildfires, plagues, and degradation by human influence (Mühlenberg et al. 2012). For these reasons, a detailed description of the Mongolian forests is relevant for sustainable management purposes.
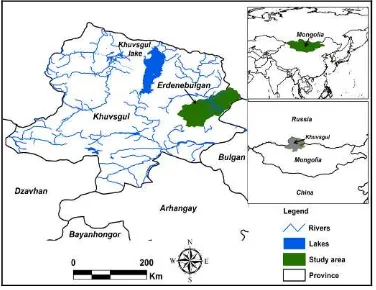
Forests in Mongolia comprise 140 species, 84% of which is coniferous and deciduous forests of the Forest Steppe, Boreal Forest, and Montane zones (FAO 2011). The most common tree species in these forests is Larix sibirica, commonly known as Siberian larch. The forests are mostly distributed throughout the northern region, essentially within Khangai Sum (District), Khentii Sum, and Khuvsgul Sum. The study area was specifically located in the Northern part of Mongolia in the province of Khuvsgul, Erdenebulgan, between 50°07'00" N and 101°35'12" E (Figure 1). The site has an area of 4,690 km2 with a forested area of 3,300 km2, approximately 71% of the total area. The topography is relatively mountainous, except for some fluvial plains in the central part. Most areas are in the elevation range of 1000 to 2200 m a.s.l.; the lowest elevations is where the population settlements and villages are located.
Figure 1. Location of the study area with administrative boundaries of provinces
3. MATERIALS AND METHODS
The main focus of this study was to map the distribution of forest tree species using satellite image data and to improve the forest tree species classification by integrating topographic information (Figure 2).
Two theoretically different types of datasets were acquired for classification of tree species, the first through an optical multispectral sensor and the second (the topographic variables) from a digital elevation model (DEM). For the first set of variables, a Landsat 8 image from September 5, 2013 was acquired. We selected that date because it matches our set criteria of being a cloud free scene from June to October, and in northern Mongolia, snow begins in early October and does not completely melt until the end of May. Second, to derive the topographic variables, Global Digital Elevation Model (GDEM) version 2 data with a resolution of 30 m were obtained from the advanced space-borne thermal emission and reflection radiometer (ASTER) operated by the National Aeronautics and Space Administration (NASA).
The ground truth was acquired through a forest inventory, which by law has to be conducted for specific forest areas in Mongolia. In the study area, the forest inventory started in 2011 and ended in 2012. The data analysis and processing was completed by the Forest Division in the Ministry of Nature and Environment (MNE). According to the field surveying, the study area has four main tree species: larch (Larix Sibirica), birch (Betula platy-phylla), cedar (Pinus Sibirica), and willow (Salix sp.) that cover approximately 90%, 4%, 5%, and 1% of the forested area in the study site, respectively. All datasets acquired for this study are shown in Figure 2.
Figure 2. a) Landsat 8 surface reflectance image in false color, b) ASTER GDEM and c) Forest tree species reference map for the study area developed in 2012 by the MNE
4. RESULTS AND DISCUSSION 4.1 Maximum entropy classification
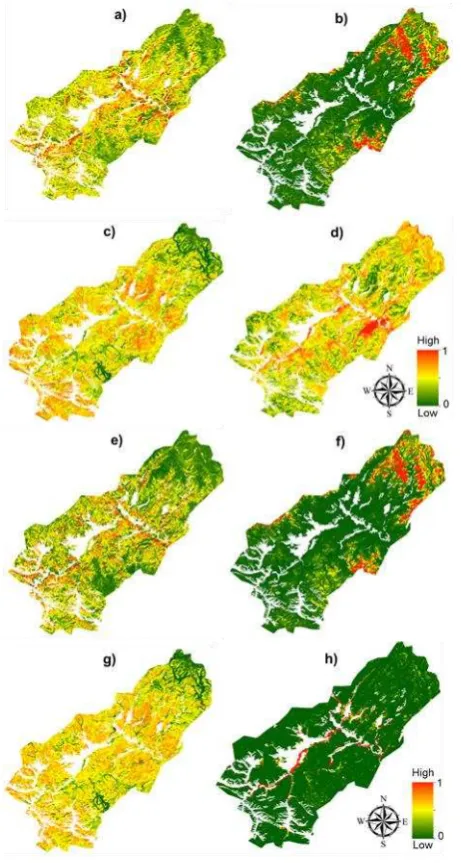
To classify the tree species, we generated their probability distribution with MaxEnt. The probability maps for each of the classification approaches (Figure 4) indicate that high probability in the study area represents high suitability of environmental conditions for the tree species. For some species, however, the high probability was overestimated when only the L8SR bands were used. When the topographic variables were included, the calculated logistic probability was more accurate than the forest inventory map. After the probability was acquired, clusters were assigned to a determined tree species by the classification rule specified previously. The classification of the four tree species derived from L8SR bands was determined (Figure 5a). As discussed previously, reference data from this
The International Archives of the Photogrammetry, Remote Sensing and Spatial Information Sciences, Volume XLI-B8, 2016 XXIII ISPRS Congress, 12–19 July 2016, Prague, Czech Republic
This contribution has been peer-reviewed.
study area contain these four tree species. When observing our classification result and comparing with the tree species inventory, the most dominant tree species is larch. The tree species distribution in the classification result are fairly similar within the distinct geographic regions. For some species, however, specifically birch, cedar, and willow, the overestimation regions are evident, further confirmed with the validation results, indicating that more relevant explanatory variables are needed to pinpoint with higher accuracy the corresponding regions of each tree species.
Figure 5. Probability for the presence of tree species using satellite imagery a) birch, b) cedar, c) larch, d) willow and using Landsat satellite imagery coupled with topographic variables e) birch f) cedar, g) larch and h) willow. Red and green indicate high (1) and low (0) probability respectively.
Following the classification of the tree species in the study area using L8SR bands, the topographic variables were included. The results of the tree species classification using L8SR bands coupled with topographic variables identified (Figure 6b) show a significant improvement when compared with the first
model’s classification results. In both the reference forest tree
species map and tree species classified map, the most dominant
tree species is larch, followed by birch and cedar. The geographical distribution was also more accurate than the classification using only the L8SR bands. The geographical distribution of all the tree species was more consistent with the ground truth forest inventory, and the overall improvement of the classification was further confirmed with the validation metrics.
Figure 6. Forest tree species classification map for the study area using a) Landsat 8 surface reflectance and b) topographic variables coupled with Landsat 8 surface reflectance. The area in white is masked out area where brushwood, shrubs, burned forest, bare soil and water is present.
4.2 Validation
The AUC provides a non-threshold estimate to evaluate the discriminatory ability of our models to predict the distribution of the four different tree species. The results (Table 1) indicate
that the model’s discriminatory ability to classify birch, cedar,
and willow was better than random when using L8SR bands only, and that a significant improvement was observed when topographic variables were included. The discriminatory ability for larch the models was only slightly better than random, and although some improvement was shown when topographic variables were included, additional explanatory variables are needed to improve its performance. The results were further evaluated to determine the reliability of the classification results using the contingency matrix.
Table 1. Reported AUC values for training set and test
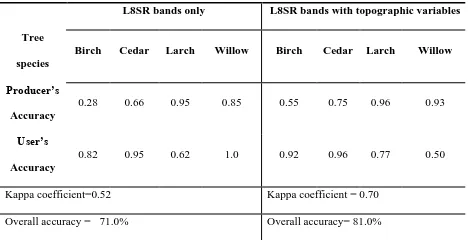
The producer, user, and overall accuracy were estimated as
well as the Cohen’s kappa coefficient. Sample points were
randomly extracted from the data and compared with the forest inventory developed on site, provided by the Forest Division of the MNE. The overall accuracy and Cohen’s kappa coefficient provide an accurate indication of our results compared with the forest inventory developed in the field. The Kappa coefficient value of 0.52 and the overall accuracy of 71% indicated a moderate performance for the classification of tree species
The International Archives of the Photogrammetry, Remote Sensing and Spatial Information Sciences, Volume XLI-B8, 2016 XXIII ISPRS Congress, 12–19 July 2016, Prague, Czech Republic
This contribution has been peer-reviewed.
using the L8SR bands (Table 2), which answers our first exploratory question defined in section 1 regarding the accuracy of classifying tree species by satellite imagery alone. For the classification results with the second estimation using the L8SR bands with topographic variables, an estimated overall accuracy of 81% was acquired with a Kappa coefficient of 0.70 (Table 2).
Table 2. Accuracy assessment results for classification map using L8SR bands only and L8SR bands coupled with topographic variables
L8SR bands only L8SR bands with topographic variables
Tree
Kappa coefficient=0.52 Kappa coefficient = 0.70
Overall accuracy = 71.0% Overall accuracy= 81.0%
The classification of larch indicates that spectral information acquired from satellite imagery and topographic variables are not sufficient for classifying larch and that additional relevant explanatory variables may further improve the results. The other tree species classified in this study, however, showed higher accuracy when additional relevant topographic variables were incorporated for modelling, confirming the importance of integrating these variables with spectral satellite information for tree species classification. Based on this evidence, the non-conventional machine learning algorithm, MaxEnt, shows high potential for complex classifications compared to traditional classifiers. Another more traditional classifier (SVM) was used in preliminary assessment coupling satellite imagery and topographic variables, but the results did not capture the overall complexity involved in forest structure and tree species ecological variability on the study site. Incorporating enhanced and extensive information into the tree species classification scheme is likely to further improve the accuracy, but this work goes beyond the scope of this study, and accuracy is usually dependent on the quality of the data and on the model assumptions. The final classification of the tree species with the proposed scheme appears to be fairly accurate.
5. CONCLUSION
This research demonstrates the ability of remote sensing technology to classify forest tree species. We classified as accurately as possible the tree species in a coniferous and deciduous forest in Northern Mongolia using two different experiments. Overall, the method of forest tree species classification was acceptable and could be used to classify tree species in other regions. Forest tree species classification results using L8SR bands had a 71% overall accuracy and a kappa coefficient of 0.52. From these results, we can conclude that satellite image spectral information is not sufficient to separate some of the tree species in the study site. Forest tree species classification results using both spectral bands and topographic data had an 81% overall accuracy with kappa coefficient of 0.70. In total, four tree species were classified: larch, birch, cedar, and willow. The results lead us to conclude that the integration of satellite image, specifically the L8SR V 0.3.1 and topographic data, greatly influence the overall classification
results for tree species using the Maximum Entropy approach. Accuracy assessment results derived from both L8SR and topographic data had a better accuracy compared with results generated from only L8SR. Overall accuracy and kappa coefficient increased by 10% and 0.18, respectively, compared with results using standalone L8SR satellite imagery. The following recommendations originate from our forest tree species classification of the study area. The main problem of the Mongolian forestry sector is poor management. Today, we must improve current management structure and organization of the forest sector to adapt to real, modern requirements. To improve forest management, we must acquire accurate forest inventory data for the whole country. Future research on tree species classification should focus on the addition of other relevant variables, such as rainfall registers and soil data, to enhance the potential of the classification scheme.
REFERENCES
FAO. 2011. The State Of The World’s Land And Water Resources For Food And Agriculture. Managing Systems at Risk. Rome: Earthscan, London.
Foody, Giles M., Peter M. Atkinson, Peter W. Gething, Neil a Ravenhill, and K. Kelly. 2005. “Identification of Specific Tree Species in Ancient Semi-Natural Woodland from Digital Aerial
Sensor Imagery.” Ecological Applications 15(4):1233–44. Kumar, Sunil, Lisa G. Neven, and Wee L. Yee. 2014.
“Assessing the Potential for Establishment of Western Cherry Fruit Fly Using Ecological Niche Modeling.” Journal of Economic Entomology 107(3):1032–44.
Lin, Jinyao, Xiaoping Liu, Kai Li, and Xia Li. 2014. “A
Maximum Entropy Method to Extract Urban Land by Combining MODIS Reflectance , MODIS NDVI , and DMSP-
OLS Data.” International Journal of Remote Sensing 35(18):37–41.
Liu, Jiajia, Tan Yunhong, and J. W. Ferry Slik. 2014.
“Topography Related Habitat Associations of Tree Species
Traits, Composition and Diversity in a Chinese Tropical
Forest.” Forest Ecology and Management 330:75–81.
Mühlenberg, M., J. Appelfelder, H. Hoffmann, E. Ayush, and K.
J. Wilson. 2012. “Structure of the Montane Taiga Forests of West Khentii, Northern Mongolia.” Journal of Forest Science 58(2):45–56.
Petrov, Andrey and Jordan Wessling. 2014. “Utilization of
Machine-Learning Algorithms for Wind Turbine Suiatability Modelling in Iowa, USA.” Wind Energy 18:713–27.
Phillips, S. J. and Miroslav Dudik. 2008. “Modeling of Species
Distributions with Maxent: New Extensions and a
Comprehensive Evaluation.” Ecography 31(2):161–75. Phillips, Steven J., Robert P. Anderson, and Robert E. Schapire.
2006. “Maximum Entropy Modeling of Species Geographic Distributions.” Ecological Modelling 190(3-4):231–59.
Scott, Charles T. and Jeffrey Gove. 2002. “Forest Inventory.”
Pp. 814–20 in Encyclopedia of Environmetrics, vol. 2, edited by A. H. El Shaarawi and W. Piegorsch. John Wiley & Sons.
Tsogtbaatar, Jamsran. 2000. “Forest Policy Development in
Mongolia.” 60–69.
The International Archives of the Photogrammetry, Remote Sensing and Spatial Information Sciences, Volume XLI-B8, 2016 XXIII ISPRS Congress, 12–19 July 2016, Prague, Czech Republic
This contribution has been peer-reviewed.