COMPREHENSIVE EVALUATION OF URBAN SPRAWL ON ECOLOGICAL
ENVIRONMENT USING MULTI-SOURCE DATA: A CASE STUDY OF BEIJING
Hao Wang a, *, Xiaogang Ning a, Weiwei Zhu b, Fei Li c a
Institute of photogrammetry and remote sensing, Chinese Academy of Surveying and Mapping, Beijing, China – (wanghao, ningxg)@casm.ac.cn
b
Institute of Remote Sensing and Digital Earth, Chinese Academy of Sciences, Beijing, China - [email protected] c
Nanjing Institute of Geography and Limnology, Chinese Academy of Sciences, Nanjing, China - [email protected]
Commission VIII, WG VIII/8
KEY WORDS: Urban sprawl, Ecological environment, Beijing, Multi-source data, Multiscale
ABSTRACT:
With urban population growing and urban sprawling, urban ecological environment problems appear. Study on spatiotemporal characteristics of urban sprawl and its impact on ecological environment is useful for ecological civilization construction. Although a lot of work has been conducted on urban sprawl and its impact on ecological environment, resolution of images to extract urban boundary was relatively coarse and most studies only focused on certain indicators of ecological environment, rather than comprehensive evaluation of urban ecological environmental impact. In this study, high-resolution remote sensing images of Beijing from aerial photography in 2002 and 2013 respectively are employed to extract urban boundary with manual interpretation. Fractional Vegetation Coverage (FVC), Water Density (WD), Impervious Surfaces Coverage (ISC), Net Primary Production (NPP), and Land Surface Temperature (LST) are adopted to represent ecological environment. The ecological environment indicators are measured with some general algorithms by combining Landsat images, GIS data and metrological data of 243 day, 2001 and 244 day, 2013. In order to evaluate the impact of urban sprawl on ecological environment, pseudo changes due to metrological variation and other noise in this time period are removed after images calibration. The impact of urban sprawl on ecological environment is evaluated at different scales of urban extent, Beijing ring road and watershed. Results show that Beijing had been undergoing a rapid urbanization from 2002 to 2013, with urban area increase from 600 square kilometres to 987 square kilometres. All ecological environment indicators except LST became terrible in urban sprawl region, with carbon reduction of approximate 40508 tons. The Beiyun River watershed of Beijing degraded seriously since ISC increased to 0.59. Gratifyingly, ecological environment indicators including NDVI, NPP, and LST inside of 4th Ring Road became well.
* Corresponding author
1. INTRODUCTION
With the development of urbanization, more and more population resides in cities. Along with the rapid growth of urban populations comes rapid urban sprawl. Although urbanization improves socioeconomic development and life quality, urban sprawl inevitably converts the natural and semi-natural ecosystems into artificial ecosystem, which results in enormous ecological and environmental challenges, such as heat island effect (Yuan and Bauer, 2007), local climate change (Stone et al., 2010), arable land loss (Tan et al., 2005), and water pollution (Yin et al., 2005). In order to timely find the ecological and environment problems resulting from such a drastic urban sprawl and provide some effective suggestion for urban planning and a sustainable future development, effective analytical methods to monitor the urban sprawl and evaluate the effect of urban sprawl on the ecological and environment are crucial.
Although a lot of work has been conducted on urban sprawl and its impact on ecological environment, resolution of images to extract urban boundary was relatively coarse (Wang et al., 2012), and most studies only focused on certain indicators of
ecological environment at one scale, rather than comprehensive evaluation of urban ecological environmental impact at multiscale. The objective of this research is to metric urban sprawl of Beijing from year 2002 to 2013 and the effects of urban sprawl on the ecological environment by quantification of ecological and environmental indicators by using multisource remotely sensed data, GIS data and metrological data at different scales, which are urban areas scale, Beijing ring road scale, and watershed scale.
2. MATERIALS AND METHODS
2.1 Study area
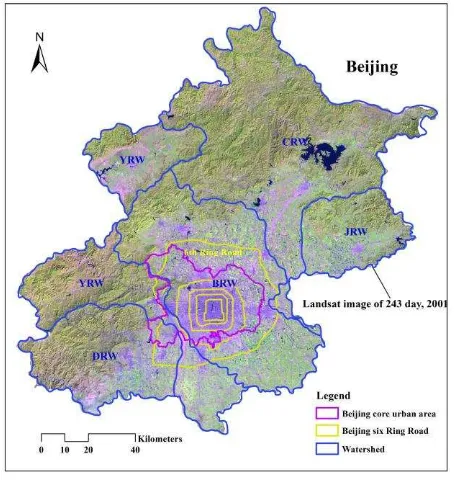
Beijing, which has an area of 16410 km2, was selected as study area (Figure 1). Beijing is China's capital, and it has experienced a rapid urban expansion in recent years. By the end of 2015, Beijing has a population of over 21 million. Six ring roads are the main transportation arteries. Nearly all of the core urban areas are inside of 6th Ring Road, which has an area of over 2300 km2 and population of over 15 million. Beijing covers five watersheds, which are Chaobai River Watershe (CRW), Yongding River Watershed (YRW), Daqing River The International Archives of the Photogrammetry, Remote Sensing and Spatial Information Sciences, Volume XLI-B8, 2016
Watershed (DRW), Beiyun River Watershed (BRW) and Jiyun River Watershed (JRW). Among all of the watersheds, Beiyun River Watershed, which is independent and covers most of the Beijing core urban areas, was selected to analyze the aquatic ecosystems environment of Beijing core urban areas by estimating impervious surface coverage at watershed scale.
Figure 1. Map of study area
2.2 Data preparation
High-resolution aerial photographs of 2002 and 2013 were selected to extract urban boundary and six ring roads of Beijing with manual interpretation. Landsat image scenes (Row 123/ Path 032, Row 123/ Path 033) of 243 day, 2001 and 244 day, 2013, which reduced unreal changes caused by seasonal differences, were selected to extract the ecological environment indicators. All of the images were geometrically rectified to the high-resolution aerial photographs of 2013. A second-order polynomial and the nearest neighbor resampling method were employed for implementing the geo-rectification. The digital numbers (DN) of the Landsat images were converted to normalize exoatmospheric reflectance with the calibration parameters, which can be retrieved from the image head files. Landsat images were mosaicked and clipped to the extent of Beijing with the administrative division boundary. Precipitation and air temperature of the meteorological stations inside of Beijing were used to general areal precipitation with the method of inverse distant interpolation.
2.3 Urban Boundary Extraction
Urban boundary was extracted by using high-resolution aerial photographs with a series of manual interpretation. These rules are as follows. Urban areas are usually surrounded by street. Urban boundary cannot exceed administrative divisions boundary. Tall buildings, communities, stadiums, and green lands belong to urban areas. Low buildings, which are surrounded by tall buildings, belong to urban areas. Isolated buildings and enclave buildings are judged according to their landscape characters, area and distance to the determined urban areas.
2.4 Ecological Environment Indicators Estimation
Fractional vegetation cover (FVC) is termed as the ratio of the vertical projected area of vegetation to the total ground area. FVC is a commonly used indicator for evaluating and monitoring vegetation abundance in urban areas. Vegetation can not only purify the air but also regulate latent/sensible heat exchange and local climate by absorbing and reflecting solar radiation. FVC is estimated with NDVI (Li et al., 2004). NDVI is defined as (NIR − Red)/(NIR + Red), where Red and NIR are the atmospherically corrected reflectance of Landsat.
Water density (WD) is termed as the ratio of the area of water surface to the whole region area. WD is a commonly used indicator for evaluating water abundance in urban areas. Water can regulate local climate and beautify the environment. Water surface is estimated with MNDWI threshold partition method (Lu et al., 2011). MNDVI is defined as (Green −SWIR)/(NIR + Red), where Green and SWIR are the atmospherically corrected reflectance of Landsat.
Impervious surface coverage (ISC) is the percentage of impervious surface in an area as large as a drainage basin or as small as an area which a pixel stands for (Wang et al., 2011). Impervious surfaces are anthropogenic features through which water cannot infiltrate into the soil, such as rooftops, roads, driveways, sidewalks, and parking lots, among others (Arnold and Gibbons, 1996). ISC is the comprehensive reflection of aquatic ecological environment and water quality at watershed scale. ISC is estimated with multiple endmember spectral mixture analysis (MESMA) method by using Landsat images (Wang et al., 2011).
Net primary production (NPP) represents the accumulated organic matter by plants per unit area and time (Odum et al., 1971). NPP is an important factor that provides a comprehensive evaluation of ecosystem status and services, including productivity capability, habitat, and wildlife, and ecological footprint (Crabtree et al., 2009). NPP is estimated with CASA (Carnegie-Ames-Stanford) model by using Landsat images, precipitation data and air temperature data (Potter et al., 1993).
Land Surface Temperature (LST) is related to surface energy and water balance, at local through global scales, with principal significance for a wide variety of applications, such as climate change, urban climate, and the hydrological cycle. In this study, brightness temperature is used to represent LST, and it is estimated by using Landsat TIR band with the calibration parameters, which can be retrieved from the image head files.
After ecological environment indicators were estimated, pseudo changes due to metrological variation and other noise in this time period are removed by calibrating ecological environment indicators of 2002 and 2013.
3. RESULT AND DISCUSSION
3.1 Ecological Environment Change in Urban Sprawl Areas
From 2002 to 2013, urban area of Beijing increased from 600 km2 to 987 km2. The urban sprawl areas mainly came from rural settlement, industrial land, and cultivated land. Cultivated land was occupied about 154 km2 during this period. All the ecological environment indicators except LST become worse The International Archives of the Photogrammetry, Remote Sensing and Spatial Information Sciences, Volume XLI-B8, 2016
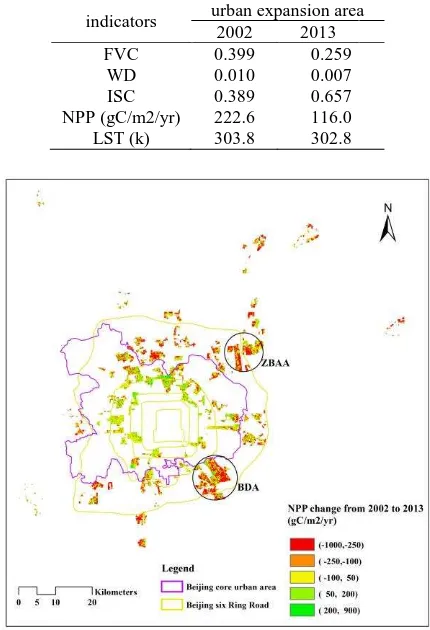
(Table 1). Among of them, NPP decreased most seriously. NPP even decreased more than 250gC/m2/yr in Beijing Economic-Technological Development Area (BDA) and Beijing-Capital International Airport (ZBAA) (Figure 2). From 2002 to 2013, average NPP in urban sprawl areas decreased from 222.6 gC/m2/yr to 116.0 gC/m2/yr, which indicated that there was about 16420 tons of carbon loss in cultivated land occupied and 40508 tons of carbon loss in Beijing urban sprawl area .
Table 1. Ecological environment change in urban sprawl areas
indicators urban expansion area 2002 2013
FVC 0.399 0.259
WD 0.010 0.007
ISC 0.389 0.657
NPP (gC/m2/yr) 222.6 116.0
LST (k) 303.8 302.8
Figure 2. NPP Change map in Beijing urban sprawl areas
3.2 Ecological Environment Change Inside of 6th Ring Road
Spatial distribution of FVC, WD, ISC, NPP, LST inside of Beijing 6th Ring Road of 2002 and 2013 was shown in Figure 3, and the change data of the ecological environment indicators are shown in Table 2.
FVC of 2002 FVC of 2013
Water Surface of 2002 Water Surface of 2013
ISC of 2002 ISC of 2013
NPP of 2002 NPP of 2013
LST of 2002 LST of 2013
Figure 3. Spatial pattern of ecological environment indicators inside of Beijing 6th Ring Road
Inside of 2nd Ring Road, FVC, WD, ISC, NPP, and LST changed towards a better result. In 2nd to 3rd Ring Road and 3rd to 4th Ring Road, FVC, NPP, and LST changed towards a better result. In 4th to 5th Ring Road, FVC and LST changed towards a better result. In 5th to 6th Ring Road, only LST changed towards a better result. FVC changed toward a better result inside of 5th Ring Road. NPP changed toward a better result inside of 3rd The International Archives of the Photogrammetry, Remote Sensing and Spatial Information Sciences, Volume XLI-B8, 2016
Ring Road. ISC changed toward a better result only inside of 2nd Ring Road. WD changed toward a worse result inside of each Ring Road, while LST changed toward a better result inside of each Ring Road. The cause of decrease of LST might be due to the expansion of large area waters near the Shahe Reservoir and the Yongding River, which had an accumulated effect for reducing LST. In conclusion, ecological environment
generally became better inside of 2nd Ring Road, and vegetation became better inside of 4th Ring Road. While ecological environment generally became worse in 4th to 6th Ring Road. This indicated that Beijing old urban areas (inside of 4th Ring Road) had been suffering a sustainable ecological environment construct together with urban sprawl from 2002 to 2013.
Table 2. Ecological environmental change inside of Beijing 6th Ring Road
Ring road
Note: value of ecological environmental indicators with blue color means a worse state.
3.3 Ecological Environment Change at Beiyun River Watershed
ISC at Beiyun River watershed was 0.457 in 2002, and it increased to 0.590 in 2013. According to the former research results, watershed which has an ISC over 0.30 is regarded as a degraded watershed (Arnold and Gibbons, 1996; Schueler, 1994;). So Beiyun River watershed had been facing serious water environment degradation since 2002, and the situation became worse.
4. CONCLUSION
In this study, a method of urban boundary extraction was proposed with a series of manual interpretation rules by using high-resolution aerial photographs. Based on the urban boundary, the impact of urban sprawl on ecological environment from 2002 to 2013 was analysed at urban areas scale, Beijing ring road scale, and watershed scale.
At urban areas scale, most of the ecological environment indicators, including FVC, WD, ISC, and ISC in Beijing urban sprawl areas became worse. Among of them, NPP decreased most seriously. From 2002 to 2013, average NPP decreased from 222.6 gC/m2/yr to 116.0 gC/m2/yr, about 16420 tons of carbon loss in cultivated land occupied and 40508 tons of carbon loss in Beijing urban sprawl areas.
At Beijing ring road scale, all of the ecological environment indicators except WD became better inside of 2nd Ring Road, and vegetation (FVC, NPP) became better inside of 4th Ring Road. While ecological environment indicators including FVC, WD, ISC, and NPP generally became worse in 4th to 6th Ring Road. This indicated that Beijing old urban areas (inside of 4th Ring Road) had been suffering a sustainable ecological environment construct together with urban sprawl from 2002 to 2013.
ISC at Beiyun River watershed increase from 0.457 to 0.590. This indicated that Beiyun River watershed had been facing serious water environment degradation since 2002, and the situation became worse.
ACKNOWLEDGEMENTS
This research is supported by National Natural Science Foundation of China (NO: 41401513) and Key Laboratory for Urban Geomatics of National Administration of Surveying, Mapping and Geoinformation (NO: 20131202WY).
REFERENCES
Arnold Jr, C. L., Gibbons, C. J., 1996. Impervious surface coverage: The emergence of a key environmental indicator. Journal of the American Planning Association, 62(2), pp. 243-258.
Crabtree, R., Potter, C., Mullen R., et al., 2009. A modeling and spatio-temporal analysis framework for monitoring environmental change using NPP as an ecosystem indicator, Remote Sensing of Environment, 113(7), pp. 1486–1496.
Li, M. M., Wu, B. F., Yan, C. Z., et al., 2004. Estimation of vegetation fraction in the upper basin of Miyun reservoir by remote sensing. Resources Science, 26(4), pp. 153-159.
Lu, S. L., Wu, B. F., Yan, N. N., et al., 2011. Water body mapping method with HJ-1A/B satellite imagery. International Journal of Applied Earth Observation and Geoinformation, 13(3), pp. 428-434.
Odum, E. P., Odum, H. T., Andrews, J., 1971. Fundamentals of Ecology, vol. 3, Philadelphia: Saunders.
Potter, C. S., Randerson, J. T., Field C. B.,. et al., 1993. Terrestrial ecosystem production: a process model based on global satellite and surface data, Global Biogeochemical Cycles, 7(4), pp. 811–841.
Schueler, T. R., 1994. The importance of imperviousness. Watershed Protection Techniques, 1(3), pp. 100-111.
Stone, B., Hess, J. J., Frumkin, H., 2010. Urban form and extreme heat events: are sprawling cities more vulnerable to climate change than compact cities. Environmental Health Perspectives, 118(10), pp. 1425-1428.
Tan, M., Li, X., Xie, H., et al., 2005. Urban land expansion and arable land loss in China—a case study of Beijing–Tianjin– Hebei region. Land Use Policy, 22(3), pp. 187-196.
Wang, H., Wu, B. F., Li, X. S., et al., 2011. Extraction of impervious surface in Hai Basin using remote sensing. Yaogan Xuebao- Journal of Remote Sensing, 15(2), pp. 388-400.
Wang, L., Li, C. C., Ying, Q., et al., 2012. China’s urban expansion from 1990 to 2010 determined with satellite remote sensing. Chinese Science Bulletin, 57(22), pp. 2802-2812.
Yin, Z., Y., Walcott, S., Kaplan, B., et al., 2005. An analysis of the relationship between spatial patterns of water quality and urban development in Shanghai, China. Computers, Environment and Urban Systems, 29(2), pp. 197-221.
Yuan, F., Bauer M. E., 2007. Comparison of impervious surface area and normalized difference vegetation index as indicators of surface urban heat island effects in Landsat imagery. Remote Sensing of Environment, 106( 3), pp. 375-386.