Economics of Education Review 19 (2000) 149–158
www.elsevier.com/locate/econedurev
Overeducation in the labor market: a meta-analysis
Wim Groot
a,b,*, Henrie¨tte Maassen van den Brink
a,caResearch Center on Schooling, Labor Market and Economic Development, Department of Economics, University of Amsterdam,
Roetersstraat 11, 1018 WB Amsterdam, The Netherlands
bDepartment of Health Sciences, Maastricht University, P.O.B. 616, 6200 MD Maastricht, The Netherlands cDepartment of Economics and Management, Wageningen University, P.O.B. 8060, 6700 DA Wageningen, The Netherlands
Received 25 July 1996; accepted 10 June 1999
Abstract
This paper contains a meta-analysis of studies on overeducation and undereducation in the labor market. It is found that of the four different definitions of overeducation distinguished in the literature, only the one based on variation in years of education within occupational groups appears to yield significantly lower-than-average rates of overeduc-ation. The average rate of undereducation in the labor market depends on the definition of the undereducation variable. There is no indication that mismatches between education supplied and education required for the job have increased significantly in the past 20 years. The labor force growth rate has a positive effect on the incidence of overeducation, while the unemployment rate has a negative effect on the rate of return to education. 2000 Elsevier Science Ltd. All rights reserved.
JEL classification: J24; J31; J41
Keywords: Overeducation; Meta-analysis
1. Introduction
One of the most remarkable social developments of past decades in all Western countries has been the increase in the educational level of the population. This increase is best illustrated by comparing the educational attainment of different age groups. Of the population of OECD countries aged 55–64 years in 1992, about 38% had attained at least upper secondary education. Of the population aged 25–34 years, 65% had at least completed upper secondary education: an increase in the share of
* Tel.:+31-20-525-6965/4311 and+31 43 388 1588/1727; fax:+31 20 525 4310 and+31 43 388 0960.
E-mail addresses: [email protected]; wim.groot@beoz. unimaas.nl (W. Groot), [email protected]; henriette. [email protected] (H. Maassen van den Brink)
0272-7757/00/$ - see front matter2000 Elsevier Science Ltd. All rights reserved. PII: S 0 2 7 2 - 7 7 5 7 ( 9 9 ) 0 0 0 5 7 - 6
the population with at least higher secondary education of more than 70% in less than 30 years (OECD, 1995b). The increase in the education level of the work force has been accompanied by higher-than-average growth rates for jobs for higher-educated workers. Also, for a number of jobs there has been an upgrade in the skills needed to perform adequately. Despite this increase, it can be argued whether the increase in the demand for higher-educated labor has kept pace with the increase in the supply of skilled workers. If the growth in the supply of higher-educated workers outpaces the growth in demand, overeducation of the work force is the likely result. Workers are overeducated if the skills they bring to their jobs exceed the skills required for that job. With overeducation the allocation of skills over jobs may be less than optimal.
150 W. Groot, H. Maassen van den Brink / Economics of Education Review 19 (2000) 149–158
1996) and Sicherman (1991) find that overeducated workers have less experience, tenure and on-the-job training than correctly allocated workers. Groot and Maassen van den Brink (1996) find that workers who have experienced a career interruption — such as women with children — are more likely to be in jobs for which they are overeducated. Another explanation is that overe-ducation is part of a career mobility or insertion process in the labor market. Workers may enter the labor market in jobs for which they are overeducated and later on move to jobs that more match their educational attain-ment. Groot (1996) and Groot and Maassen van den Brink (1996) find that — after controlling for experi-ence — younger workers are more likely to be overedu-cated than older workers. Further, in Sicherman (1991) it is found that overeducated workers change jobs more frequently. This also suggests that overeducation is part of a phase of adaptation in the early stages of working life.
In the past two decades a number of studies have appeared on the incidence of qualification mismatches in the labor market and on the pay-off for formal edu-cational qualifications that are not fully required for the job. The main aim of this paper is to review what 20 years of research on the incidence and returns to overed-ucation has taught us. For this purpose a meta-analysis of the available studies on overeducation is presented.
A quick overview of the literature on overeducation shows that there is no uniform definition of overeduc-ation. At least four different definitions can be dis-tinguished in the literature. In Section 2 the different ways in which the ‘overeducation’ concept is oper-ationalized are described briefly (for a more detailed dis-cussion, see Hartog, 2000). There it is also argued that none of the four definitions is universally preferred over the other and that each of the different definitions has its advantages and drawbacks.
Perhaps more relevant than a discussion on how to define overeducation, is the question whether the way the concept is defined really matters: do some of the overeducation concepts lead to other conclusions about the incidence of, and the returns to overeducation than others? This question is addressed in Section 3 where the results of the meta-analysis are presented. One of the purposes of the meta-analysis is to establish how the rate of skill mismatches and the returns to overeducation vary with characteristics of the sample used, the operationaliz-ation of variables and institutional characteristics.1 The
meta-analysis not only provides an answer to the
ques-1 One of the criticisms of meta-analysis is that, contrary to
to traditional literature reviews, meta-analysis does not discuss the studies being reviewed, looking for patterns and inconsist-encies, and placing more weight on better-quality studies than on poorer studies (see Wolf, 1986).
tion whether the definition of overeducation affects out-comes but also on questions such as:
1. Has the incidence of educational mismatches increased over time? And has the allocation on the labor market become less efficient?
2. Have the returns to overeducation and undereducation changed over time?
3. Are there gender differences in overeducation? 4. Are there differences in the incidence and pay-off to
overeducation between European countries and the United States?
5. Do aggregate variables such as the unemployment rate or the labor force growth rate have an effect on overeducation?
2. The definition of educational mismatches and description of the studies used in the meta-analysis
Broadly speaking, four ways of defining skill mis-matches can be distinguished in the literature. These four can be classified into ‘objective’ and ‘subjective’ defi-nitions. The subjective definitions are based on self-reports by individual workers on the rate of skill utiliz-ation. Either workers are asked directly whether they are overeducated or undereducated for the work they do, or workers are asked what the minimum educational requirements are for (a new worker in) the job. In the latter case, the self-report on the required education level is compared with the actual education level of the worker to determine whether the worker is overeducated or not. The ‘objective’ definitions can be classified in two types as well. In the first, overeducation is defined by compar-ing years of education attained with the average edu-cation level within the occupation of the worker. This classifies a worker as being overeducated if he/she has more years of education than the average years of edu-cation within the workers’ occupation plus one standard deviation. The second ‘objective’ definition is based on a comparison between the actual education level and job-level requirements. All of the definitions have their draw-backs and limitations; for a discussion on these, see Clogg and Shockey (1984), Dolton and Vignoles (2000), Halaby (1994) and Hartog (2000).
Table 1 summarizes 25 studies on overeducation.2The
table provides information on the year of data collection, the definition of the overeducation variable, the specifi-cation of the wage equation for measuring the returns to overeducation, the incidence of skill mismatches
2 Some authors use the same results in different papers. In
151
W.
Groot,
H.
Maassen
van
den
Brink
/
Economics
of
Education
Review
19
(2000)
149–158
Table 1
Survey of research on overeducation in the labor market
Study Year Definitionaand Incidence of Incidence of Rate of return Rate of return Rate of return Rate of return specificationb overeducation undereducation to years of to years of to to
(male/female) (male/female) education education overeducation undereducation (%) (%) attained required (male/female) (male/female)
(male/female) (male/female) (%) (%)
(%) (%)
Alba-Ramirez (1993) 1985 D I 15.3/20.6 28.0/13.8 9.2 4.0 26.0
Beneito, Rerri, Molto´ & Uriel (1996) 1990 B 15.2 15.3
C I 27.9 10.9 3.3 1.9 23.3
D 25.6 16.5
Cohn & Kahn (1995) 1985 B I 13 12 8.4 5.9 24.4
D I 33 20 7.7 4.9 23.8
Daly, Bu¨chel & Duncan (2000) 1976 D I 38.5/36.8 16.3/11.3 6.1/9.0 4.5/6.1 23.4/23.6
1985 D I 31.8/33.5 21.2/16.8 7.8/10.9 5.4/8.6 21.6/22.5
1984 D I 14.3/20.7 6.9/7.4 9.0/9.0 4.9/6.6 27.8/23.8
Dolton & Vignoles (2000) 1986 D I 29/31
Duncan & Hoffman (1981) 1976 D I 42 12 3 24.2
Groeneveld (1996) 1994 A 30.7
D 19.3
C 13.4
Groot (1993) 1983 B III 16.0 21.8 5.5 27.4 2.6
Groot (1996) 1991 B I 13/10 10/8 4.5/5.6 7.9/9.4 22.6/23.0 12.2/10.9
Groot & Maassen van den Brink (1997) 1991 B I 13/10 10/8 4.5/5.6 7.9/9.4 22.6/23.0 12.2/10.9 Groot & Maassen van den Brink (1996) 1995 C 19.3/33.4 14.6/8.1
Halaby (1994) 1973/1977A 19
B 17
C 30
Hartog (1985) 1977 A I 25.7 20.6
Hartog & Oosterbeek (1988) 1982 D I 21.8 16.0 6.5/4.7 7.6/5.2 6.5/3.7 21.9/24.0
Hartog & Tsang (1989) 1969 D I 9.5 6.2 23.9
1973 D I 7.8 4.4 22.1
1977 D I 8.9 5.1 21.3
McGoldrick & Robst (1996) 1985 B 15.8/9.3
D 30.1/31.5
Oosterbeek & Webbink (1996) 1995 B I 6.8/6.2 9.2/7.9 5.2/6.3 23.3/21.1
152
W.
Groot,
H.
Maassen
van
den
Brink
/
Economics
of
Education
Review
19
(2000)
149–158
Table 1 (continued)
Study Year Definitionaand Incidence of Incidence of Rate of return Rate of return Rate of return Rate of return specificationb overeducation undereducation to years of to years of to to
(male/female) (male/female) education education overeducation undereducation (%) (%) attained required (male/female) (male/female)
(male/female) (male/female) (%) (%)
(%) (%)
Robst (1995) 1976, D 36 20
1978, 1985
Rumberger (1981) 1977 A I 11–17 6.1/11.5 2.8/6.1
D I 16 5.2/10.0 3.1/5.7
Santos (1992) 1985 B I 15.4/20.0 6.4/3.7 3.5/3.4 1.5/0.9 21.9/0.7
Santos, Mendes Oliveira & Kiker (1996) 1991 A I 28.8/40.0 44.2/25.9 10.0/10.4 3.4/3.0 23.9/26.6
B II 10.9/6.9 5.3/4.7 6.4/5.6 29.5/23.6 16.5/15.6
Sicherman (1991) 1976/1978D I 40.8 16.0 3.8 4.8 3.9 21.7
Sloane, Battu & Seaman (1995) 1986 D I 30.1/32.3 19.2/12.1 3.3/2.5 24.8/0.5
Smoorenburg & Van der Velden (2000) 1994 D I 39 2 6.6 4.8 27.1
Verdugo & Verdugo (1989) 1980 B II 10.9 9.9 7.2 213.0 9.6
a Definition of over/undereducation: A based on job level or DOT classification; B based on average years of education within occupation; C self-report on skill utilization; D based on self-report on skill requirements (for new workers) on the job.
153
W. Groot, H. Maassen van den Brink / Economics of Education Review 19 (2000) 149–158
reported in the study, and the estimated rates of return to education attained, education required for the job, overeducation and undereducation. We have dis-tinguished four different ways of operationalizing overe-ducation: definition A — based on job level or DOT classification; definition B — based on average years of education within occupation; definition C — self-report on skill utilization; definition D — based on self-report on skill requirements (for new workers) on the job.
Table 1 shows that there is considerable variation in the incidence of skill mismatches and the rates of return to the different educational component among the stud-ies. The incidence of overeducation varies from 10% to 42%, while it seems that the estimated rate of return to a year of overeducation can either be positive or negative depending on the study used. Similar conclusions can be drawn for the incidence of, and the returns to undereduc-ation.
3. The results of the meta-analysis
From the 25 studies in Table 1 we can obtain 50 mates on the incidence of overeducation and 36 esti-mates for the incidence of undereducation. The unweighted average of the incidence of overeducation is 23.3% (with a standard deviation of 9.9 percentage points), while the unweighted average incidence of unde-reducation is 14.4% (standard deviation is 8.2 percentage points). The unweighted averages of the rates of return to the different educational components are: 5.6% for years of education attained, 7.8% for years of education required for the job, 3.0% for years of overeducation and 21.5% for years of undereducation.
Table 2 shows that that the different definitions lead to large differences in the incidence of overeducation. Studies using the variation of years of education within occupations (definition B) yield the lowest estimate of overeducation, while studies based on self-reports on the educational requirements of the job for new workers (definition D) yield the highest estimate. The rate of overeducation varies from 13.1% among studies using definition B to 28.6% in studies based on definition D.
There appears to be less overeducation in European countries than in the United States. The average value of overeducation among studies for the United States is 26.3%, while among European studies this is 21.5%. The same holds for the incidence of undereducation.
The incidence of overeducation appears to have declined rather than increased over the past 20 years. Studies using data for the 1970s on average find that 28.7% of the workers are overeducated. Among studies using data for the 1990s the average incidence of overed-ucation is 21%. With the decline in the incidence of overeducation over time, the average rate of return to a year of overeducation has declined as well. In studies for
the 1970s the pay-off to a year of overeducation was 4.6% on average. Studies for the 1990s find a rate of return of 1.4%. Both findings combined suggest that over time overeducation has become increasingly concen-trated among lower-ability workers for whom the pay-off to a year of overeducation is low. The decline in the average incidence of overeducation may be dominated by the findings for the United States, where the labor market for higher-educated workers has tightened during the 1980s (see also Hartog, 2000).
The incidence of undereducation appears to have declined from 16% in the 1970s to 13% in studies for the 1990s. The joint decline in overeducation and unde-reducation suggests that skill mismatches in the labor market have decreased since the 1970s.
Overeduction is more frequent among female workers than among male workers, while the opposite holds for undereducation. Among studies using data for male workers, 21% are overeducated and 16.5% are underedu-cated. If data for female workers are used, the incidence of overeducation is 24% while 10.9% are undereducated. Both conceptual arguments and empirical evidence can decide the validity of the different definitions of overeducation used in the literature. Hartog (2000) has focused on the limitations of the definitions. Here we concentrate on the question whether the way skill mis-matches are defined affects the incidence of overeduc-ation reported. For this purpose the informovereduc-ation in Table 1 is used as input for a meta-analysis on the incidence of overeducation and undereducation. One question we address here is how much overeducation remains after controlling for variation between studies due to sample composition, year of data sampling, inter-country vari-ation, etc. The same holds for the rate of return to edu-cation after controlling for study-specific variation in the meta-analysis. The incidence of skill mismatches and the rate of return to education after controlling for the vari-ation across studies are referred to as the ‘true’ rate of skill mismatch and the ‘true’ rate of return, respectively. To obtain the ‘true’ incidence of overeducation and undereducation, and the ‘true’ rates of return to years of education required, years of overeducation and years of undereducation, five ordinary least-squares (OLS) equa-tions were estimated.
154
W.
Groot,
H.
Maassen
van
den
Brink
/
Economics
of
Education
Review
19
(2000)
149–158
Table 2
Average values by characteristics of the survey and characteristics of the sample used in the study (standard errors in brackets)
Incidence of Incidence of Rate of return Rate of return Rate of return Rate of return overeducation (%) undereducation (%) education attained education required overeducation (%) undereducation (%)
(%) (%)
All studies 23.3 (9.9) 14.4 (8.2) 5.6 (1.0) 7.8 (2.2) 3.0 (4.7) 21.5 (5.8)
Country
United States 26.3 (11.1) 15.6 (4.1) 5.5 (2.4) 8.1 (2.0) 3.9 (4.8) 21.9 (3.8)
Europe 21.5 (8.8) 13.9 (9.4) 5.6 (0.8) 7.6 (2.4) 2.1 (4.6) 21.2 (7.0)
Year
1970s 28.7 (10.8) 16.0 (3.9) 3.8 (0) 7.9 (2.3) 4.6 (1.3) 22.9 (1.2)
1980s 22.4 (8.2) 14.9 (7.0) 5.9 (1.1) 7.4 (2.4) 2.6 (5.7) 22.1 (4.3)
1990s 21.0 (10.7) 13.3 (10.8) 5.7 (0.8) 8.2 (2.1) 1.4 (5.4) 0.85 (9.6)
Definition of educationa
A 26.4 (9.2) 30.2 (12.4) 9.5 (2.4) 3.8 (1.5) 25.3 (1.9)
B 13.1 (3.5) 9.6 (5.1) 5.8 (0.9) 7.4 (2.4) 21.5 (7.2) 4.2 (8.5)
C 24.8 (8.2) 11.2 (3.3) 3.3 (0) 1.9 (0) 23.3 (0)
D 28.6 (8.6) 15.5 (6.3) 5.0 (1.4) 7.9 (1.8) 4.9 (1.5) 23.5 (2.1)
Gender
Male 21.0 (8.5) 16.5 (11.0) 5.7 (1.1) 7.3 (1.9) 2.8 (4.3) 21.3 (7.0)
Female 24.0 (11.5) 10.9 (6.3) 5.5 (0.5) 8.7 (2.4) 4.2 (3.4) 20.7 (6.9)
Combined sample 24.8 (10.1) 15.4 (6.0) 5.5 (1.7) 7.4 (2.1) 2.0 (5.9) 22.1 (4.4)
Specification of the wage equation
With actual education 11.2 (3.7) 104 (7.9) 6.2 (0.8) 28.4 (3.9) 11.1 (6.4)
With required education 24.4 (9.6) 14.9 (8.2) 5.4 (1.0) 7.8 (2.2) 4.5 (1.7) 23.5 (2.0)
155
W. Groot, H. Maassen van den Brink / Economics of Education Review 19 (2000) 149–158
(for new workers) on the job]. The reference category consists of studies that use a definition based on job-level or occupational classification such as the Dictionary of Occupational Titles (DOT). To see whether skill mis-matches differ between European countries and the United States, a dummy variable was included for studies that use data on a European country. We have counted each observation on the incidence of skill mismatches. This implies that studies that calculate the incidence of overeducation for men and women separately are coun-ted twice in the sample. To correct for this two dummies for gender are included. The results of the OLS estimates are in Table 3.
The estimates in Table 3 show that only the definition of overeducation based on within-occupation variation in
Table 3
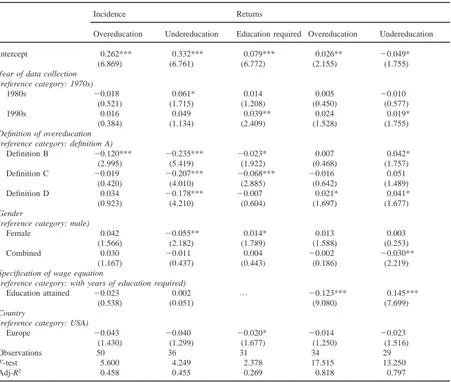
OLS parameter estimates incidence of, and returns to over- and undereducation (t-values in brackets)a
Incidence Returns
Overeducation Undereducation Education required Overeducation Undereducation
Intercept 0.262*** 0.332*** 0.079*** 0.026** 20.049*
(6.869) (6.761) (6.772) (2.155) (1.755)
Year of data collection (reference category: 1970s)
1980s 20.018 0.061* 0.014 0.005 20.010
(0.521) (1.715) (1.208) (0.450) (0.577)
1990s 0.016 0.049 0.039** 0.024 0.019*
(0.384) (1.134) (2.409) (1.528) (1.755)
Definition of overeducation (reference category: definition A)
Definition B 20.120*** 20.235*** 20.023* 0.007 0.042*
(2.995) (5.419) (1.922) (0.468) (1.757)
Definition C 20.019 20.207*** 20.068*** 20.016 0.051
(0.420) (4.010) (2.885) (0.642) (1.489)
Definition D 0.034 20.178*** 20.007 0.021* 0.041*
(0.923) (4.210) (0.604) (1.697) (1.677)
Gender
(reference category: male)
Female 0.042 20.055** 0.014* 0.013 0.003
(1.566) (2.182) (1.789) (1.588) (0.253)
Combined 0.030 20.011 0.004 20.002 20.030**
(1.167) (0.437) (0.443) (0.186) (2.219)
Specification of wage equation
(reference category: with years of education required)
Education attained 20.023 0.002 % 20.123*** 0.145***
(0.538) (0.051) (9.080) (7.699)
Country
(reference category: USA)
Europe 20.043 20.040 20.020* 20.014 20.023
(1.430) (1.299) (1.677) (1.250) (1.516)
Observations 50 36 31 34 29
F-test 5.600 4.249 2.378 17.515 13.250
Adj-R2 0.458 0.455 0.269 0.818 0.797
a
%— omitted from the equation due to singularity of the data; * — significant at 10% level; ** — significant at 5% level; *** — significant at 1% level.
years of education lead to a significantly lower measure of overeducation. Using definition B lowers the inci-dence of overeducation by 12 percentage points. Ignor-ing all insignificant variables the ‘true’ rate of overeduc-ation is 26.2%. If definition B is used, the rate of overeducation is 14%.
The meta-analysis further shows that the definition of undereducation is more sensitive to the method of oper-ationalization. Ignoring all other variation, the incidence of undereducation is 33.2% if definition A used, about 10% if definition B is used, 12% with definition C and 17% with definition D.
156 W. Groot, H. Maassen van den Brink / Economics of Education Review 19 (2000) 149–158
in the incidence of undereducation is 5.5 percentage points. There are neither significant gender differences in the incidence of overeducation, nor in the rate of return to different educational components.
The year of data collection has an effect on the rate of return to years of education required only. The point estimates of the coefficients indicate that the rate of return to a year of education required for the job was about 7.9% in the 1970s and 1980s and increased to almost 12% in the 1990s.
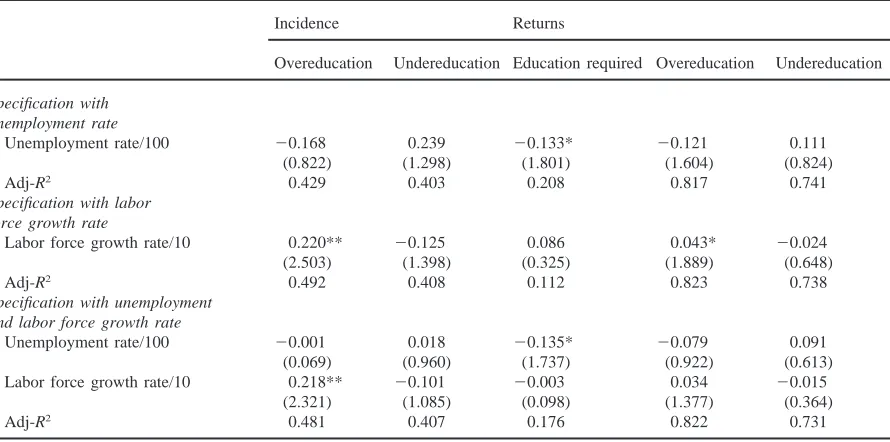
Few of the other variables included in the equations for the rates of return to different education components are significantly different from zero. It appears therefore that there is little systematic variation between the esti-mated rates of return in the various studies in Table 3. The coefficients suggest that the ‘true’ rate of return to a year of overeducation is about 2.6%, while the rate of return to a year of undereducation is24.9%. The latter coefficient is significantly different from zero at the 10% level only. An advantage of meta studies is that it enables us to include information on aggregate data in the analy-sis that cannot be included in the individual studies. In particular, it can be tested whether the incidence of, and returns to overeducation are determined by changes in the (aggregate) supply and demand for labor. If unem-ployment is high or the labor force is growing rapidly, workers may have to do with a job for which they are overeducated more frequently than in periods in which unemployment and the labor force growth rate are low. High unemployment and high labor force growth rate may further lower the rate of return to (over)education. To test these hypotheses we add data on the unemploy-ment rate and the labor force growth rate to the equa-tions. The data on unemployment and labor force growth refer to the period and the country in which the data for the original study are collected and are taken from vari-ous issues of the OECD Employment Outlook (OECD, 1995a).
The coefficients of the unemployment rate and labor force growth rate variables in the equations are reported in Table 4. For brevity the coefficients of the other con-trol variables are not reported in the table. To test the robustness of the findings three different specifications of each of the five are estimated: one with the unemploy-ment rate, one with the labor force growth rate, and one with both variables included.
The results indicate that an increase in the labor force growth rate increases the incidence of overeducation. A one percentage point increase in the labor force growth rate increases the incidence of overeducation by about two percentage points. The results further show that the rate of return to education is negatively affected by the unemployment rate. A one percentage point increase in the unemployment rate decreases the rate of return to a year of education required by about 0.13 percentage points. This finding is parallel to the results from studies
on the wage curve which show that the unemployment elasticity of wages is about 20.1 (see Blanchflower & Oswald, 1990; Groot, Mekkelholt & Oosterbeek, 1992). Combining these findings it seems that both the rate of return to education and the wage rate are negatively related to the unemployment rate.
4. Conclusion
A meta-analysis of studies on the incidence and returns to overeducation has been presented. The main conclusion that can be drawn from this meta-analysis is that of the four different definitions of overeducation dis-tinguished in the literature, only the one based on within-occupation variation in years of education appears to yield significantly lower estimates of overeducation than studies that use another definition. Ignoring the down-ward bias of the latter definition, the ‘true’ or overall incidence of overeducation in the labor market appears to be about 26%. It further seems that the rate of overed-ucation has not changed significantly over the past dec-ades. The average rate of undereducation is lower among female workers than among male workers. The gender differential in undereducation is about 5.5 percentage points. The estimate of the incidence of undereducation is more dependent on the definition used than the esti-mate of the rate of overeducation. The ‘true’ rate of return to a year of education required was 7.9% in the 1970s and 1980s. In the 1990s the rate of return to edu-cation required increased to about 12%. There is little systematic variation in the rate of return to overeducation and undereducation. The intercept terms in the equations suggest that the ‘true’ rate of return to a year of overed-ucation is 2.6%, while the rate of return to a year of undereducation is24.9%.
A major advantage of meta-analysis is that it allows the researcher to include sources of (aggregate) data that cannot be included in cross-sectional studies based on individual data. In this study information on the unem-ployment rate and labor force growth rate are added to the estimations. It is found that labor force growth rate has a positive effect on the incidence of overeducation, while the unemployment rate has a negative effect on the rate of return to education. So it seems that cyclical fluctuations through the unemployment rate affect the pay-off to education, while structural changes such as the changes in the labor force growth rate affect the inci-dence of skill mismatches.
work-157
W. Groot, H. Maassen van den Brink / Economics of Education Review 19 (2000) 149–158
Table 4
OLS parameter estimates of unemployment and labor force growth variables in equations for incidence of, and returns to over- and undereducation (t-values in brackets) (for a list of other control variables in the equations, see Table 3)a
Incidence Returns
Overeducation Undereducation Education required Overeducation Undereducation Specification with
unemployment rate
Unemployment rate/100 20.168 0.239 20.133* 20.121 0.111
(0.822) (1.298) (1.801) (1.604) (0.824)
Adj-R2 0.429 0.403 0.208 0.817 0.741
Specification with labor force growth rate
Labor force growth rate/10 0.220** 20.125 0.086 0.043* 20.024
(2.503) (1.398) (0.325) (1.889) (0.648)
Adj-R2 0.492 0.408 0.112 0.823 0.738
Specification with unemployment and labor force growth rate
Unemployment rate/100 20.001 0.018 20.135* 20.079 0.091
(0.069) (0.960) (1.737) (0.922) (0.613)
Labor force growth rate/10 0.218** 20.101 20.003 0.034 20.015
(2.321) (1.085) (0.098) (1.377) (0.364)
Adj-R2 0.481 0.407 0.176 0.822 0.731
a * — Significant at 10% level; ** — significant at 5% level; *** — significant at 1% level.
ers with different levels of education may have similar skill endowments if the lack of formal education (undereducation) is compensated by skills obtained through training or experience. Conversely, overeduc-ation may be a compensovereduc-ation for lack of other relevant productive skills necessary for the job.
Acknowledgements
This paper is part of a ‘NWO Prioriteitprogramma’ on Schooling, Labor Market and Economic Development and a TSER project on Schooling, Training and Tran-sitions. We like to thank two anonymous referees and the Editor of this Journal for helpful comments on pre-vious drafts of this paper.
References
Alba-Ramirez, A. (1993). Mismatch in the Spanish labor mar-ket. Journal of Human Resources, 28, 259–278.
Beneito, P., Rerri, J., Molto´, M., & Uriel, B. (1996). Over/undereducation and on-the-job training in Spain: effect on pay returns. Paper presented at the 8th Conference of the European Association of Labour Economists, Chania, Crete. Blanchflower, D., & Oswald, A. (1990). The wage curve. The
Scandinavian Journal of Economics, 92, 215–235. Clogg, C., & Shockey, J. (1984). Mismatch between occupation
and schooling: a prevalence measure, recent trends and demographic analysis. Demography, 21, 235–257.
Cohn, E., & Khan, S. (1995). The wage effects of overschooling revisited. Labour Economics, 2, 67–76.
Daly, M., Bu¨chel, F., & Duncan, G. (2000). Premiums and pen-alties for over- and undereducation: cross-time and crossn-ational comparisons in the United States and Germany. Eco-nomics of Education Review, 19 (2), 169–178.
Dolton, P., & Vignoles, A. (2000). The incidence and effects of overeducation in the U.K. graduate labour market. Eco-nomics of Education Review, 19 (2), 179–198.
Duncan, G., & Hoffman, S. (1981). The incidence and wage effects of overeducation. Economics of Education Review, 1, 75–86.
Groeneveld, S. (1996). Het meten van overscholing. Econom-isch StatistEconom-ische Berichten, 4061, 511.
Groot, W. (1993). Overeducation and the returns to enterprise-related schooling. Economics of Education Review, 12, 299–309.
Groot, W. (1996). The incidence of, and returns to over-education in the UK. Applied Economics, 28, 1345–1350. Groot, W., Maassen van den Brink, H., 1996. Overscholing en
verdringing op de arbeidsmarkt. Economisch Statistische Berichten 4042, 74–77.
Groot, W., & Maassen van den Brink, H. (1997). Allocation and the returns to overeducation in the United Kingdom. Education Economics, 5, 169–183.
Groot, W., Mekkelholt, E., & Oosterbeek, H. (1992). Further evidence on the wage curve. Economics Letters, 38, 355– 359.
Halaby, C. (1994). Overeducation and skill mismatch. Soci-ology of Education, 67, 47–59.
Hartog, J. (1985). Overscholing? Economisch-Statistische Berichten, 70, 152–156.
158 W. Groot, H. Maassen van den Brink / Economics of Education Review 19 (2000) 149–158
and where we should go. Economics of Education Review, 19 (2), 131–147.
Hartog, J., & Oosterbeek, H. (1988). Education, allocation and earnings in the Netherlands: overschooling. Economics of Education Review, 7, 185–194.
Hartog, J., & Tsang, M. (1989). Education, job level and earn-ings in the US, 1969–1973–1977. Amsterdam: Department of Economics, University of Amsterdam.
McGoldrick, K., & Robst, J. (1996). Gender differences in overeducation: a test of the theory of differential overqual-ification. American Economic Review, 86, 280–284. OECD, 1995a. Employment Outlook 1995. Paris: Organisation
for Economic Co-operation and Development (OECD). OECD, 1995b. Education at a Glance. Paris: CERI,
Organis-ation for Economic Co-operation and Development (OECD).
Oosterbeek, H., & Webbink, D. (1996). Over scholing, oversch-oling en inkomen. Economisch Statistische Berichten, 4049, 240–241.
Robst, J. (1995). Career mobility, job match, and overeducation. Eastern Economic Journal, 21, 539–550.
Rumberger, R. (1981). The rising incidence of overeducation in the U.S. labour market. Economics of Education Review, 1, 293–314.
Santos, M. (1992). An exploration of different measures for job requirements: over-(under)education in the Portugese labor market. Paper presented at the Conference of the European Association of Labor Economists, Warwick.
Santos, M., Mendes Oliveira, M., & Kiker, B. (1996). Overed-ucation and underedOvered-ucation: evidence for Portugal. Paper presented at the 8th Conference of the European Association of Labour Economists, Chania, Crete.
Sicherman, N. (1991). ‘Overeducation’ in the labour market. Journal of Labour Economics, 9, 101–122.
Sloane, P. J., Battu, H., & Seaman, P. T. (1995). Overeducation, undereducation and the British labour market. Aberdeen: Department of Economics, University of Aberdeen. Smoorenburg, M., & Van der Velden, R. (2000). Overscholing:
gevolgen voor training en beloning van schoolverlaters. Economics of Education Review, in press.
Verdugo, R., & Verdugo, N. (1989). The impact of surplus schooling on earnings: some additional findings. Journal of Human Resources, 24, 629–643.