Lampiran
Tabel Frekuensi
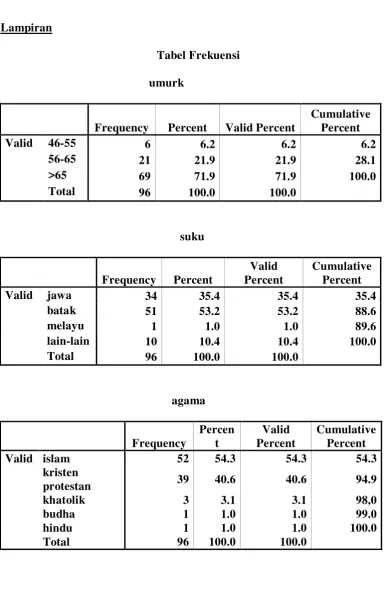
umurk
Frequency Percent Valid Percent
Cumulative Percent
Valid 46-55 6 6.2 6.2 6.2
56-65 21 21.9 21.9 28.1
>65 69 71.9 71.9 100.0
Total 96 100.0 100.0
suku
Frequency Percent
Valid Percent
Cumulative Percent
Valid jawa 34 35.4 35.4 35.4
batak 51 53.2 53.2 88.6
melayu 1 1.0 1.0 89.6
lain-lain 10 10.4 10.4 100.0
Total 96 100.0 100.0
agama
Frequency
Percen t
Valid Percent
Cumulative Percent
Valid islam 52 54.3 54.3 54.3
kristen
protestan 39 40.6 40.6 94.9
khatolik 3 3.1 3.1 98,0
budha 1 1.0 1.0 99.0
hindu 1 1.0 1.0 100.0
kerja
Frequenc
y Percent
Valid Percent
Cumulative Percent
Valid pegawai negeri (PNS) 12 12.5 12.5 12.5
pegawai swasta 1 1.0 1.0 13.5
wiraswasta 50 52.1 52.1 65.6
petani 4 4.2 4.2 69.8
tidak
bekerja/pensiunan 29 30.2 30.2 100.0
Total 96 100.0 100.0
pendidikan
Frequency Percent Valid Percent
Cumulative Percent
Valid sd 5 5.2 5.2 5.2
smp 2 2.1 2.1 7.3
sma 77 80.2 80.2 87.5
akademi/PT 12 12.5 12.5 100.0
Total 96 100.0 100.0
kawin
Frequency Percent Valid Percent
Cumulative Percent
Valid kawin 90 93.8 93.8 93.8
duda 6 6.2 6.2 100.0
Total 96 100.0 100.0
keluhanutama1
Frequency Percent
Valid Percent
Cumulative Percent
Valid Susah BAK 6 6.3 6.3 6.3
Nyeri BAK 32 33.3 33.3 39.6
Kencing
Berdarah 58 60.4 60.4 100.0
p.medis
Frequen
cy Percent
Valid Percent
Cumulativ e Percent Vali
d
operasi 54 56.3 56.3 56.3
kemoterapi 30 31.3 31.3 87.5
operasi dan
kemoterapi 12 12.5 12.5 100.0
Total 96 100.0 100.0
stadium
Frequency Percent Valid Percent
Cumulative Percent
Valid 1 2 2.0 2.0 2.0
2 4 4.2 4.2 6.2
3 6 6.3 6.3 12.5
4 84 87.5 87.5 100.0
Total 96 100.0 100.0
Pengelompokan stadiumk
Frequen
cy Percent
Valid Percent
Cumulativ e Percent Vali
d
awal 6 6.3 6.3 6.3
lanju
t 90 93.8 93.8 100.0
Tota
Lama rawatan
Statistic
Std. Error rawa
t
Mean 7.48 .599
95%
Confidence Interval for Mean
Lower Bound 6.28
Upper Bound
8.67
5% Trimmed Mean 7.03
Median 6.00
Variance 22.608
Std. Deviation 4.755
Minimum 2
Maximum 22
Range 20
Interquartile Range 5
Skewness 1.558 .302
Kurtosis 2.122 .595
biaya
Frequency Percent Valid Percent
Cumulative Percent
Valid bpjs 90 93.8 93.8 93.8
non-bpjs 6 6.2 6.2 100.0
Total 96 100.0 100.0
pulang
Frequency Percent
Valid Percent
Cumulative Percent
Valid pbj 54 85.7 85.7 85.7
paps 3 4.8 4.8 90.5
meninggal 6 9.5 9.5 100.0
Crosstabs
Cases
Valid Missing Total
N Percent N Percent N Percent
stadiumk *
Umurkk 96 100.0% 0 .0% 96 100.0%
stadiumk * Umurkk Crosstabulation
Umurkk Total
<=55 > 55 <=55
stadium k
awal Count 0 6 6
Expected
Count .3 5.7 6.0
% within
stadiumk .0% 100.0% 100.0%
% within
Umurkk .0% 6.6% 6.3%
lanju t
Count 5 85 90
Expected
Count 4.7 85.3 90.0
% within
stadiumk 5.6% 94.4% 100.0%
% within
Umurkk 100.0% 93.4% 93.8%
Total Count 5 91 96
Expected
Count 5.0 91.0 96.0
% within
stadiumk 5.2% 94.8% 100.0%
% within
Chi-Square Tests
Value df
Asymp. Sig.
(2-sided)
Exact Sig. (2-sided)
Exact Sig. (1-sided) Pearson
Chi-Square .352(b) 1 .553
Continuity
Correction(a) .000 1 1.000
Likelihood Ratio .663 1 .415
Fisher's Exact
Test 1.000 .719
Linear-by-Linear
Association .348 1 .555
N of Valid Cases 96
a Computed only for a 2x2 table
b 2 cells (50.0%) have expected count less than 5. The minimum expected count is .31.
Case Processing Summary
Cases
Valid Missing Total
N Percent N Percent N Percent
stadiumk * keluhanutama 1
stadiumk * keluhanutama1 Crosstabulation
keluhanutama1 Total
Susah BAK
Nyeri BAK
Kencing Berdara
h
Susah BAK stadium
k
awal Count
6 0 0 6
Expected Count .4 1.6 4.1 6.0
% within stadiumk 100.0% .0% .0% 100.0%
% within
keluhanutama1 100.0% .0% .0% 6.3%
lanju t
Count
0 25 65 90
Expected Count 5.6 23.4 60.9 90.0
% within stadiumk .0% 27.8% 72.2% 100.0%
% within
keluhanutama1 .0% 100.0% 100.0% 93.8%
Total Count 6 25 65 96
Expected Count 6.0 25.0 65.0 96.0
% within stadiumk 6.3% 26.0% 67.7% 100.0%
% within
keluhanutama1 100.0% 100.0% 100.0% 100.0%
Chi-Square Tests
Value df
Asymp. Sig.
(2-sided) Pearson
Chi-Square
96.000(a
) 2 .000
Likelihood Ratio 44.888 2 .000
Linear-by-Linear
Association 45.625 1 .000
N of Valid Cases 96
Frequencies
stadium
k N
keluhanutam a1
awal 6
lanjut 90
Total 96
Test Statistics(a)
keluhan utama1 Most Extreme
Differences
Absolute 1.000
Positive .000
Negative -1.000
Kolmogorov-Smirnov Z 2.372
Asymp. Sig. (2-tailed) .000
a Grouping Variable: stadiumk
Case Processing Summary
Cases
Valid Missing Total
N Percent N Percent N Percent
stadiumk *
p.medis 96 100.0% 0 .0% 96 100.0%
stadiumk * p.medis Crosstabulation
p.medis Total
operasi
kemotera pi
operasi dan kemoterap
i operasi
stadium k
awal Count 5 1 0 6
Expected
Count 3.4 1.9 .8 6.0
% within
stadiumk 83.3% 16.7% .0% 100.0%
% within
p.medis 9.3% 3.3% .0% 6.3%
lanju t
Count 49 29 12 90
Expected
% within
stadiumk 54.4% 32.2% 13.3% 100.0%
% within
p.medis 90.7% 96.7% 100.0% 93.8%
Total Count 54 30 12 96
Expected
Count 54.0 30.0 12.0 96.0
% within
stadiumk 56.3% 31.3% 12.5% 100.0%
% within
p.medis 100.0% 100.0% 100.0% 100.0%
Chi-Square Tests
Value df
Asymp. Sig.
(2-sided) Pearson
Chi-Square 2.070(a) 2 .355
Likelihood Ratio 2.802 2 .246
Linear-by-Linear
Association 2.000 1 .157
N of Valid Cases
96
a 3 cells (50.0%) have expected count less than 5. The minimum expected count is .75.
Two-Sample Kolmogorov-Smirnov Test
Frequencies
stadium
k N
p.medi s
awal 6
lanjut 90
Test Statistics(a)
p.medis Most Extreme
Differences
Absolute .289
Positive .000
Negative -.289
Kolmogorov-Smirnov Z .685
Asymp. Sig. (2-tailed) .736
a Grouping Variable: stadiumk
Explore
Case Processing Summary
Cases
Valid Missing Total
N Percent N Percent N Percent
rawa
t 63 100.0% 0 .0% 63 100.0%
stadium k
Cases
Valid Missing Total
N Percent N Percent N Percent
rawa t
awal 2 100.0% 0 .0% 2 100.0%
Descriptives
stadium
k Statistic
Std. Error rawa
t
awal Mean 2.50 .500
95%
Confidence Interval for Mean
Lower Bound -3.85
Upper Bound
8.85
5% Trimmed Mean .
Median 2.50
Variance .500
Std. Deviation .707
Minimum 2
Maximum 3
Range 1
Interquartile Range .
Skewness . .
Kurtosis . .
lanjut Mean 7.64 .607
95%
Confidence Interval for Mean
Lower Bound 6.42
Upper Bound
8.85
5% Trimmed Mean 7.21
Median 6.00
Variance 22.501
Std. Deviation 4.744
Minimum 2
Maximum 22
Range 20
Interquartile Range 5
Skewness 1.558 .306
Kurtosis 2.078 .604
Mann-Whitney Test
Ranks
stadium
k N
Mean Rank
Sum of Ranks rawa
t
awal 2 4.75 9.50
lanjut 61 32.89 2006.50
Test Statistics(b)
rawat
Mann-Whitney U 6.500
Wilcoxon W 9.500
Z -2.159
Asymp. Sig.
(2-tailed) .031
Exact Sig.
[2*(1-tailed Sig.)] .016(a)
a Not corrected for ties.
b Grouping Variable: stadiumk
Case Processing Summary
Cases
Valid Missing Total
N Percent N Percent N Percent
stadiumk *
pulang 63 100.0% 0 .0% 63 100.0%
stadiumk * pulang Crosstabulation
pulang Total
pbj paps meninggal pbj
stadiumk awal Count 2 0 0 2
Expected Count 1.7 .1 .2 2.0
% within
stadiumk 100.0% .0% .0% 100.0%
% within pulang 3.7% .0% .0% 3.2%
lanjut Count 52 3 6 61
Expected Count 52.3 2.9 5.8 61.0
% within
stadiumk 85.2% 4.9% 9.9% 100.0%
% within pulang 96.3% 100.0% 100.0% 96.8%
Total Count 54 3 6 63
Expected Count 54.0 3.0 6.0 63.0
% within
stadiumk 85.7% 4.8% 9.5% 100.0%
Chi-Square Tests
Value df
Asymp. Sig.
(2-sided) Pearson
Chi-Square .344(a) 2 .842
Likelihood Ratio .627 2 .731
Linear-by-Linear
Association .310 1 .578
N of Valid Cases 63
a 4 cells (66.7%) have expected count less than 5. The minimum expected count is .10.
Two-Sample Kolmogorov-Smirnov Test
Frequencies
stadium
k N
pulan g
awal 2
lanjut 61
Total 63
Test Statistics(a)
pulang Most Extreme
Differences
Absolute .148
Positive .000
Negative -.148
Kolmogorov-Smirnov Z .205
Asymp. Sig. (2-tailed) 1.000