Spline Nonparametric Regression Analysis of Stress-Strain
Curve of Confined Concrete
Tavio1, I Nyoman Budiantara2, and Benny Kusuma3
Abstract: Due to enormous uncertainties in confinement models associated with the maximum
compressive strength and ductility of concrete confined by rectilinear ties, the implementation of spline nonparametric regression analysis is proposed herein as an alternative approach. The statistical evaluation is carried out based on 128 large-scale column specimens of either normal-or high-strength concrete tested under uniaxial compression. The main advantage of this kind of analysis is that it can be applied when the trend of relation between predictor and response variables are not obvious. The error in the analysis can, therefore, be minimized so that it does not depend on the assumption of a particular shape of the curve. This provides higher flexibility in the application. The results of the statistical analysis indicates that the stress-strain curves of confined concrete obtained from the spline nonparametric regression analysis proves to be in good agreement with the experimental curves available in literatures.
Keywords: confinement model, ductility, spline nonparametric regression analysis, stress-strain curves.
Introduction
The regression analysis has been playing an impor-tant role in the theory of approximation and statistics for many years. It is used to evaluate the effects of the independent to the dependent variables by observing the trend of relation between the two types of variables. The evaluation can be carried out using two approaches, i.e. the parametric approach, which is frequently used in practice, and the nonparametric approach.
The use of piecewise polynomial has been increa-singly popular due to its flexible nature. It is effective in handling a function or a set of data comprising the local natures [1,2]. One of the essential piecewise polynomial is a spline polynomial. The application of the spline nonparametric regression analysis has been widely found in many fields, such as in economics [3] and medicine [4]. However, the imple-mentation of this type of analysis in civil engineer-ing, particularly in reinforced concrete area, is still seldom and not popular.
1 Department of Civil Engineering, Sepuluh Nopember Institute of Technology (ITS), Surabaya, Indonesia
E-mail: [email protected]
2 Department of Statistics, Sepuluh Nopember Institute of Techno-logy (ITS), Surabaya, Indonesia
3 Ph.D Candidate, Department of Civil Engineering, Sepuluh Nopember Institute of Technology, Surabaya (ITS), Indonesia
Note: Discussion is expected before June, 1st 2008, and will be published in the “Civil Engineering Dimension” volume 10, number 2, September 2008.
Received 7 March 2007; revised 14 May 2007; accepted 27 June 2007.
The spline polynomial has many beneficial statistical properties for use in the regression analysis [1,5]. It is a piecewise polynomial which has segmental properties. The segmental properties of the spline polynomial give higher flexibility in the application compared to the ordinary polynomial. This allows the spline polynomial effectively adapting itself with the local characteristics of a function or a set of data.
To date, the regression analysis, which is frequently used by the researchers to obtain the stress-strain curve of confined concrete, is the parametric regres-sion analysis, mostly linear or quadratic. Since it is very simple, the resulting stress-strain curves of confined concrete still have appreciable discrepancies with the experimental curves, particularly in term of ductility along the descending branch. This causes very significant uncertainties in the confinement model of concrete under uniaxial compression.
necessary to propose an alternative analytical model which can be used for predicting the actual stress-strain curve of confined concrete of either normal- or high-strength concrete.
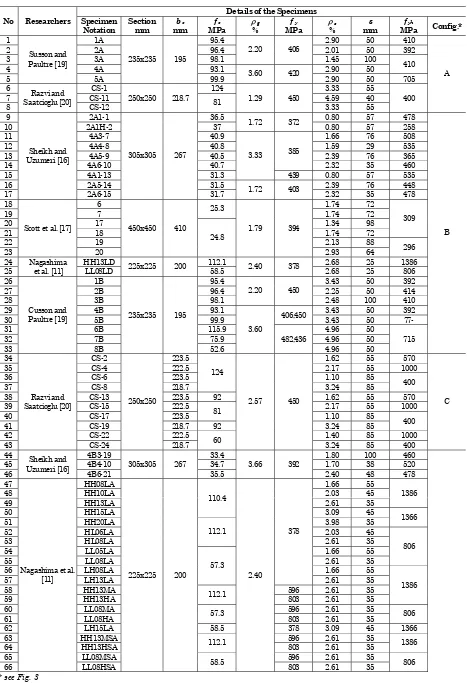
The present investigation focuses only those models developed by the statistical analysis for both normal- and high-strength concrete square columns confined by rectilinear normal and high yield steel ties. All the well-documented analytical models proposed so far are applied to predict the results of experimental tests on large-scale specimens carried out by various researchers [6,7,8]. A database was compiled, including a total of 128 square column specimens from tests involving monotonic axial compression loading. The concrete strength considered ranges from about 25 to 125 MPa, while the yield strength of lateral steel (fyh) ranges from about 250 to 1390
MPa. The volumetric ratio of transverse reinfor-cement (ρs) calculated with respect to the centerline
of the perimeter tie ranges from 0.8 and 5 percent. The test data were evaluated by using the spline nonparametric regression analysis. The proposed statistical model can be applied for both confined normal- and high-strength concrete, as well as for either normal or high yield steel ties.
Nonparametric Regression
The parametric regression analysis uses a particular shape of regression curve. If there is no information on the shape of regression curve f(ti), the use of the
nonparametric regression approach is recommended [2,9]. The approach does not depend on a particular shape of regression curve. It provides higher flexibi-lity compared to the parametric regression approach.
The regression function f(ti) of a nonparametric
regression approach is assumed to be smooth as contained within the Sobolev’s space 2
[ ]
0,1m
W [2,9]. The nonparametric regression model is formulated as follows:
yi = f(ti) + εi; i = 1, 2, …, n; 0 ≤ti≤ 1 (1)
where i is the number of the samples; n is the sample number; yi is the response variable; εi is the
random error; and ti is the predictor variable.
The spline approach has a functional basis. The functional basis normally used is the truncated spline and B-spline [10]. In this paper, the truncated spline approach is selected for the nonparametric regression analysis to evaluate the confinement parameters.
Spline Polynomial
The use of spline polynomial in the regression analysis was first introduced by Whittaker (1923) [1,5], whereas the use of spline in the optimization problems was first developed by Reinch (1967) [1,5]. The truncated spline nonparametric regression analysis is one of the alternatives of nonparametric regression analyses.
The nonparametric regression model can be written in a general form given by Eq. (1). If the truncated spline polynomial is implemented in a nonpara-metric regression analysis, the regression function f
(t) can be rewritten as follows:
( )
∑
−∑
( )
= =
− +
−
+
=
10 1
1
k
i
n
j
k j j i
i
t
t
u
t
f
α
β
(2)where αi and βj are the real constants; i = 0, 1, …, k –
1 and j = 1, 2, …, n; and
( ) ( )
−1 −1+
=
−
−
kj k
j
t
u
u
t
, for t≥uj( )
− −1 =0+
k j
u
t , for t < uj
in which uj is the knotty points; j = 1, 2, ..., n; and the
value of k – 1 indicates the degree of spline polyno-mial. The spline polynomial above has the following natures:
a) f is a (k– 1)-degree piecewise polynomial within the interval of [uj, uj+1];
b)
f
has a (k – 2)-degree continuous derivative; c) ( )k−1f is a piecewise function with knotty points
u1, u2, …, un.
The values of k = 2, 3, and 4 define the spline mials as linear, quadratic, and cubic spline polyno-mials, respectively.
Overview of Confinement Models
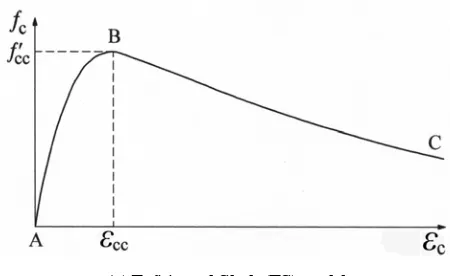
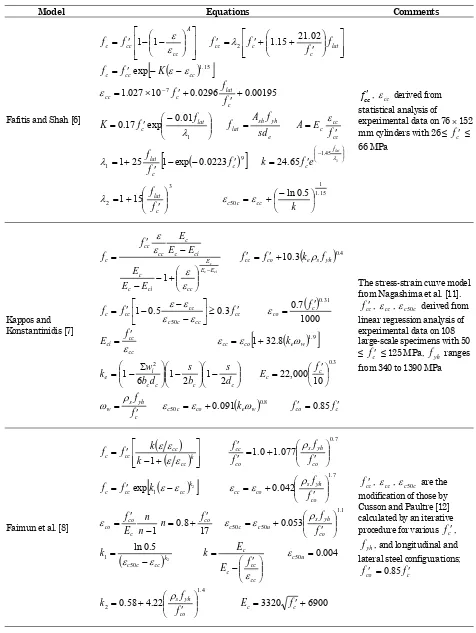
The analytical models proposed by the following researchers are studied: Fafitis and Shah (FS) [6]; Kappos and Konstantinidis (KK) [7]; and Faimun, Aji, Tavio, and Suprobo (FATS) [8]. The stress-strain curves of the reviewed analytical models are illus-trated in Fig. 1, while the constitutive equations of the models are listed in Table 1.
(a) Fafitis and Shah (FS) model
(b) Kappos and Konstantinidis (KK) model
(c) Faimun, Aji, Tavio, and Suprobo (FATS) model
Fig. 1. Analytical stress-strain curves for confined concrete Proposed Empirical Model for Confined Concrete
The ascending branch of the curve is using an equation originally proposed by Popovics [13], by replacing
f
c′
for plain concrete withf
cc′
forcon-fined concrete. This equation provides an ascending branch, which is in close agreement with the test curves. The statistical evaluation summarized in the subsequent discussion shows that in overall the descending branch proposed originally by Cusson and Paultre [12] gives close agreement for all the key parameters. The equations by Faimun et al. [8], as given in Table 1, were then used as the basis for developing a modified model better fitting the empirical stress-strain curves of confined normal- as well as high-strength concrete. Since the modulus of elasticity given by Faimun et al. [8] is only valid for high-strength concrete, the more general modulus of elasticity of concrete (Ec), which is applicable for
either normal- or high-strength concrete, is adopted in the proposed model. The equation was adopted earlier by Kappos and Konstantinidis [7] from Ref. [14], and given as follows:
3 . 0
10 000 ,
22 ⎟
⎠ ⎞ ⎜ ⎝ ⎛ ′
= c
c
f
E (MPa) (3)
The equation that relates between the strength gain of confined concrete
f
cc′
−
f
co′
and the effectivecapacity of transverse reinforcement Keρsfyh is
obtain-ed by the spline nonparametric regression analysis using the experimental data, given as follows:
(
)
2 12 1 1
1 2.52 2.63 0.06 0.05 13.5 +
∧
− +
− +
= x x x
y (4)
in which,
(
) (
)
21 2
1−13.5+ = x −13.5
x , if
x
1≥
13
.
5
(
x1−13.5)
2+ =0, if x1<13.5where y∧1 = fcc′ − fco′ , and x1 = Keρsfyh.
f
c′
is thecompressive strength of standard cylinder, and Ke is
the modified Sheikh and Uzumeri [15] factor for calculating the effectiveness of confinement given by the following formula:
⎟⎟⎠
⎞
⎜⎜⎝
⎛ −
⎟⎟⎠
⎞
⎜⎜⎝
⎛ −
⎟⎟⎠
⎞
⎜⎜⎝
⎛
−
∑
=
c c
c c
i e
d
s
b
s
d
b
w
K
2
1
2
1
6
1
2
(5)
Description on each parameter used in Eq. (5) is shown in Fig. 2.
A spline nonparametric regression analysis was performed using the experimental results to express the relationship between the normalized strain gain at peak stress (εcc/εco) – 1 and the effective capacity of
transverse reinforcement Keωw. The best fit parabolic
Table 1. Summary of models and constitutive equations for stress and strain of rectilinearly confined concrete
Model Equations Comments
Fafitis and Shah [6]
⎥ statistical analysis of
experimental data on 76 × 152 mm cylinders with 26 ≤ fc′ ≤
66 MPa
Kappos and Konstantinidis [7]
ci
The stress-strain curve model from Nagashima et al. [11].
cc
f′, εcc, εc50c derived from linear regression analysis of experimental data on 108 large-scale specimens with 50 ≤ fc′ ≤ 125 MPa, fyh ranges
modification of those by Cusson and Paultre [12] calculated by an iterative procedure for various fc′,
yh
f , and longitudinal and lateral steel configurations;
c
co f
Fig. 2. Parameters used in the proposed model
(
)
22 2
2 2
2 0.94 12.1 164.68 142.28 0.07 + ∧
− −
+ −
= x x x
y (6)
in which,
(
x2 −0.07) (
2+ = x2−0.07)
2, if x2 ≥0.07(
x
2−
0
.
07
)
2+=
0
, if x2 <0.07where
y
∧2=
(
ε
ccε
co)
−
1
, and x2 = Keωw.ε
cois thestrain at the maximum stress of unconfined con-crete, as given in Ref. [14]:
( )
1000 70 .0 c 0.31 co
f′
=
ε
(7)where
c yh s w
f
f
′
=
ρ
ω
is the mechanical ratio oftrans-verse reinforcement.
The slope of the descending branch, which is the key parameter influencing the ductility, is determined by the strain when the maximum stress of confined concrete drops to 50 percent. The relationship between the ductility gain (εc50c – εco) and the effective
capacity of transverse reinforcement Keωw is given by
Eq. (8).
(
)
23 2
3 3
3 0.005 0.26 0.66 0.71 0.16 + ∧
− +
− +
−
= x x x
y (8)
in which,
(
x
3−
0
.
16
) (
2+=
x
3−
0
.
16
)
2, if x3≥0.16(
x3−0.16)
2+ =0, if x3<0.16where
y
∧3=
ε
c50c−
ε
co, andx
3=
K
eω
w.Evaluation Of Confinement Models
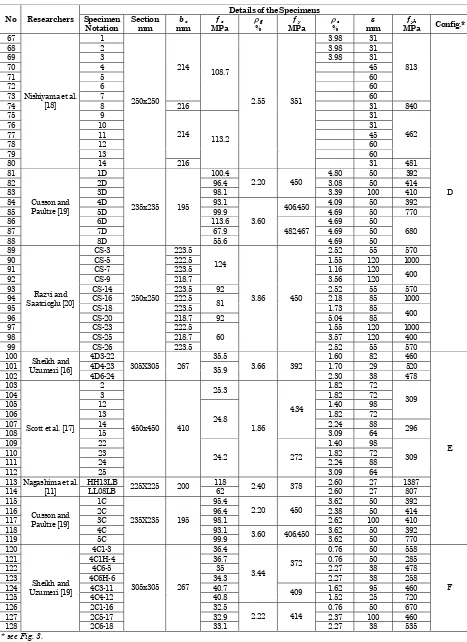
The reviewed stress-strain models for confined normal- and high-strength concrete were applied to predict the results of experimental tests on large-scale specimens carried out and reported by Sheikh and Uzumeri (SU) [16]; Scott, Park, and Priestley (SPP) [17]; Nagashima, Sugano, Kimura, and Ichi-kawa (NSKI) [11]; Nishiyama, Fukushima, Wata-nabe, and Muguruma (NFWM) [18]; Cusson and Paultre (CP) [19]; and Razvi and Saatcioglu (RS) [20,21]. The experimental values of the concrete cylinder strength (
f
c′
) reported in 100 × 200 mm size specimens were adjusted to the corresponding toa standard 150 × 300 mm cylinder by applying a conversion factor of 0.95 to account for the specimen size effect [16].
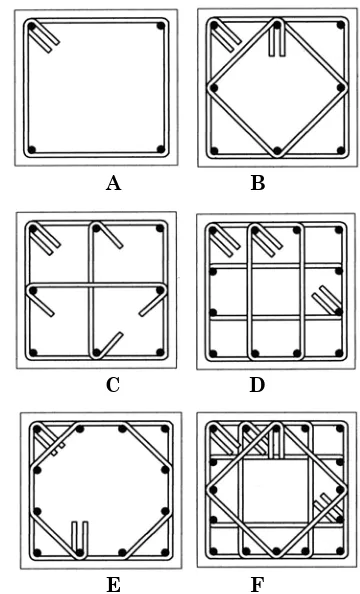
Table 2 presents the summary of the specimens considered and Fig. 3 gives the tie configurations in these specimens.
A B
C D
E F
Fig. 3. Tie configuration of specimens
The reliability evaluation of the analytical models was based on the computation of the statistics of three key parameters. These are (see Fig. 1): i) the maximum confined concrete strength,
f
cc′
; ii) the confined concrete strain at the maximum strength,εcc; and iii) the confined concrete strain when the
stress drops to 50 percent of the maximum confined concrete strength, εc50c. The strain at 0.5
f
cc′
isusually close to the point of failure due to hoop fracture and/or shear failure of the confined core [7].
Table 3 illustrates the statistics obtained for the three parameters for each analytical model alongside the number of specimens considered each time. It can be seen that the parameter for ductility (εc50c)
Table 2. Summary of the experimental data considered
Details of the Specimens No Researchers Specimen
Notation
Susson and Paultre [19]
5A
235x235 195
99.9 3.60 420 2.90 50 705
6 CS-1 124 3.33 55
7 CS-11 4.59 40
8
Razvi and Saatcioglu [20]
CS-12
250x250 218.7
81 1.29 450
Sheikh and Uzumeri [16]
2A6-15
305x305 267
31.7 1.72 403 2.32 35 478
450x450 410 24.8
Cusson and Paultre [19]
8B
235x235 195
52.6 Saatcioglu [20]
CS-24
Sheikh and Uzumeri [16]
4B6-21
305x305 267 35.5
Nagashima et al. [11]
LL08HSA
225x225 200
58.5
2.40
Table 2. Summary of the experimental data considered (cont.)
Details of the Specimens No Researchers Specimen
Notation
Nishiyama et al. [18]
Cusson and Paultre [19]
8D
235x235 195
55.6 Saatcioglu [20]
CS-26
Sheikh and Uzumeri [16]
4D6-24
305X305 267
35.9 3.66 392
450x450 410
24.2
Nagashima et al.
[11] LL08LB 225X225 200 62 2.40 378 2.60 27 807
Cusson and Paultre [19]
5C
235X235 195
99.9 3.60 406,450 3.62 50 770
Sheikh and Uzumeri [19]
2C6-18
305x305 267
33.1
2.22 414
2.27 38 535 F
Table 3. Statistics of the ratio of experimental to analytical values for three key Parameters
Model Statistics f’cc εcc εc50c
(1) (2) (3) (4) (5) Mean 0.97 (128) 1.25 (109) 0.80 (73) St.Dev. 0.12 (128) 0.65 (109) 0.61 (73) Fafitis and Shah
[6]
COV (%) 12.7 (128) 51.9 (109) 76.2 (73) Mean 0.96 (128) 1.35 (109) 0.90 (73) St.Dev. 0.08 (128) 0.70 (109) 0.35 (73) Kappos and
Konstantinidis
[7] COV (%) 8.3 (128) 52.1 (109) 39.2 (73) Mean 0.99 (128) 0.99 (109) 1.16 (73) St.Dev. 0.13 (128) 0.50 (109) 0.41 (73) Faimun el al. [8]
COV (%) 12.6 (128) 50.3 (109) 35.1 (73) Mean 1.02 (128) 0.90 (109) 0.96 (73) St.Dev. 0.09 (128) 0.48 (109) 0.36 (73) Proposed
COV (%) 8.5 (128) 53.8 (109) 37.6 (73) St. Dev.: Standard Deviation. COV: Coefficient of Variation. For Columns (3), (4), and (5), the number in the parenthesis indicates the number of the specimens available or within the range of model applicability.
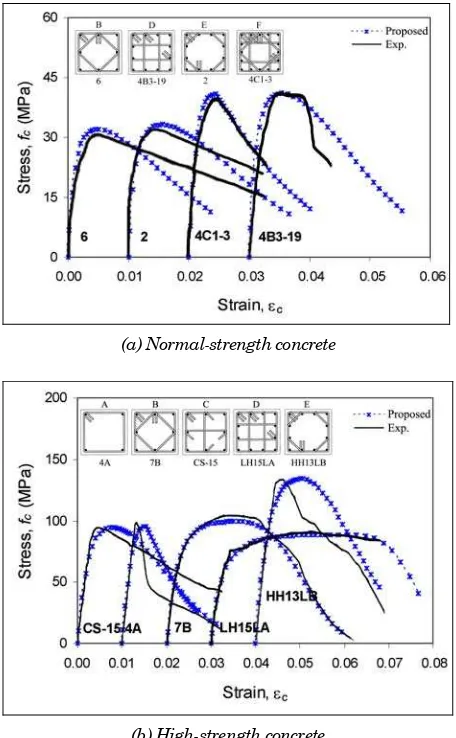
Selected comparisons of analytical and experimental stress-strain curves for four normal- and five high-strength concrete specimens with different tie configurations are given in Fig. 3. It can be seen from Fig. 4 that the overall proposed stress-strain curves give good prediction on the post-peak range (εc50c),
the maximum confined concrete strength (
f
cc′
), and the strain at the maximum stress (εcc) either forconfined normal- or high-strength concrete with various configuration of ties.
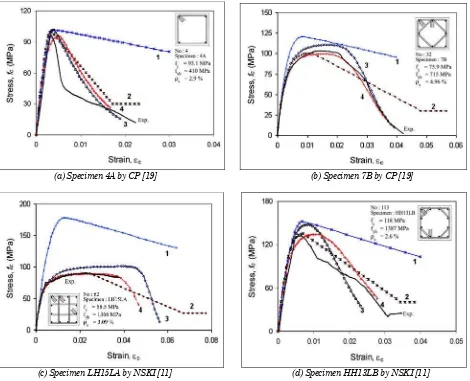
Fig. 5 shows the selected comparisons of proposed and existing analytical stress-strain curves suggested by other researchers [6,7,8] for nine specimens with various tie configurations. To show the accuracy of each model including the proposed model, the experimental stress-strain curves are also presented in the same figures. From the figures, it can be seen that there is a considerable discrepancy on the post-peak response of the stress-strain curves compared with the experimental results, particularly for Fafitis and Shah [6] model. Overall, the proposed model shows the best agreement with the experimental curves compared to the other existing models [6,7,8] either for normal- or well as high-strength concrete with various tie configurations.
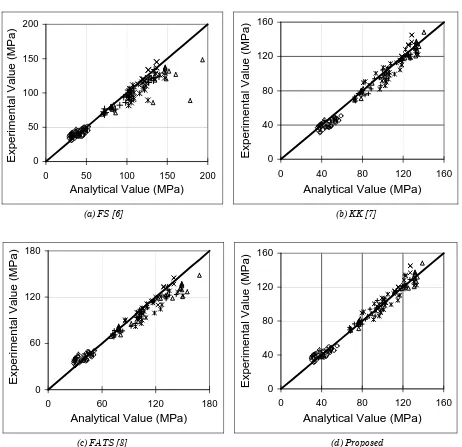
The uncertainty related to the predicted confined concrete strength was found to be relatively low for all models, the coefficient of variation ranging from 8.3 to 12.7 percent (Table 3). This should be attributed to the fact that this particular parameter is straightforwardly defined. However, the equation proposed by Fafitis and Shah [6] in the mid 80’s overestimates the strength increase of confined concrete in several cases, particularly for specimens, which combine high transverse volumetric ratio and high yield steel. The overall coefficient of variation is the highest among the models considered, that is
12.7 percent (Table 3). The proposed equations by Kappos and Konstantinidis [7] derived from linear statistical analysis overestimate the strength gain of confined normal-strength concrete specimens, as seen in Fig. 5.
(a) Normal-strength concrete
(b) High-strength concrete
Fig. 4. Selected comparisons of proposed and experimental stress-strain curves of confined normal- and high-strength concrete
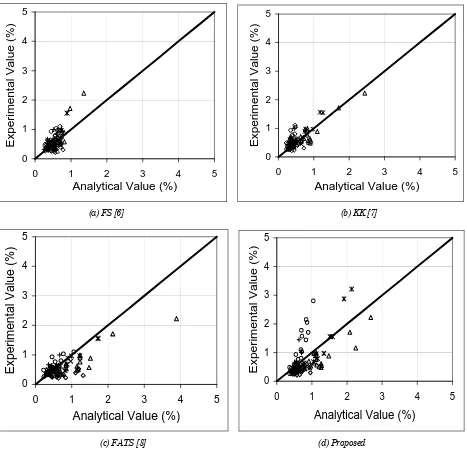
High scatter, in the range of 50.3 to 53.8 percent, was found for the second selected key parameter, which involves the strain at peak stress of confined concrete (εcc), as can be seen in Fig. 7. Measurement
of strain is subject to a number of ambiguities, mainly because it depends on the length along which the ‘average’ strain is calculated, i.e. on the location of the LVDT’s along the specimen.
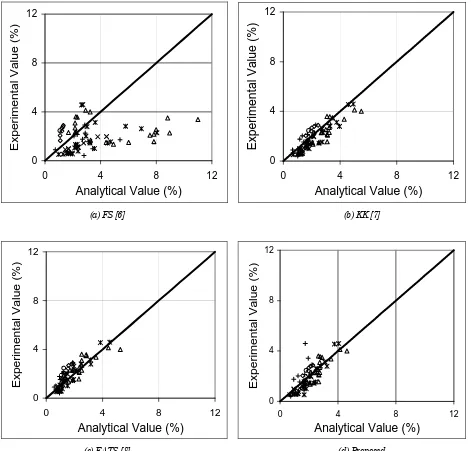
Fig. 8 shows the scatter diagrams for the ultimate concrete strain along the descending branch when the stress drops to 50 percent of the maximum strength of confined concrete (εc50c). The uncertainty
in the prediction of εc50c was found to be relatively
high. The coefficient of variation of εc50c ranges from
35 to 76 percent, on the basis of 73 specimens. Fafitis and Shah [6] model overestimates εc50c by 76 percent.
It is obvious that the lack of experimental results on realistic size columns at the time these models were developed led to a rather poor description of the falling branch. On the other hand, the coefficients of variation given by Kappos and Konstantinidis [7] as well as Faimun et al. [8] are 39 and 35 percent, respectively, on the basis of 73 specimens.
Although, the statistical evaluation of all the key parameters indicates that the proposed model provides comparable accuracy to the other models considered in the present study, the proposed stress-strain curves show higher consistency and better agreement with the experimental curves, as compared to the other models considered in the paper.
(a) Specimen 4A by CP [19] (b) Specimen 7B by CP [19]
(c) Specimen LH15LA by NSKI [11] (d) Specimen HH13LB by NSKI [11]
Legends: Notes:
1. Fafitis and Shah [6] CP: Cusson and Paultre
2. Kappos and Konstantinidis [7] NSKI: Nagashima, Sugano, Kimura, and Ichikawa
3. Faimun, Aji, Tavio, and Suprobo [8] 4. Proposed
0 50 100 150 200
0 50 100 150 200
Analytical Value (MPa)
E
x
pe
ri
m
e
nt
al
V
al
u
e
(M
P
a
)
0 40 80 120 160
0 40 80 120 160
Analytical Value (MPa)
E
x
per
im
ent
al V
a
lue (M
P
a
)
(a) FS [6] (b) KK [7]
0 60 120 180
0 60 120 180
Analytical Value (MPa)
E
x
p
e
ri
m
e
nt
al Value (M
P
a
)
0 40 80 120 160
0 40 80 120 160
Analytical Value (MPa)
Exp
eri
m
e
n
ta
l Va
lu
e (MP
a
)
(c) FATS [8] (d) Proposed
Notes:
FS: Fafitis and Shah
KK: Kappos and Konstantinidis FATS: Faimun, Aji, Tavio, and Suprobo
Legends:
ο Sheikh and Uzumeri [16]
◊Scott, Park, and Priestley [17]
∆Nishiyama, Fukushima, Watanabe, and Muguruma [18]
× Nagashima, Sugano, Kimura, and Ichikawa [11]
∗Cusson and Paultre [19]
+Razvi and Saatcioglu [20]
0 1 2 3 4 5
0 1 2 3 4 5
Analytical Value (%)
E
x
pe
ri
m
ent
a
l V
alue
(
%
)
0 1 2 3 4 5
0 1 2 3 4 5
Analytical Value (%)
E
x
perim
ent
a
l V
a
lue
(
%
)
(a) FS [6] (b) KK [7]
0 1 2 3 4 5
0 1 2 3 4 5
Analytical Value (%)
Ex
per
iment
al V
a
lue (
%
)
0 1 2 3 4 5
0 1 2 3 4 5
Analytical Value (%)
E
x
per
im
ent
al Value (
%
)
(c) FATS [8] (d) Proposed
Notes:
FS: Fafitis and Shah
KK: Kappos and Konstantinidis FATS: Faimun, Aji, Tavio, and Suprobo
Legends:
ο Sheikh and Uzumeri [16]
◊Scott, Park, and Priestley [17]
∆Nishiyama, Fukushima, Watanabe, and Muguruma [18]
× Nagashima, Sugano, Kimura, and Ichikawa [11]
∗Cusson and Paultre [19]
+Razvi and Saatcioglu [20]
0 4 8 12
0 4 8 12
Analytical Value (%)
E
x
per
iment
a
l V
a
lue (
%
)
0 4 8 12
0 4 8 12
Analytical Value (%)
Ex
per
iment
al Value (%)
(a) FS [6] (b) KK [7]
0 4 8 12
0 4 8 12
Analytical Value (%)
Ex
periment
al Value (%)
0 4 8 12
0 4 8 12
Analytical Value (%)
Experi
m
e
n
ta
l Va
lue
(%)
(c) FATS [8] (d) Proposed
Notes:
FS: Fafitis and Shah
KK: Kappos and Konstantinidis FATS: Faimun, Aji, Tavio, and Suprobo
Legends:
ο Sheikh and Uzumeri [16]
◊Scott, Park, and Priestley [17]
∆Nishiyama, Fukushima, Watanabe, and Muguruma [18]
× Nagashima, Sugano, Kimura, and Ichikawa [11]
∗Cusson and Paultre [19]
+Razvi and Saatcioglu [20]
Conclusions
Three existing analytical models for concrete con-fined by rectilinear hoops/ties were studied, and statistical evaluation of three key parameters of the stress-strain curve was presented. Then, using as the basis the existing model that provided the best curve fitting, a new statistical model was developed, using a spline nonparametric regression analysis involving a total of 128 test data. The following conclusions can be drawn from this study.
1. All models predict the ascending branch of the stress-strain curve fairly well, whereas the predicted descending branch is not consistent. 2. Analytical models derived based on experimental
data from normal- or high-strength concrete, and/or small-scale lightly confined columns were shown to have the highest uncertainties, as anticipated.
3. The maximum strength of confined concrete is well predicted by all models. Higher uncertainties were found for ductility ( c50c).
4. The statistical model proposed in the present study using the spline nonparametric regression analysis, which is based on a large experimental database, resulted in fairly low uncertainties equivalent to the other models considered.
5. The proposed stress-strain curve closely predicts the experimental results of confined normal- as well as high-strength concrete with normal- or high strength steel ties.
References
1. Budiantara, I. N., “Pendeteksian Spline Terbobot untuk Estimasi Kurva Regresi Nonparametrik,”
Laporan Penelitian, Laporan No. 510/K03.1/PP/01, Jurusan Statistika, FMIPA, Institut Teknologi Sepuluh Nopember, Maret 2001, pp. 1-56.
2. Eubank, R. L., Spline Smoothing and Nonpara-metric Regression, Marcel, Dekker, New York, 1988.
3. Enggle, R. F., Granger, C. W. J., Rice, J., and Weiss, A., Semiparametric Estimates of Relation between Weather and Electricity Sales, Journal of the American Statistical Association, V. 81, 1986, pp. 310-320.
4. Rosenberg, P. S., Hazard Function Estimation using B-Spline, Biometrics, V. 51, 1995, pp. 874-887.
5. Wahba, G., Spline Models for Observational Data, CBMS-NSF Regional Conference Series in Applied Mathematics, SIAM, Philadelphia, 1990, pp. vi-xii.
6. Fafitis, A., and Shah, P. S., Lateral Reinforce-ment for High-Strength Concrete Columns, ACI Special Publication, SP-87, Detroit, USA, 1985, pp. 213-232.
7. Kappos, A. J., and Konstantinidis, D., Statistical Analysis of Confined High Strength Concrete,
Materials and Structures, V. 32, Dec. 1999, pp. 734-748.
8. Faimun, Aji, P., Tavio, and Suprobo, P., Usulan Kurva Hubungan Tegangan-Regangan Beton Terkekang, Majalah IPTEK, Lembaga Peneliti-an, Institut Teknologi Sepuluh Nopember, V. 12, No. 1, Feb. 1999, pp. 61-70.
9. Budiantara, I. N., Analisis Bayesian untuk Estimator Kurva Regresi Nonparametrik Spline Terbobot, Laporan Penelitian, Laporan No. 803/K03.1/PP/03, Jurusan Statistika, FMIPA, Institut Teknologi Sepuluh Nopember, April 2003, pp. 1-35.
10. Lyche, T., and Morken, K., Spline Methods Draft, (www.ub.uio.n./umn/english/ index.html), 2004.
11. Nagashima, T., Sugano, S., Kimura, H., and Ichikawa, A., Monotonic Axial Compression Test on Ultra High Strength Concrete Tied Columns,
Proceedings of the 10th World Conference on Earthquake Engineering, Madrid, Spain, July 19-24, 1992, V. 5, pp. 2983-2988.
12. Cusson, D., and Paultre, P., Stress-Strain Model for Confined High-Strength Concrete, Journal of Structural Engineering, ASCE, V. 121, No. 3, Mar. 1995, pp. 468-477.
13. Popovics, S., A Numerical Approach to the Complete Stress-Strain Curve of Concrete,
Cement and Concrete Research, V. 3, No. 5, May 1973, pp. 583-599.
14. CEB Working Group on HSC/HPC, High Performance Concrete: Recommended Exten-sions to the Model Code 90, Research Needs,
CEB Bulletin d’Information 228, 1995.
15. Sheikh, S. A., and Uzumeri, S. M., Analytical Model for Concrete Confinement in Tied Columns, Journal of the Structural Division, ASCE, V. 108, ST12, Dec. 1982, pp. 2703-2722.
16. Sheikh, S. A., and Uzumeri, S. M., Strength and Ductility of Tied Concrete Columns, Journal of the Structural Division, ASCE, V. 106, ST5, May 1980, pp. 1079-1102.
18. Nishiyama, M., Fukushima, I., Watanabe, F., and Muguruma, H., Axial Loading Test on High-Strength Concrete Prisms Confined by Ordinary and High-Strength Steel, Proc. Symposium on High-Strength Concrete, 1993, pp. 322-329.
19. Cusson, D., and Paultre, P., High-Strength Concrete Columns Confined by Rectangular Ties,
Journal of Structural Engineering, ASCE, V. 120, No. 3, Mar. 1994, pp. 783-804.
20. Razvi, S., and Saatcioglu, M., Test of High-Strength Concrete Columns under Concentric Loading, Rep. No. OCEERC 96-03, Ottawa Carleton Earthquake Engineering Research Centre, Ottawa, ON, Canada, 1996, pp..147.