VOLATILITY ANALYSIS ON PRODUCER PRICE OF RED PEPPER AND
CAYENNE PEPPER IN WEST JAVA PROVINCE INDONESIA
Analisis Volatilitas Harga Produsen Cabai Merah dan Cabai Rawit
di Provinsi Jawa Barat, Indonesia
Candarisma Dhanes Noor Viana, Slamet Hartono, Lestari Rahayu Waluyati Faculty of Agriculture, Universitas Gadjah Mada
St. Flora, Bulaksumur, Caturtunggal, Depok District, Sleman Regency, Daerah Istimewa Yogyakarta, Indonesia
Diterima tanggal : 14 Juni 2017 ; Disetujui tanggal : 6 November 2017 ABSTRACT
This study aims to determine the price volatility in producer of red pepper and cayenne pepper in West Java Province. The data used in this research was secondary data focusing on monthly price statistics of red pepper and cayenne pepper producer in West Java Province from 2008 to 2015. The method used in this research was ARCH/GARCH method with best model determination. Based on the research, it was found that the best model for the price of red pepper in producer was GARCH (1,1) with the volatility value of 0,96. It means that volatility of price of red pepper in producer level was inluenced by the increase and luctuations on producer price of red pepper one month before. The best model for the price of the cayenne pepper producer was ARCH (1) with the volatility value of 0,52. It means that price volatility of cayenne pepper in producer level was also inluenced by luctuations producer price of cayenne pepper one month before. The value of volatility price of red pepper in West Java Province is closed to one, so it can be categorized of high volatility. Meanwhile, the price on the producer of cayenne pepper in West Java Province can be categorized of low volatility.
Keywords : ARCH/GARCH, cayenne pepper, red pepper, volatility
INTISARI
INTRODUCTION
Horticulture is one of the important sub-sectors in agricultural development and is one of the strategic commodities to be developed. Based on the National Medium-Term Development Plan 2015-2019 of Directorate General of Horticulture, horticultural commodities will become a strategic issue that gets serious attention from the government and business actors that inluences inlation and contributes to the national economic growth. One of horticultural commodities that becomes a strategic issue and inluences inlation is chili. Most people of Indonesia use chili as a raw material to cook every day. Chili is not only used in household scale but also used as a raw material in culinary and industrial businesses, both food and non-food industries. In recent years, there are many culinary businesses using chili as the raw material. Moreover, the public interest towards the products offered is also high. One type of chili that is often sought by consumers is red chili. The red chili is one of the most vulnerable agricultural products experiencing price luctuations. Prices can jump high but can also turn into very low. Game prices of red chili by middlemen lead to losses to farmers (Devi et al, 2015).
The seasonal nature causes an abundant supply of chili commodity in harvest season, so that the price of chili goes down. Whereas when the supply is limited, the price of chili rises. This is because chili is a seasonal commodity that depends on the climate and a perishable commodity, so chilies cannot be planted and harvested throughout the year.
Based on the research conducted by Aryasita (2013), the supply of chili price still depends on the amount of chili produced, while the amount of chili produced depends on the harvest area and land productivity. The amount of chili on offer changes every year. This is due to luctuations in harvest area and production of chili. The amount of chili on offer also depends on rainfall. During high rainfall, the amount of chili production will be small, so the price of chili becomes expensive. The price of chili also inluenced by production and rainfall, according to the research conducted by Farid and Subekti (2012), the factors that inluence the price of chili in Indonesia are production pattern, production cost, distribution, consumption during fasting month and Eid el-Fitr.
Fluctuation in the price of chili caused by various factors makes people mendekati satu sehingga dapat dikatakan volatilitasnya tinggi. Harga produsen cabai rawit di Provinsi Jawa Barat dapat dikategorikan volatilitasnya rendah.
chain. High prices will cause high production, then a lot of supply will result in low prices, and will lead to low production, and so on. Three models of cobweb are convergent, divergent, and continuous.
The following are some studies on price volatility that have been conducted, one of this is the research conducted by Asmara et al (2011) showing that world oil price volatility varies over time. According to Bakari et al (2013), the volatility values of cooking oil price in the world and Indonesia are close to one, indicating a long-term volatility trend with a greater volatility level, resulting in high volatility in the future to be cautious, especially as a result of an increase in fuel or biofuel demand for its effect on the price of CPO at global level.
Other research that use ARCH/ GARCH model is conducted by Sumaryanto (2009) the volatility of retail price among food commodities such as rice, wheat lour, granulated sugar, eggs, cooking oil, red chili, and onion indicates that the prices of food commodities became more volatile.
Other studies about volatility with ARCH/GARCH method is research according to Wijaya et al (2014), the volatility of garlic producers price in East Java before and after trade liberalization showed high volatility. This is because garlic production in Indonesia cannot meet the demand after trade liberalization, so the demand is met by increasing imports. worry. This is because chili has become
one of the staple food as a side dish to complement the main course. Price becomes one of the indicators of food suficiency of society, so, price stability is needed to support the stability of national economy (Edi et al, 2014).
Basically, excess supply or excess demand causes high price and unpredictable fluctuation. Gilbert and Morgan (2011) state that low supply and high demand cause price to rise and vice versa, so the price becomes more volatile. Too high price and unpredictable luctuation can increase price volatility. According to Hirshleifer (1984) the market equilibrium represents the amount demanded which is equal to the amount offered. This is different from the real conditions occurring in the ield where there is an often high and unpredictable luctuation on price due to the imbalance between the supply and demand from the consumers. As Lepetit (2011) if the volatility is more increasing, then price uncertainty in the future will be higher. High price luctuation also allows traders to manipulate price information at the farmer level. If the price luctuation and uncertainty gets higher, it will harm some parties.
Increased imports cause the price of garlic producers in the market to increase, causing price luctuations more dificult to predict and price uncertainty at the producer level. Price uncertainty is commonly referred to as a price volatility problem.
West Java Province is one of the chili suppliers which supplies both Spanish pepper (red chili) and cayenne pepper to various regions of Indonesia to meet consumer demand. When the inventory or stock is reduced, it will lead to a mark-up in all regions in Indonesia. Some districts in West Java that contribute greatly to the supply of red chili and cayenne pepper are Garut, Cianjur, Bandung, Tasikmalaya, Sukabumi, and Purwakarta. Garut is one of the areas with the highest production of red chili and cayenne pepper with contribution of 31.44% and 28.29%. Based on the description, this research aimed to know the volatility of prices at the producer level both on red chili and cayenne pepper in West Java Province as one of the centers of chili production in Indonesia.
METHODS
The type of data used in this study was secondary data. Secondary data used were Producer Price Statistics of Red Pepper and Cayenne Pepper for 8 years (2008-2015) which presented monthly. The data used was obtained from Central Bureau of Statistics (BPS). Based on the purpose of this research, the
Producer Price
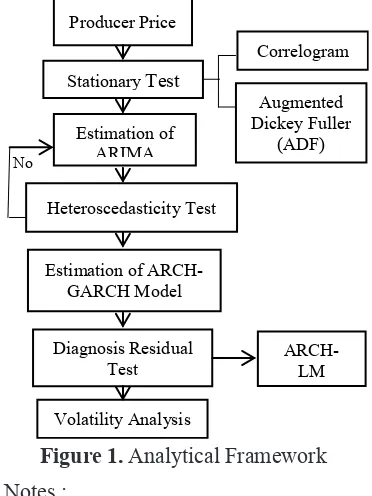
analysis used was volatility analysis using ARIMA and ARCH/GARCH. Here was an analytical framework (steps) conducted in the research (Figure 1).
No
Producer Price
Stationary Test
Estimation of
Figure 1. Analytical Framework
Notes :
: next step
: choose one method
Stationaryity Test
To avoid spurious regression, the data analyzed must be stationary (Diebold & Killian, 2000 cit Sumaryanto, 2009). The stationary data are the ones that do not contain the root unit. Root unit test method used was the test of Augmented Dickey Fuller (ADF). Criteria of conclusion stationaryity test:
that is signiicant, fulilling Durbin Watson test requirements and the probability of the F-test (Sumaryanto, 2009).
The following is a common form of ARCH and GARCH models:
ARCH Model : Yt = β0 + β1X1t + εt
GARCH Model :
Notes :
Y : dependent variable
X : independent variable
ε : residual
σt
2 : residual variance
ω :mean
: component of ARCH : component of GARCH
After the estimation of the ARCH/GARCH model is completed, a further test of residuals is required through ARCH LM test to determine whether there is no remaining ARCH effect or Correlogram Squared Residuals (CSR) test (Sumaryanto, 2009).
Volatility Analysis
Volatility can be known by looking at the value of α+β. The value of α is the ARCH value whereas the value of β is the ii) If the ADF statistic value >
MacKinnon critical value
α = 1%,
α = 5%, α = 10%
, so data of chilli producer price are stationaryHeteroscedasticity Test
The best model that has been obtained is then tested to determine whether the ARIMA model contains heteroscedasticity or not by using ARCH Lagrange Multiplier (ARCH-LM test). If the value of Obs*R-squared > X2 table value, the model will
contain heteroscedasticity problem or it can be said that the model contains ARCH element. Thus, the analysis can be continued for ARCH/GARCH model estimation.
Criteria of conclusion:
i) If Obs*R-squared value ≤ X2 table
value, so the data of chilli producer price is not contain heteroscedasticity element
ii) If Obs*R-squared value > X2 table
value, so the data of chilli producer price is contain heteroscedasticity element
Estimation of ARCH / GARCH Model
GARCH value. Based on the value of α+β, the volatility can be categorized as follows (Lepetit, 2011) :
i) If α+β = 1 or α+β >1, the volatility is high
ii) If α+β <1, the volatility is low
RESULTS AND DISCUSSION
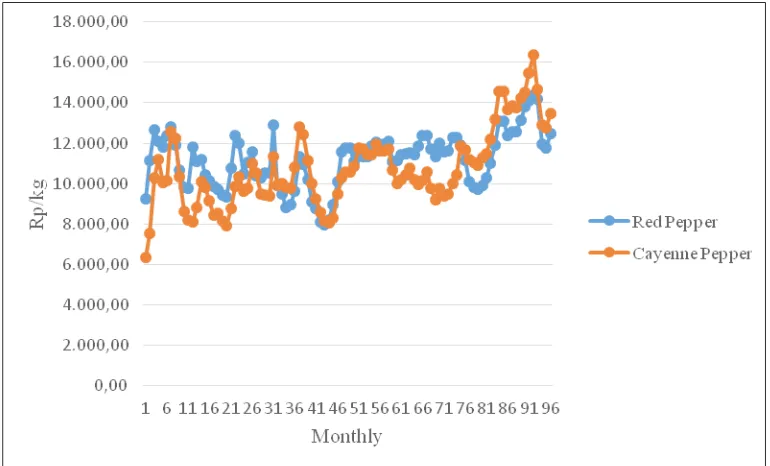
The producer price of red pepper and cayenne pepper in West Java Province luctuated during the periode of research. The data was used in this research from 2008 until 2015 which presented in monthly. Based on the igure 2 can be seen that producer price of cayenne pepper more luctuate than producer price of red pepper. Based on the period of research 2008 until 2015 that it presented in month, the lowest
price of producer price of red peper was Rp 7.940/kg on July, 2011 and the highest price of producer price of red pepper was Rp 14.367/kg on August, 2015.
Meanwhile, the lowest price of producer price of cayenne pepper was Rp 6.336/kg on January, 2008 and the highest price of cayenne pepper was Rp 16.396/ kg on August, 2015. The highest price of producer of red pepper and cayenne pepper in 2015, according to Dadi Sudiyana, Chairman of the Indonesian Association of Agricultural Farmers, it was caused of declining harvest due to long drought. Limited supply of chili can be raised price of red pepper and cayenne pepper.
While in 2011 the price of red pepper reached the lowest point. This was due
to the increasing volume of imports with the increasing production of red pepper in West Java Province as one of the center of chili production. The import volume in 2011 amounted to 7,50 thousand tons or increased from the previous year by 377,03% while the production of red pepper in West Java Province was 195.383 tons or increased 17,21%. This causes the price at the farmer level tends to lower because the consumer price of chili has decreased.
The irst step is testing the stationary state of the data used. A stationary test needs to be done to avoid the possibility of spurious regression. Data is said to be stationary if the value of mean and variance are constant. To identify whether the data is stationary or not can be done by looking at the ACF (Auto Correlation Function) value on the results of the correlogram. ACF describes how big the correlation of consecutive data in time coherence. The data to be used must
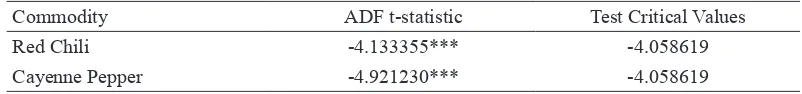
meet stationary requirement, because it is related to the estimation method to be used. If the data is not stationary, it will result in poor estimation method due to the autocorrelation or heteroscedasticity effect. The data can be said to be stationary if the correlogram decreases rapidly with increasing k (lag). As for data that is not stationary, the correlogram tends not to go to zero or does not decrease even though the k (lag) value increases. In addition to using correlogram, stationarity of data can be known from Augmented Dickey Fuller (ADF) test results. When the ADF statistic value > MacKinnon critical value at α = 1%, α = 5%, and α = 10%, then the data can be said to be stationary.
Table 1 of stationery test results using ADF (Augmented Dickey Fuller) method shows that the prices of red chili and cayenne pepper in West Java province is stationary at the level and conidence of 99%. After knowing the data of producer prices of red chili and cayenne pepper to be Table 1. The Stasionerity Test Results of Red Chili and Cayenne Pepper Prices in West
Java Province
Commodity ADF t-statistic Test Critical Values
Red Chili -4.133355*** -4.058619
Cayenne Pepper -4.921230*** -4.058619
Source: Secondary Data Analysis, 2017 Notes:
in stationary state, the next step taken was to determine the best ARIMA models by determining the best AR and MA degrees. AR model is a form of relationship between dependent variable (producer price of red pepper or cayenne pepper) with independent variable (previous period of producer price of red pepper or cayenne pepper. While MA model shows the dependence of dependent variable of producer price of red pepper or cayenne pepper on the residual values of the previous period in sequence. The determination of AR and MA to be used for the best model estimation is by using trial and error method, by considering the autocorrelation line and the partial correlation line out of the Bartlett line.
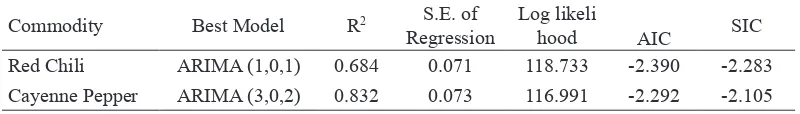
Based on the trial and error results, the best ARIMA models for the producer prices of red chili and cayenne pepper in West Java Province is obtained as shown in Table 2. The best ARIMA models were chosen based on several criteria, namely, high R2 and log likelihood values, AIC
(Akaike Info Criterion) value, SIC (Schwarz Criterion), low standard error value and signiicant variable. The equations for the best ARIMA models that have been obtained
can be written as follow :
HPCMJBt = 9.311805 + 0.737631 AR(1) + 0.279102 MA(1) +
et (1)
HPCRJBt = 9.253871 + 0.28804 AR(1) – 0.681920 AR(2) +
0.643340 AR(3) + 0.487308 MA(1) + 0.716670 MA(2) +
et (2).
Based on equations 1 and 2, it can be interpreted that the producer price of red chili in West Java Province is inluenced by the producer price of red chili in West Java Province one month earlier and luctuation in producer price of red chili in West Java Province one month earlier. While the producer price of Cayenne pepper in West Java Province is inluenced by the producer price of Cayenne pepper in West Java Province three months earlier and luctuation in producer price of Cayenne pepper in West Java Province two months earlier.
The next step taken after obtaining the best ARIMA models was to identify whether the model contains heteroscedasticity element or not. It aimed to continue to the Table 2. The Best ARIMA Models for Producer Prices of Red Chili and Cayenne Pepper
in West Java Province
Commodity Best Model R2 S.E. of Regression
Log likeli
hood AIC SIC Red Chili ARIMA (1,0,1) 0.684 0.071 118.733 -2.390 -2.283 Cayenne Pepper ARIMA (3,0,2) 0.832 0.073 116.991 -2.292 -2.105
next analysis, is volatility analysis. One of the methods used to know the existence of heteroscedasticity effect is by correlogram squared residuals value. If the probability value of correlogram squared residuals is signiicant, then it can be said that the model still contains heteroscedasticity. The results of the test heteroscedasticity by correlogram. The best ARIMA models of producer price of red chili and cayenne pepper in West Java Province in some lags were signiicant. So, it can be said that the best ARIMA models listed in Table 2 contain ARCH element or the residuals is random. Thus, the next analysis can be performed, i.e., to look for the best models for the ARCH-GARCH. The estimation results of ARCH/GARCH best models will be used to estimate its volatility value, whether it is included in high volatility or low volatility category.
The selection of the best ARCH/ GARCH models was based on high R2
and log likelihood values, standard error value, AIC (Akaike Info Criterion), low SIC (Schwarz Criterion), and signiicant variable. The next step taken after obtaining the best ARCH/GARCH models was to retest whether the ARCH/GARCH models still contain heteroscedasticity element or not. One of the tests that can be done was by ARCH-LM test.
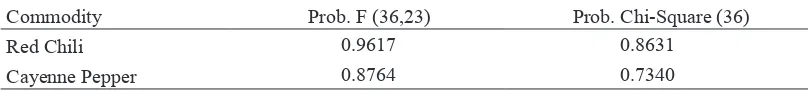
Based on Table 4 of the ARCH-LM test results, the best ARCH-GARCH estimation model of producer prices of red chili and cayenne pepper in West Java Province does not contain heteroscedasticity element. This can be seen from the prob. Chi-Square value greater than 0,05. Thus, the next step can be taken, i.e., to know the volatility value from the sum of coeficients α and β. The following are equations of the volatility of producer price of red chili and cayenne pepper in West Java Province. Table 3. The Results of ARCH/GARCH of Producer Price of Red Chili and Cayenne
Pepper in West Java Province
Commodity Best Model R2 S.E. of Regression
Log
likelihood AIC SIC
Red Chili GARCH (1,1) 0.678 0.072 126.391 -2.508 -2.348 Cayenne Pepper ARCH(1) 0.829 0.073 123.978 -2.416 -2.203
Source: Secondary Data Analysis, 2017 Table 4. The ARCH-LM Test Results
Commodity Prob. F (36,23) Prob. Chi-Square (36)
Red Chili 0.9617 0.8631
Cayenne Pepper 0.8764 0.7340
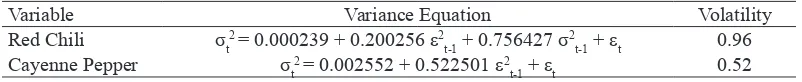
The factors inluencing the volatility of the producer price of red chili in West Java Province were the volatility of producer price of red chili in West Java Province one month earlier and the variance of producer price of red chili in West Java Province one month earlier. While the factor inluencing the volatility of the producer price of cayenne pepper in West Java Province was the volatility of the producer price of of cayenne pepper in West Java Province one month earlier.
The volatility value of producer price of red chili and cayenne pepper in West Java Province can be seen by looking at the value of α and β. According to Lepetit (2011), volatility can be known by looking at the value of α + β. The α value is obtained from the ARCH value, while the β value is obtained from the GARCH value. If α + β = 1 or α + β > 1, then it can be said to be high volatility. Whereas if α + β < 1, then it can be said to be low volatility. According to Burhani (2013), if the ARCH value is relatively low or not close to one, it indicates that the volatility is low. Whereas if the GARCH value is relatively high or close to one, it indicates that the shocks in the price variance will luctuate within longer period.
Based on Table 5, the volatility value of producer price of red chili in West Java Province is smaller than one, so it can be categorized as low volatility but it is almost close to one. The volatility of producer price of red chili in West Java Province cannot be interpreted to be stable and always predictable because its value is less than one. However, this should be noted because the volatility value approaching one indicates the tendency of volatility to last in a long time with greater volatility level. Supply and demand shocks inluence the volatility of high price, i.e., the demand is increasing but not balanced with suficient stock due to the decrease in production. In addition, volatility of high price is also caused by weather and disease in plants. Chili is a commodity that cannot be stored for a long time, so if there is no good storage treatment, chili will quickly decay, especially during the rainy season. So, during the rainy season, the supply will decrease, thus driving the price luctuation. The volatility of producer price of cayenne pepper in West Java Province can be said to be low. It is seen from the value of 0,52, meaning that the volatility of producer price of cayenne pepper occurred only in Table 5. The Results of Volatility Analysis of Producer Prices of Red Chili and Cayenne
Pepper in West Java Province
Variable Variance Equation Volatility
Red Chili σt2 = 0.000239 + 0.200256 ε2
t-1 + 0.756427 σ 2
t-1 + εt 0.96
Cayenne Pepper σt2 = 0.002552 + 0.522501 ε2
t-1 + εt 0.52
certain period and the time is relatively short. The volatility of cayenne pepper price in West Java Province is classiied as low volatility but still must be considered because of the possibility of price luctuation which will cause high volatility.
T h e t h e o r y t h a t e x p l a i n s t h e phenomenon of price volatility is Cobweb theory. Cobweb theory explains the price cycles and quantities of production that luctuate over time. Based on the results of analysis using ARCH-GARCH method to determine the value of volatility, it is obtained that the volatility of producer price of red pepper of West Java Province is 0,96 so it can be said high volatility. High volatility can be said to stay away from the balance point. Cobweb model that can describe the phenomenon is Divergent Cobweb Model. The Divergent Cobweb Model occurs as a result of greater supply elasticity when compared to demand elasticity. Price cycle begins with an offer of Q0 , that it is a lack of the number of goods offered so that prices will tend to increase. As the price increases then the offer will also increase so that it changes to Q1. An increase in supply will lead to a fall in prices. The fall in prices will lead to a decrease in the amount of production, this will lead to an increase in prices. High prices again encourage a larger increase in the production side resulting in excess supply. This cycle will occur continuously until the end of production becomes very abundant or there is scarcity related to
resource availability, supply elasticity will change so that production cannot continue to be done. As for the volatility producer price of cayenne pepper in West Java Province was 0,52 so it can be classiied into low volatility. The Cobweb model that can be represented this result was Covergent Cobweb Model. Covergent Cobweb Model explains that this model leads to equilibrium point. This occurs due to the elasticity of supply which is smaller than the elasticity of demand.
September, November, and December. The harvest period of chili lasts for 10 months from January to October and there is no chili harvest in November and December, so there is no supply of chili for two months in Garut. The absence of chili stock for two months can affect the price both at provincial and national level. When there is no stock, the price is rising and the condition will get worse with increasing demand for chili due to religious festivals. Thus, the low volatility of producer prices in West Java Province is caused by the supply of chilli that can meet the demand, and some chilli needs in West Java Province can be met from the region itself or still in one province.
CONCLUSION AND SUGGESTION
Price volatility at the producer level of red pepper and cayenne pepper in West Java Province can be categorized as low volatility because the value of volatility is smaller than one. The producer price volatility of red pepper in West Java Province was inluenced by one month’s previous volatility and one month’s previous price variant, where the volatility was 0,96. Producer price of cayenne pepper in West Java Province was inluenced by volatility of one month earlier that was equal to 0,52.
The volatility price of chilies at the producer level based on the research that has been done is closed to one, so there is a possibility that the price of chili at the producer level can turn into high volatility.
The price of chilies at the producer level that luctuates from one period to another causes the possibility of price at the consumer level experiencing luctuations, such things can be detrimental both at the community and national level. Thus the need for further research on price volatility at the consumer level and research on the factors that inluence volatility, as well as the attention to the issue of the price, is by monitoring the stock or supply of chilli sufficient. Thus, it is necessary to address the problem of volatility. One of the ways is on-farm activities. One of the on-farm activities that can be done is to improve the management of cropping patterns of red pepper and cayenne pepper. So that either during the harvest season or not, the supply will still be available and the price does not soar both at the producer and consumer level.
REFERENCES
Anwarudin. M.J.S, Apri. L., Sayekti. A. Marendra, dan Y. Hilman. 2015. Dinamika produksi dan volatilitas harga cabai : antisipasi strategi dan kebijakan pengembangan. Jurnal Pengembangan Inovasi Pertanian 8(1) : 33-42.
Asmara, A., R. Oktaviani, Kuntjoro, M. Firdaus. 2011. Volatilitas harga minyak dunia dan dampaknya terhadap kinerja sektor industri pengolahan dan makroekonomi Indonesia. Jurnal Agro Ekonomi 29 :49-69
Bakari, Y., R. Anindita, dan Syafrial. 2013. Analisis volatilitas harga, transmisi harga dan volatility spillover pada pasar dunia crude palm oil (CPO) dengan pasar minyak goreng di Indonesia. AGRISE 13 : 1412-1425. Burhani. F. J., A. Fariyanti dan S. Jahroh.
2013. Analisis volatilitas harga daging sapi potong dan daging ayam broiler di Indonesia. Journal IPB 3(2) : 19-40. http://journal.ipb.ac.id/ index.php/fagb/article/view/8869. [13 Januari 2017].
Devi, P., Harsoyo dan Subejo. 2015. Keefektifan lembaga pasar lelang cabai merah di Kecamatan Panjatan Kabupaten Kulon Progo. Agro Ekonomi 26(2) : 139-149.
Diebold, F.X and L. Killian. 2000. Unit root tests are useful for selecting forecasting models. Journal of Business and Economic Statistics 18 : 265-273.
Edi, S dan Rahmanta. 2014. Analisis integrasi dan volatilitas harga beras
regional ASEAN terhadap pasar beras Indonesia. Jurnal Ekonom 17(2) : 79-91.
Farid, M dan N.A. Subekti. 2012. Tinjauan terhadap produksi, konsumsi, distribusi dan dinamika harga cabe di Indonesia. Buletin Ilmiah Litbang Perdagangan 6:211-234.
Gilbert, C.L and C.W. Morgan. 2010. Food price volatility. Journal Phil. Trans. R. Soc. B 365 : 3023-3034.
Hirshleifer, J and G, Amihai. 1984. Price Theory and Application. Third Edition. New Jersey : Prentice-Hall Inc.
Lepetit. 2011. Methods to Analyse Agricultural Commodity Price Volatility. Chapter : Price Volatility and Price Leadership in the EU Beef and Pork Meat Market. New York : Springer Science & Business Media.
Sumaryanto. 2009. Analisis volatilitas harga eceran beberapa komoditas pangan utama dengan model ARCH/ GARCH. Jurnal Agro Ekonomi 27(2) : 135-163.