CONTENTS
Capital Gains Taxation and Stock Market Investments: Empirical Evidence 1
Akinloye Akindayomi
Does Experience Affect Auditors’ Professional Judgment? Evidence from Puerto Rico 13
Carmen B. Ríos-Figueroa & Rogelio J. Cardona
A Dynamic Panel Model of Capital Structure and Agency Cost in Nigerian Listed Companies 33
Dauda Mohammed
Ownership Structure and Stock Repurchase Policy: Evidence from France 45
Rim El Houcine
The Impact Of Economic Fluctuations on Earnings Forecasts 55
Ronald A. Stunda
Does a Size Limit Resolve Too Big to Fail Problems? 65
Mohamed Drira & Muhammad Rashid
The Impacts of a Microinance Lending Scheme on Clients in Ghana 79
Paul A. Onyina & Sean Turnell
The Effect of Type A Personality on Auditor Burnout: Evidence from Indonesia 89
Intiyas Utami & Ertambang Nahartyo
Auditor Independence, Audit Fees Low-balling, and Non-audit Services: Evidence from Fiji 103
Arvind Patel & Pranil Prasad
VOLUME 5 NUMBER 2 2013
A
Accounting & Taxation
Editors
James E. Briley
Northeastern State University Gary M. Fleischman
University of Wyoming Peter Harris
New York Institute of Technology Paul D. Hutchison
University of North Texas John Shon
Fordham University
Antonella Silvestri University of Calabria Jonathan D. Stewart
Abilene Christian University William Stahlin
Steven Institute of Technology Gianfranco A. Vento
Regent’s College
Editorial Advisory Board
Managing Editor
Mercedes Jalbert
Academic Editor
Terrance Jalbert
Accounting & Taxation, ISSN:1944-592X (print) and ISSN 2157-0175 (online), publishes high-quality articles in all areas of accounting, auditing, taxation and related ields. Theoretical, empirical and applied manuscripts are welcome for publication consideration. The Journal is published twice per year by the Institute for Business and Finance Research, LLC. All papers submitted to the Journal are double-blind reviewed. The Journal is listed in Cabell’s directory and Ulrich’s Periodicals Directory. The Journal is distributed in print and through EBSCOHost, ProQuestABI/Inform and SSRN.
The views presented in the Journal represent opinions of the respective authors. The views presented do not necessarily relect the opinion of the editors, editorial board or staff of the Institute for Business and Finance Research, LLC. The Institute actively reviews articles submitted for possible publication. However, the Institute does not warrant the correctness of the information provided in the articles or the suitability of information in the articles for any purpose.
This Journal is the result of the collective work of many individuals. The Editors thank the members of the Editorial Board, ad-hoc reviewers and individuals that have submitted their research to the Journal for publication consideration.
All Rights Reserved The Institute for Business and Finance Research, LLC
1
CAPITAL GAINS TAXATION AND STOCK MARKET
INVESTMENTS: EMPIRICAL EVIDENCE
Akinloye Akindayomi, University of Texas – Pan American
ABSTRACT
The objective of this study is to examine stock market investments responses to changes in capital gains tax rate. A priori, rational taxpayers are expected to respond to changes in this tax rate. For example, a reduction (increase) in capital gains tax rates may make taxpayers to unlock (lock-in) substantial amounts of accrued (realizable) appreciated gains. The findings of this study however reveal that capital gains realization and not capital gains tax rates impacts stock market investments in the U.S.
JEL: M40, M41
KEYWORDS:Stock Market Investment,Capital Gains Tax Rates, Realized Capital Gains
INTRODUCTION
n many countries, including the U.S., the concept of deferral is central to capital gains taxation. That is, capital gains are taxed when ‘realized’ after sale or exchange of the eligible capital assets. On one hand, Haig-Simons ‘pure net accretion’ regime demands that capital gains (losses) should be subject to tax (deduction) in the year they accrue thereby requiring taxpayers to estimate realizable value of appreciated taxable assets. This may force taxpayers into untimely and inefficient liquidation of some assets in order to meet ensuing capital gains tax liability and obligations. Undoubtedly, this violates the fairness principles inherent in the U.S. taxation system. On the other hand, the double taxation argument ideally suggests a zero capital gains tax on capital accumulation. In corollary, incomes from capital gains enjoy preferential tax treatments.
Arguably, the preferential treatment of capital gains income (especially of long term character) contradicts tax equity doctrine, which suggests that all income (capital gains or ordinary income) should be taxed at same rates. It becomes pronounced if one considers the tax treatment of the ‘carried interest’ component of the compensation package of hedge fund managers. In fact, the Congressional Budget Office estimates that the treasury will bring in over $20 billion dollars additional tax revenue between 2012 and 2021 if ‘carried interest’ is treated as ordinary income and taxed at ordinary income rates (CBO, 2011). No wonder then that the literature on desirability of capital gains tax is at best inconclusive in terms of its desirability and optimum capital gains tax rate level that maximizes economic efficiency.
It is widely believed that high-end taxpayers with long-end holding period and substantially appreciated capital assets have the tax and financial incentive to postpone otherwise efficient realization of capital gains in order to defer capital gains tax liability, and that in some cases avoid it by waiting until death in order to enjoy the step-up basis associated with estate taxation. This is a classical manifestation of the lock-in effect rule (Ivkovich et al., 2004. See also Elton et al., 2010) as this allows for resetting the capital assets’ tax bases (including the unrealized capital gains) at death. In addition to potential loss in tax revenue, this rule certainly distorts optimal investments portfolio and diversification strategy as capital could be trapped in inefficient investment outcomes. However, the extent at which investors believe in the ability of current tax rates to predict future tax liability remains an empirical question.
Focusing mainly on capital gains generated through stock market transactions, this study attempts to empirically examine whether, on aggregate, investors/taxpayers fully and truly respond to the interaction between changes in capital gains tax rate and capital assets liquidation in a ‘rational’ way. A priori,
A. Akindayomi| AT♦ Vol. 5 ♦ No. 2 ♦ 2013
2
rational taxpayers are expected to respond to changes in this tax rate. For example, a reduction (increase) in capital gains tax rates may make taxpayers to unlock (lock-in) substantial amounts of accrued (realizable) appreciated gains. This study specifically finds that on aggregate, total capital gains realized and not necessarily capital gains rate affect stock market investments in the U.S. It must be noted that Barber and Odean (2000) document that some investors tend to misappropriate the timing of their stock transactions by holding ‘to losers too long’ and selling ‘winners too soon’ (see Jin, 2006; Sialm and Starks, 2012), although it is believed when investors get trapped in the former, the locked-in gains effects on overall capital allocation is negligible (CBO, 2002). The remainder of the paper proceeds as follows. The next section reviews the relevant literature in order to motivate the research question and the hypotheses. While section 3 focuses on sample, data and methodology; results are presented and discussed in section 4. Also the findings from additional sensitivity analysis performed and the follow-up discussions are provided in the same section. Chapter 5 concludes the study.
LITERATURE REVIEW
Capital gains tax proceeds are not insignificant part of the tax revenue collected by the U.S. treasury through Internal Revenue Service (IRS). For example, between 2002 and 2007, the percentage of realized capital gains relative to total income continues to increase from 3.67% to slightly over 10%. A major reduction in capital gains is the deductibility of capital losses. However, the tax law imposes constraints on the amount of such losses that individuals can deduct in order to prevent taxpayers from generating artificial losses. This study mainly focuses on capital gains generated through stock market transactions as this is the major source of capital gains in the U.S. (see Moore, 2008; Sikes and Verrecchia, 2012). Analytical and theoretical literature suggest that outside tax considerations, investors will nonetheless accelerate realization of capital gains for liquidity and diversification priorities (see Hong and Stein, 2003; Zeng, 2009). Therefore, to always argue that increasing capital gains tax rate will slow stock market activities is an overstatement especially in view of the findings of Jin (2006) which shows that ‘…on the average, tax insensitive institution is larger than average tax-sensitive institution’.
In fact, Jin further finds what he called ‘counterintuitive’ as his data indicates that tax-sensitive institutions are more active in turning over their portfolio even with capital gains rate hikes relative to the tax-insensitive institutions. Since 1913 when capital gains were first taxed at ordinary income tax rates, capital gains tax has witnessed numerous historical metamorphoses both in magnitude (i.e. tax rates) and structurally (for example exclusion of gains). Tax reform Act of 1986 increased the maximum rate to 28% while at the same time repealing the exclusion of long-term gains. Despite the fluctuation in rates, the effect of inflation on capital gains is well documented in the literature. In fact, Auten (1999) argues that lower or middle income taxpayer capital gains over time simply represent nominal gains but ‘real economic losses’. Hence the need to focus capital gains taxation on high-end individuals with substantial gains more so that Poterba (1987) notes that statutory capital gains tax rate is substantially higher than the true capital gains tax rate (see also Chay et al, 2005; Graham et al, 2012).
3 As capital gains taxation is considered an important element in the equation of fiscal adequacy, one can also appreciate its potential to influence the consumption/savings and risk-taking behaviors of individuals and other economic units. For example, the magnitude and allocation of investments may respond to changes in capital gains tax rate. However, the interplay of ordinary income tax and preferential capital gains tax rate potentially could moderate the degree of investment risk-taking in the system. That is, the preferential nature of capital gains taxation, the progressivity of the income tax rates coupled with the deduction of losses limits may encourage healthy balance in the risk-taking activities in the economy. In fact, Kenny (2005) asserts that preferential tax rate on capital gains does not necessarily increase risk taking. The relevance of capital gains taxation to pricing and trading decisions in the stock market is undeniable (see Hanlon and Heitzman, 2010; Arnold et al., 2011).
Typically, in a no-tax regime, investors should accelerate the realization of capital gains, ceteris paribus. However, they may choose to accumulate the gains in order to either net capital losses therefrom; or rebalance such capital gains and capital losses at death, at which time the inherited capital assets reset to the existing market price. The latter is no doubt a major loophole that high-end taxpayers enjoy; a loophole many believe is unfair. It can be further argued that this loophole impedes market liquidity no less than upward change in capital gains tax rate. Closing loopholes is a way to ensure that the tax base approximates closely economic income in a comprehensive manner. One reason for such a delay in realization is that investors consider capital gains tax liability as additional ‘transaction costs’.
Jin (2006) suggests that capital gains tax component of the transaction costs could sometimes be higher than the conventional costs. Therefore, investors are expected to adjust their investment behaviors ‘rationally’ to changes in capital gains tax rates. However, the author suggests that such behavioral response differ between a ‘tax sensitive’ and ‘tax insensitive’ taxpayer, claiming that the former group are more ‘sensible’ than the latter in their trading patterns. He also notes the asymmetry of prices reactions vis-à-vis cumulative capital gains within the context of costly arbitrage. Among its proponents, preferential capital gains treatment is believed to be ‘self-financing’ due to increase in investment-capital accumulation (Kenny, 2005). This argument alludes to the universal acceptability of preferential capital gains tax rate relative to ordinary income rates. However, the optimum range of rates between capital gains and income taxation remains an empirical issue (see Conesa and Krueger, 2006; Peterman, 2012).
A. Akindayomi| AT♦ Vol. 5 ♦ No. 2 ♦ 2013
4
Figure 1: Taxable Net Capital Gains by Income Group (1999 – 2010)
This figure shows the percentage of concentration of capital gains wealth by the following income groups: Higher Income = Taxpayers with Adjusted Gross Income of $500, 000 or more Lesser Income = Taxpayers with Adjusted Gross Income of Less than $500,000
Table 1: Taxable Net Gains by Income Group (1999 – 2009)
[1] [2]
Year Capital Gains Held by High Income Taxpayers (%)
Capital Gains Held by Other Taxpayers (%)
This table shows capital gains held by different groups of income status. High Income = Taxpayers with Adjusted Gross Income of $500, 000 or more Other Taxpayers = Taxpayers with Adjusted Gross Income of Less than $500,000 Source: IRS, Statistics of Income Division, July 2012.
DATA AND METHODOLOGY
Data for this study are obtained from different sources including Department of the Treasury – Office of Tax Analysis; Internal Revenue Service (IRS); Tax Policy Center (TPC); Bureau of Labor Statistics (BLS); Bureau of Economic Analysis (BEA) as well as DataStream Database. For the most part, each of these sources contains similar data that are overlapping but with consistent numbers. This triangulation of sources attests to the accuracy and reliability of the data used in this study. The capital gains data are collected from the TPC. This center substantially aggregates many tax data from the IRS (and some of the sources mentioned above) which is a primary and dependable source of taxation data in the U.S. The stock market indices data are collected from DataStream Database while the GDP figures are collected from the Bureau of Economic Analysis. The sample period covers a-50 Year period from 1960 to 2009 for many of the capital gains taxation analysis (subject to data availability). The frequency of the data observations used in the study is annual. Consistent with the research question of this study and motivated by the review of relevant literature above, the hypothesis stated below, in alternative form, is tested:
Hypothesis: Changes in capital gains tax rate does affect aggregate investments in the U.S. stock market.
The following empirical model is used in the analysis:
t
5 Where:
SMI = stock market investments
CGRATE = the maximum capital gains tax rate
TRCG = the total realized capital gains
GDP = gross domestic product
DUMRATE = a categorical variable that equals 1 in the years when CGRATE falls relative to previous grouped year
INTRATE = interaction of DUMRATE and TRCG
The dependent measure (SMI) is run separately in the time-series regression using the three major U.S. stock market indices, i.e., Dow Jones Industrial, S&P 500, and NASDAQ Composite. I understand that there is some overlapping of companies in these indices. The more reason I use them in separate regression analysis instead of combined in one analysis. This effort is to examine if the results are different in these individual but separate indices. For the categorical variable, ten different groupings of years with the same capital gains tax rate are identified. These periods are then used to specifically capture years of increased or reduced capital gains tax rate (see Table 2). The GDP variable is used to control for real fluctuations and variations in the U.S. economy. The variable – TRCG – may appear redundant relative to the dependent measures. However, its inclusion in the specification is conceptually driven. For example, TRCG data points were solely from individuals as they exclude tax-exempt institutions which by nature are not sensitive to capital gains tax rate changes, but which are major players in the stock market (for more, see Jin, 2006). More so, those entities (and even some tax-sensitive ones) have some regulatory obligations and oversights, suggesting that their stock investment decisions are generally not mainly motivated by changes in capital gains tax regime. Also, the specification allows analysis of TRCG with respect to each of the three major stock indices in the U.S. The results discussed below further accentuate this.
Table 2: Maximum Capital Gains Tax Rate
[1] [2] [3] [4]
Group Year Range Maximum Capital
Gains Tax Rate
Group Type
1 1960 - 1967 25% Reduced
2 1968 -1969 26% - 27.5% Increased
3 1970 – 1971 32.21% - 34.25% Increased
4 1972 – 1975 36.5% Increased
5 1976 – 1978 39.88% Increased
6 1979 – 1981 28% Reduced
7 1982 - 1986 20% Reduced
8 1987 – 1997 28% - 28.93% Increased
9 1998 – 2003 20% - 21.19% Reduced
10 2004 - 2009 15% - 16.05% Reduced
This table shows the maximum capital gains tax rate for the 10 grouped years. Source: Column 3 data comes from Department of the Treasury, Office of Tax Analysis.
RESULTS AND DISCUSSION
A. Akindayomi| AT♦ Vol. 5 ♦ No. 2 ♦ 2013
6
Figure 2: Total Realized Capital Gains between 1960 And 2009
This figure shows the graphical pattern of Total Realized Capital Gains (TRCG) between 1960 and 2009 tax years.
Figure 3: Total Realized Capital Gains between 1960 And 2009 For Reduced Capital Gains Tax Rate Years
This figure shows the graphical pattern of Total Realized Capital Gains (TRCG) between 1960 and 2009 tax years for years of reduced Capital Gains Tax Rate.
Figure 4: Total Realized Capital Gains between 1960 and 2009 For Increased Capital Gains Tax Rate Years
This figure shows the graphical pattern of Total Realized Capital Gains (TRCG) between 1960 and 2009 tax years for years of increased Capital Gains Tax Rate.
0 200,000 400,000 600,000 800,000 1,000,000
1960 1962 1964 1966 1968 1970 1972 1974 1976 1978 1980 1982 1984 1986 1988 1990 1992 1994 1996 1998 2000 2002 2004 2006 2008 TRCG
0 200,000 400,000 600,000 800,000 1,000,000
1960 1961 1962 1963 1964 1965 1966 1967 1979 1980 1981 1982 1983 1984 1985 1986 1998 1999 2000 2001 2002 2003 2004 2005 2006 2007 2008 2009 TRCG
TRCG
0 100,000 200,000 300,000 400,000
TRCG
7 Descriptive and Correlation Statistics
The descriptive analysis is presented in Panel A of Table 3. During the study period, the mean (median) of the total realized capital gains is over $196 billion ($123 billion) while the maximum capital gains tax rate has a mean (median) of 26.16% (25.95%). The gross domestic product for same period has a mean (median) of over $5 trillion ($4 trillion). The stock indices of Dow Jones, S&P 500 and NASDAQ have approximately the mean (median) of 3,748 (1,259), 481 (242) and 983 (455) respectively. The GDP figures corroborated by the stock market indices, show that the U.S. economy is vibrant and that total realized capital gains in the economy are substantial, which is approximately 4% of the size of the economy on average during the period under review.
The correlation figures as presented in Panel B of Table 3 are all significant at conventional thresholds. Worth noting is the correlation sign (–) between CGTRATE and all other variables. However, the time-series regression analysis shows a different result. With the level of correlation coefficients reported in the table, a multicolinearity diagnosis reveals that there is no perfect collinearity among the regressors.
Table 3: Descriptive Statistics and Correlation Matrix
[1] [2] [3] [4] [5]
Panel A: Descriptive Statistics
Variables Mean Median Standard
Deviation
Q1 Q3
TRCG ($million) 196,276.8 123,278 22,355.44 3,1305 282,287.75
GDP ($billion) 5,204.49 4,074.20 4,346.55 1,210.13 8,447.68
CGTRATE (percent) 26.16 25.95 6.68 21.13 25.95
DJONEs (index) 3,747.86 1,259.39 4,027.28 878.54 7,740.35
SandP500 (index) 481.33 242.17 477.89 97.55 903.25
NASDAQ (index) 983.14 454.82 998.60 195.84 1,950.40
Panel B: Correlation Matrix
Variables TRCG GDP CGTRATE DJONEs SandP500 NASDAQ
TRCG 1
GDP 0.873*** 1
CGTRATE -0.647*** -0.633*** 1
DJONEs 0.920*** 0.951*** -0.620*** 1
SandP500 0.916*** 0.928*** -0.631*** 0.982*** 1
NASDAQ 0.861*** 0.858*** -0.651*** 0.933*** 0.972*** 1
This table shows the descriptive and correlation matrix for the listed variables. Note on Panel A: The period of analysis covers a 50-year span between 1960 and 2009. TRCG is the Total Realized Capital Gains; GDP is the Gross Domestic Product; CGRATE is the maximum capital gains tax rate: DJONEs is the Dow Jones Industrial; SandP500 is the Standard & Poor’s 500; NASDAQ is the Nasdaq Composite. Not on Panel B: Variables remain as described above. All correlations are significant at conventional thresholds.*, **, *** indicate significance at the 10, 5, and 1 percent levels respectively.
Regression Results
The regression results are contained in Table 4. Column 1 contains the anticipated coefficient signs for each independent variable. For example, I expect TRCG to have a positive sign, meaning that an increase in realized capital gains is a direct evidence of an increase in stock investments in the U.S. Similar expectation goes for the GDP variable. However, the CGTRATE variable has a negative expectation sign because consistent with general belief (and corroborated by the correlation statistics mentioned above), a drop in capital gains tax rate should increase stock market investments. Recall that DUMRATE is a dummy variable that equals one in the years when CGRATE falls relative to previous grouped year. So, the expectation is that the coefficient of this variable will be negative. The INTRATE is the interaction of DUMRATE and TRCG which coefficient is estimated to be positive, meaning that in years when
A. Akindayomi| AT♦ Vol. 5 ♦ No. 2 ♦ 2013
8
as proxied by the three major stock indices in the U.S. is low (high). Interestingly, this counterintuitive result is corroborated in the analysis by the direct relationship between CGTRATE and TRCG.
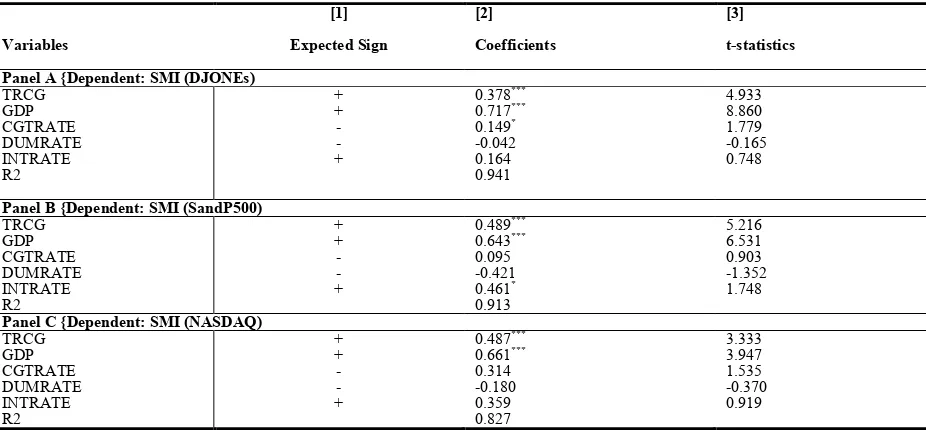
Table 4: Regression Coefficients
[1] [2] [3]
Variables Expected Sign Coefficients t-statistics
Panel A {Dependent: SMI (DJONEs)
TRCG + 0.378*** 4.933
GDP + 0.717*** 8.860
CGTRATE - 0.149* 1.779
DUMRATE - -0.042 -0.165
INTRATE + 0.164 0.748
R2 0.941
Panel B {Dependent: SMI (SandP500)
TRCG + 0.489*** 5.216
GDP + 0.643*** 6.531
CGTRATE - 0.095 0.903
DUMRATE - -0.421 -1.352
INTRATE + 0.461* 1.748
R2 0.913
Panel C {Dependent: SMI (NASDAQ)
TRCG + 0.487*** 3.333
GDP + 0.661*** 3.947
CGTRATE - 0.314 1.535
DUMRATE - -0.180 -0.370
INTRATE + 0.359 0.919
R2 0.827
This table shows the regression coefficients for equation 1. The period of analysis covers a 50-year span between 1960 and 2009. Panel A has DJONEs, Panel B has SandP500 and Panel C has NASDAQ as the dependent measures respectively. TRCG is the Total Realized Capital Gains; GDP is the Gross Domestic Product; CGRATE is the maximum capital gains tax rate: DJONEs is the Dow Jones Industrial; SandP500 is the Standard & Poor’s 500; NASDAQ is the Nasdaq Composite; DUMRATE is a categorical variable that equals 1 in the years when CGRATE falls relative to previous grouped year; INTRATE is interaction of DUMRATE and TRCG. The numbers in column [2] are Standardized Beta Coefficients. *, **, *** indicate significance at the 10, 5, and 1 percent levels respectively.
One explanation for the result could be that investors willing to unlock wealth of capital gains may want to take advantage of capital loss realization in order reduce such gains even during the period of higher capital gains tax rate. This becomes plausible if one considers the fact that from marginal tax rate analysis perspective, $1 dollar of a loss (gain) worth more (less) during years of higher marginal tax rates. However, because the variable (CGTRATE) is not significant at the 5% conventional threshold, further interpretation needs to be made with caution.
Further, it is only the TRCG and GDP variables that are statistically significant. Reporting the standardized beta figures, the coefficient (t-statistics) of TRCG 0.378 (4.933) in DJONEs; 0.489 (5.216) in SandP500; and 0.487 (3.333) in NASDAQ. With a non-significant capital gains tax rate, these results indicate that total realized capital gains and not the capital gains rate impacts stock market liquidity after controlling for the overall economic activity as captured by the GDP variable which expectedly is highly significant in all the three regression models. In addition, this study shows that in terms of the magnitude of the coefficients and the t-statistics, total realized capital gains impacts stock market investments more through the S&P 500 index, followed by the NASDAQ and then the Dow Jones indices. However, Down Jones index appears to lead other indices in years when Gross Domestic Product is high. Together, this may be value-relevant to investors in their investment decision choices.
Additional Analysis
9
)
2
(
1 6 5
4 3
2 1
0 t t t t t t t
t
CGRATE
TRCG
GDP
DUMRATE
INTRATE
SMI
SMI
=
α
+
α
+
α
+
α
+
α
+
α
+
α
−+
ε
The results from the t-statistics show consistent non-significance coefficients of the CGTRATE variable in all the three analysis (DJONEs (1.069), SandP500 (0.860) and NASDAQ (1.488)). In other words, the findings are substantially similar to those of the original model specification.
It must be mentioned that even if there are autocorrelation issues in the model, it should bias the t-value of the regression parameter’s estimate in favor of CGTRATE (a main variable of interest) attributing overstated t-ratio to it, thus making it statistically significant. But this variable consistently exhibits statistical insignificance in the analyses across all the three dependent measures. Also, it must be noted that autocorrelation is a common and more severe problem in daily, weekly or monthly data relative to yearly data, the interval used in this study. In spite of the conceptual rationale, the TRCG variable was completely removed from equations (1) and (2) above in order to examine whether it takes explanatory power away from CGTRATE. Still CGTRATE remains, non-significant across the three dependent measures in all specifications. For example, for equation 1 (equation 2), the t-statistics for DJONEs = 1.712 (0.101), SandP500 = 1.240 (0.201) and NASDAQ = 1.905 (0.968). In other words, the tenor of the findings remains unchanged. Also, due to the fact that the period between 1987 and 1997 experienced unusual rapid increase in stock prices, added analysis were made to specifically examine the stock market reactions to capital gains rate during this period.
The findings are substantially similar. Further, I reexamine the regression analysis (albeit with slightly shorter time horizon) using long term capital gains, qualitatively similar results are found. Notwithstanding the above findings, caution should be exercised in interpreting the results/findings of this study. For example, the high R-Squared number reported in Table 4 is consistent with studies having similar econometric properties like the current one. Therefore, it should not necessarily be interpreted as an indication of a good model fit. Greene (2012) clearly states that “…in fact, in using aggregate time-series data, coefficients of determination this high (94.64) are routine” (pp. 45). Also, this analysis excludes state capital gains effect. In addition, it is worthy to note that investors’ trading behaviors depend largely on their expectations and horizon (see Gaspar et al., 2013). A pessimistic (optimistic) investor will sell more (less) albeit higher (lower) capital gains tax rate.
Further, even though the tax law substantially prevents taxpayers from converting the character of ordinary income into tax-favored capital gains, by and large, sophisticated taxpayers could still engage in sophisticated and complex tax avoidance strategies. There is also the econometric specification concern regarding omitted variable, which could bias the coefficient estimates. Even though it is believed that autocorrelation “will not affect the unbiasedness or consistency of the OLS regression estimators, it does affect their efficiency” (Pindyck and Rubinfeld, 1998) by making OLS to underestimate the standard error of the coefficients relative to the true standard error. In other words, to the extent that one or combination of these caveats occurs, the tenor of the findings of this study could be biased. Future study could examine how long into the future does the response effect (if any) of changes in capital gains tax rate last. Also, the negative sign of the capital gains tax rate found in the current study deserves further research analysis; notwithstanding its statistical insignificance as reported in this study. This becomes more important if one considers the direct relationship between this variable and the total realized gains variable.
CONCLUSION
A. Akindayomi| AT♦ Vol. 5 ♦ No. 2 ♦ 2013
10
The sample period covers a-50 Year period from 1960 to 2009, using data obtained from different sources including Department of the Treasury – Office of Tax Analysis; Internal Revenue Service (IRS); Tax Policy Center (TPC); Bureau of Labor Statistics (BLS); Bureau of Economic Analysis (BEA) as well as DataStream Database. The following caveats suggest that caution needs to be applied in interpreting the findings of this study. The analysis excludes state capital gains effect and depending on the state of tax residence of the investor, the combined tax burden may be material. It must also be noted that investors trading behaviors depend largely on their expectations and horizon. In addition, sophisticated taxpayers may engage in complex tax avoidance gimmicks to game the capital gains tax system by converting the character of ordinary income into tax-favored capital gains. Further, there is also the econometric specification concern regarding omitted variable, which could bias the coefficient estimates. Therefore, to the extent that one or combination of these caveats occurs, the tenor of the findings of this study could be biased. Finally, future study could examine how long into the future does the response effect (if any) of changes in capital gains tax rate last. Also, the negative sign of the capital gains tax rate found in the analysis deserves further research analysis; notwithstanding its statistical insignificance as reported in this study.
REFERENCES
Arnold, J. M., Brys, B., Heady, C., Johansson, Å., Schwellnus, C., & Vartia, L. (2011). Tax Policy for Economic recovery and growth. The Economic Journal, 121(550), 59-80.
Auten, G. (1999). Capital Gains Taxation: From The Encyclopedia of Taxation and Tax Policy.
Barber, B., & Odean, T. (2000). Trading is hazardous to your wealth: The common stock investment performance of individual investors. Journal of Finance, 55, 773-806.
Becker, G. S. (2009). Human capital: A theoretical and empirical analysis, with special reference to education. University of Chicago Press.
Boyer, D. J., & Russell, S. M. (1995). Is it time for a consumption tax? National Tax Journal, 48(3), 363-372.
CBO. (2002). Capital gains taxes and federal revenues. Retrieved from
http://www.cbo.gov/sites/default/files/cbofiles/ftpdocs/38xx/doc3856/taxbrief2.pdf
CBO. (2011). Reducing the deficit: Spending and revenue options. Retrieved from
http://www.cbo.gov/sites/default/files/cbofiles/ftpdocs/120xx/doc12085/03-10-reducingthedeficit.pdf
Chay, J. B., Choi, D., & Pontiff, J. (2005). Market valuation of tax-timing options: Evidence from capital gains distributions. Journal of Finance, 61(2), 837-865.
Conesa, J. & Krueger, D. (2006). On the optimal progressivity of the income tax code. Journal of Monetary Economics, 53(7), 1425-1450.
Elton, E. J., Gruber, M. J., Blake, C. R., Krasny, Y., & Ozelge, S. O. (2010). The effect of holdings data frequency on conclusions about mutual fund behavior. Journal of Banking & Finance, 34(5), 912-922.
11 Graham, J. R., Raedy, J. S., & Shackelford, D. A. (2012). Research in accounting for income taxes.
Journal of Accounting and Economics, 53(1), 412-434.
Greene, W. H. (2012). Econometric Analysis. (Seventh Edition), Prentice-Hall International Inc. New York University.
Hanlon, M., & Heitzman, S. (2010). A review of tax research. Journal of Accounting and Economics,
50(2), 127-178.
Heckman, J. J., Lochner, L., & Taber, C. (1998). Tax policy and human capital formation. American Economic Review, 88, 293-297.
Hong, H., & Stein, C. (2003). Differences of opinion, short sales constraints, and market crashes. Review of Financial Studies, 16, 487-525.
Ivkovich, Z., Poterba, J., & Weisbenner, S. (2004). Tax-motivated trading by individual investors (Working Paper No. 10275). Retrieved from National Bureau of Economic Research website: http://www.nber.org/papers/w10275
Jin, L. (2006). Capital gains tax overhang and price pressure. Journal of Finance, 61(3), 1399-1431.
Judd, K. L. (1998). Taxes, uncertainty and human capital. American Economic Review, 88 (2), 289-292.
Kenny, P. (2005). Australia’s capital gains tax discount: More certain, equitable and durable? Journal of the Australasian Tax Teachers Association, 1 (2), 38-107.
Moore, S. (2008). Capital gains taxes. The Concise Encyclopedia of Economics. Retrieved from the Library of Economics and Liberty website: http://www.econlib.org/library/Enc/capitalgainstaxes.html
Peterman, W. B. (2012). Determining the motives for a positive optimal tax on capital. Journal of Economic Dynamics and Control, 37(1), 265-295.
Pindyck, R. S. & Rubinfeld, D. L. (1998). Econometric models and economic forecasts. McGraw-Hill, New York.
Poterba, J. (1987). How burdensome are capital gains taxes: Evidence from the United States. Journal of Public Economics, 33, 157-172.
Sanders, C., & Taber, C. (2012). Life-Cycle Wage Growth and Heterogeneous Human Capital. Annual Review of Economics, 4(1), 399-425.
Sialm, C., & Starks, L. (2012). Mutual fund tax clienteles. Journal of Finance, 67(4), 1397-1422.
Sikes, S. A., & Verrecchia, R. E. (2012). Capital gains taxes and expected rates of return. The Accounting Review, 87(3), 1067-1086.
Tanzi, V. (1969). The individual income tax and economic growth: An international comparison. Johns Hopkins Press.
A. Akindayomi| AT♦ Vol. 5 ♦ No. 2 ♦ 2013
12
Zeng, T. (2009). Stock price reactions to the Canadian Lifetime Capital Gains Exemption. Accounting & Taxation, 1(1), 75-85.
ACKNOWLEDGEMENT
I will like to thank the journal editors, two anonymous reviewers and colleagues at the University of Texas – Pan American for their constructive critiques and insightful comments.
BIOGRAPHY
13
DOES EXPERIENCE AFFECT AUDITORS’
PROFESSIONAL JUDGMENT? EVIDENCE FROM
PUERTO RICO
Carmen B. Ríos-Figueroa, Universidad del Este
Rogelio J. Cardona, University of Puerto Rico-Rio Piedras
ABSTRACT
Auditors use professional judgment to collect and evaluate evidence to issue an opinion on the fairness of a business entity’s financial statements. Prior research finds that international auditing firms should consider cultural aspects when planning an audit examination and that the experience and knowledge possessed by an auditor influences the decision-making processes in an audit. This paper examines whether experience could affect the professional judgment of auditors during the planning phase of an audit. The investigation consists of a survey made among auditors working in audit and accounting firms, Independent Practitioners, and university senior students majoring in accounting to determine if the years of work experience of an auditor influences the evaluation of the internal control environment and the assessment of fraud risk for a firm operating in different countries with different cultural characteristics. The results obtained suggest that experience does not seem to affect their decisions when they are based on professional judgment.
JEL: F23, M40, M41, M42
KEYWORDS: Experience, Culture, Internal Control, Fraud Risk, Individualism/Collectivism, Power Distance, Uncertainty Avoidance, Short and Long-Term Vision, Professional Judgment
INTRODUCTION
he assessment of fraud risk is one of the most important steps in an audit examination of the financial statements of a business entity. If the entity (audit client) is located in another country, independent auditors (with or without experience) will have to make decisions based on their professional judgment. The country where an auditor performs the audit field-work procedures is one of the factors that will be considered in the decision-making process, especially when the client is located in a country with different cultural characteristics. Cohen, Pant and Sharp (1993) and Tsakumis, Campbell and Doupnik (2009) assert that international firms of Certified Public Accountants (CPAs) should consider cultural aspects when planning an audit examination.
The results of this study are important because of the increasing professional liability currently faced by CPA firms that provide audit and assurance services. Their reputation and brand name in the global business environment has been tarnished by recent accounting fraud scandals. This implies that auditors must be alert to fraud risk factors (“red flags”) that may affect the fairness of the entity’s financial statements, which could be caused by significant deficiencies or material weaknesses in a firm’s system of internal controls. The literature identifies differences in the audit environments and the performance of multi-cultural analysis between countries using accounting students or auditors in countries like USA, Canada, Asia, and Mexico. Hofstede’s cultural dimensions (1980, 2001) are frequently used to predict the effects of cultural differences: individualism and collectivism, power distance, masculine and feminine, uncertainty avoidance, and long versus short-term vision.
C. B. Ríos-Figueroa & R. J. Cardona| AT♦ Vol. 5 ♦ No. 2 ♦ 2013
14
Prior research describes the use of auditors with different levels of experience, the most common being the use of students. Several studies have examined the effect of the auditor’s experience on professional judgment and the decisions made by auditors (Ashton and Brown, 1980; Hamilton and Wright, 1982; Bedard, 1989; Bonner and Lewis, 1990; Libby and Frederick, 1990; Ho and May, 1993; Davis, 1996). However, these studies do not address how the experience of the auditors could affect their professional judgment in their assessment of the possibility of fraud and on the reliability of a firm’s internal control system in environments with different characteristics.
The objective of this investigation is to examine whether experience affects the decisions made by auditors during the planning stage of an audit. To the best of our knowledge there are no previous studies that address whether the number of years of work experience of independent auditors could affect their assessment of fraud risk and the reliability of a firm’s internal control environment during an audit examination of a client with global operations and cultural diversity in its workplace. The remainder of the paper is organized as follows. Section 2 describes the relevant literature. Sections 3 and 4 describe the hypotheses development, the research design, and the data sources for this investigation. Sections 5 and 6 present the methodology used and the empirical results obtained. Section 7 presents our conclusions.
LITERATURE REVIEW
Culture
The definitions for culture are many and varied. Kroeber and Kluckhohn (1952) identified over 160 definitions of the word culture. The most often cited definition of culture is the one provided by Hofstede (1983) that defines it as a collective programming of the mind, hard to change, that distinguishes one group of people from others. According to Hofstede (1983), regional and national differences remain and are one of the crucial problems for management, particularly for managers of multinational firms. For Hofstede, cultural programming is difficult to change, unless you isolate or detach individuals from their culture. From 1968 to 1972, Hofstede collected and analyzed data on 100,000 individuals who were working at The International Business Machines Corporation (IBM) in fifty different countries and in three geographical regions. The objectives of Hofstede’s 1983 study were to create a terminology to describe cultures that had an empirical basis and use that information systematically gathered from a number of cultures, instead of only using anecdotal impressions. The results of the aforementioned study and subsequent studies allowed Hofstede to develop a model to identify the cultural patterns of each group consisting of four primary dimensions: individualism and collectivism, power distance, uncertainty avoidance and masculinity (or femininity).
15 Impact of Culture on Audit Procedures
Several studies have been made on how culture can affect audit procedures, especially during the planning phase, where the independent auditor can use more professional judgment. For Cohen et al. (1993), increased merger activity among public firms and the expansion of CPA firms have created the need for global CPA firms to consider the impact of international cultural diversity in their decision-making processes and the ethical sensitivity of their employees. Hughes et al. (2009) find that cultural characteristics seem to influence the ability of recently graduated auditors to perform analytical review procedures that require prediction changes in balance sheet accounts. Ge and Thomas (2007) note that Canadian accounting students most frequently used ethical factors and made ethical decisions during an audit more frequently than Chinese accounting students.
According to Tsui (1996), cultural differences seem to affect the levels of ethical reasoning among auditors. Cohen et al. (1995) conducted a study of auditors in Latin America, Japan, and the United States, which suggests that culture is related to the ethical evaluations of the subjects studied and the likelihood that they or their colleagues performed a task. The results obtained by Sim (2010) also imply that the auditors' report on internal controls should be aware that national culture is an important factor to be considered by auditors in their assessment of control risk.
Fraud and Culture
According to Watson (2003), people with different cultural backgrounds have different opinions as to how to deal with fraud. Brulenski and Zayas (2004) assert that if an event of potential fraud is identified, the auditor should evaluate whether it has a material effect or impact on the entity’s financial statements. This could involve performing additional audit procedures and considering what other aspects of the audit examination could be affected. Fraud research has increased in recent years because of the many well publicized cases of management misbehavior, weak governance, and corporate failures. Brulenski and Zayas (2004) assert that recent events, new legislation, and new professional guides have increased customer expectations regarding the independent auditor's responsibility to detect fraud. This has been positive since public confidence in auditors was weakened by the occurrence of accounting scandals such as Enron, where fraudulent accounting practices were allowed (or ignored) by the CPA firm of Arthur Andersen LLP. Several studies have identified some factors associated with the culture of a country that may allow the existence of fraud. Davis and Ruhe (2003) find that the dimensions of collectivism and power distance seem to be associated with corruption. For Husted (1999), the cultural profile of a corrupt country is associated with a high level of power distance and high uncertainty avoidance. Getz et al.
(2001) state that a country with a high rejection of uncertainty avoidance and a country with large power distance seems to be positively associated with corruption. The authors also suggest that corruption is inconsistent with a long-term oriented culture. Tax evasion is another event whose occurrence might be considered as fraud. Tsakumis et al. (2007) and Richardson (2008) associate countries that do not meet their tax commitments with a low level of individualism. Tsakumis et al. (2007) also associate countries that do not meet their tax commitments with a culture of large power distance. Bribery is another factor that has been associated with Hofstede’s cultural dimensions. Sanyal and Guvenli (2009) find that companies operating in countries with a high degree of individualism and with a long-term vision are less likely to engage in the payment of kickbacks or bribes.
Experience and the Independent Auditor’s Professional Judgment
C. B. Ríos-Figueroa & R. J. Cardona| AT♦ Vol. 5 ♦ No. 2 ♦ 2013
16
operations and cash flows, in conformity with either accounting principles generally accepted in the United States of America (U.S. GAAP), or International Financial Reporting Standards (IFRS). According to Ashton, Keinmuntz, Sullivan and Lawrence (1988, cited in O'Donnell 1995), auditors must integrate their internal information (knowledge stored in memory) to gather evidence and arrive at a conclusion based on their judgment. Several studies have linked the auditor's experience level with their professional judgment and ability to make decisions. According to Ashton and Brown (1980), there is more agreement among the judgment of experienced auditors than among less experienced auditors. In addition, more experienced auditors have an easier time explaining their judgmental decisions than less experienced auditors. Hamilton and Wright (1982) find that although experience has an important role in decision-making, its role is more significant in the context of less structured decisions.
Bedard (1989) reviews the literature on experience in auditing and compares the cognitive approach with the behavioral approach. According to the cognitive approach, the process of thinking and knowing is what determines human behavior; the behavioral approach suggests that external (environmental) factors are what determine behavior. Using the cognitive approach, Bedard (1989) notes that there will be a difference in knowledge between more experienced auditors and less experienced auditors. He also states that these differences may lead more experienced auditors to use a different decision-making process than less experienced auditors. However, using the behavioral approach, Bedard (1989) explains that more experienced auditors do not behave differently than less experienced auditors. Other researchers have studied how audit procedures performed may affect the auditor's professional judgment. The typical hierarchy in a CPA firm is the following (from the highest rank to the lowest rank); Partners, Managers, Senior Auditors, and Staff Auditors. Cohen and Kida (1989) state that the substantive audit procedure known as “analytical review” has a greater effect on the judgment of an Audit Manager than on the judgment of a Senior Auditor. In addition, they note that the reliability of a firm’s internal controls affects the Senior Auditor more than the Audit Manager.
Experience and knowledge have been identified as possible factors that may influence an auditor’s performance. Bonner and Lewis (1990) note that although experienced auditors have a stronger performance, on average, than auditors with less experience, knowledge, and innate ability provide a better explanation for the difference in their performance. Libby and Frederick (1990) find that experienced auditors exhibit a more complete understanding of the errors in the financial statements and are able to generate a larger amount of explanatory hypotheses to explain them. For these researchers, experienced auditors can reach a proper conclusion more quickly than their less experienced colleagues. Ho and May (1993) used auditors and students to analyze two cases, one in which they used their knowledge in auditing and another that did not need prior knowledge of the subject. The researchers found that the ability to reason and judgment used by auditors and students were not very different from each other in the case where it was not necessary to use auditing knowledge. In the case of an audit, experience and knowledge resulted in different responses between auditors and students.
17 RESEARCH DATA AND METHODOLOGY
Hypotheses Development
Experience may be an important factor influencing the judgment made by auditors in their evaluation of the reliability to be placed on a firm’s internal control environment and the assessment of possible fraud risk factors. For Ho and Chang (1994), professional knowledge and not national culture, is the factor that plays a dominant role in the auditor's probabilistic judgments. It has been noted that such knowledge and experience are the factors that can determine the difference in the decisions made by auditors. Libby and Frederick (1990) find that experienced auditors may generate more hypotheses that can explain errors in a firm’s financial statements. The authors also note that experienced auditors can reach a proper conclusion more quickly than recently designated (less experienced) auditors. Similar to these researchers, Davis (1996) states that more experienced Senior Auditors arrive at a judgment in less time than less experienced Senior Auditors. Ho and May (1993) use students and auditors in their study and agree that experience and knowledge result in a different response in the cases analyzed by each group.
Bedard (1989) uses a cognitive approach and notes that the knowledge gap between more experienced Senior Auditors and less experienced Senior Auditors may result in a different decision-making process by the more experienced auditors. Independent practitioners and university senior students majoring in accounting have been used in prior studies related to audit engagements, culture, and the auditor’s experience and professional judgment. University senior students have also been used to investigate the impact of culture on audit procedures (Welton and Davis 1990; Patel and Psaros, 2000; Hughes et al., 2008). Prior research suggests that the years of work experience and knowledge of an auditor influences their decision-making processes in an audit engagement.
In this study we consider whether the number of years of experience of auditors working in CPA firms in Puerto Rico at different levels of responsibility ("Staff Auditors", "Senior Auditors", Managers, Partners) or Independent Practitioners, and university senior students majoring in accounting could affect their professional judgment in their evaluation of the internal control environment and assessment of fraud risk in a client that operates in different countries with cultural diversity in its workplace. We use four of Hofstede’s (1980, 2001) cultural dimensions (individualism and collectivism, power distance, uncertainty avoidance and long or short-term vision) to examine the effects of cultural differences and whether experience has any effect on the decisions made by auditors related to their evaluation of an entity’s internal controls and their assessment of a client’s fraud risk. We predict that the three groups of participants in our study will respond differently to certain situations in their evaluation of the internal control environment and assessment of fraud risk. Based on our prediction we present the following hypotheses:
H1: Participants will make different decisions regarding their assessment of the reliability of a firm’s internal controls depending on their years of work experience.
H2: Participants will make different decisions regarding their assessment of the possibility of fraud in a firm depending on their years of work experience.
Research Design and Sample Selection
C. B. Ríos-Figueroa & R. J. Cardona| AT♦ Vol. 5 ♦ No. 2 ♦ 2013
18
answer all of the questions, leaving the sample with 156 eligible participants. The scenarios were distributed as evenly as possible: where Scenario I (an individualistic country or a collectivistic country) was analyzed by 37 participants; Scenario II (a country with high power distance and a country with low power distance) was analyzed by 37 participants; Scenario III (a country with a high degree of uncertainty avoidance and a country with a lower degree of uncertainty avoidance) was analyzed by 42 participants; and Scenario IV (a country with long-term vision and a country with short-term vision) was analyzed by 40 participants. The participants in this study were 86 females and 70 males.
The current occupation of the participants in the study is as follows: 57 are university senior students majoring in accounting, 24 are Staff Auditors and 26 are Senior Auditors in a CPA firm, 21 are classified as either Audit Manager or Partner in a CPA firm, 23 are Independent Practitioners, and 5 were classified as “Other”. The years of work experience of the participants are as follows: 77 participants have 0-2 years’ experience, 23 participants have 3-5 years’ experience and 56 participants have 6 years or more of work experience. The place of employment of the participants in the study are as follows: 14 work in international CPA firms, 61 work in local CPA firms, 20 work as Independent Practitioners, three work in industry, 57 are students and one works in a financial institution.
Table 1: Sample Selection
Sample participants Total surveys distributed Less: 3. Senior Auditor in a CPA firm 4. Manager or Partner in a CPA firm 5. Independent Practitioner
This table presents the sample participants in the study classified by gender, occupation, years of work experience and place of employment.
19 and name of employer). An ordinal scale was used for the perception of the reliability of internal controls and the likelihood of fraud, ranging from significantly “lower than” to significantly “higher than”.
Research Data
The questionnaire used in this study was developed using a model created by Huber (2001). The scenarios that describe the characteristics of the countries using four of Hofstede’s dimensions (1980, 2001) were modified. In addition, several questions about their assessment of fraud risk were added. Each participant received an informed consent form and another document that described the countries in which a company operates. The majority of the descriptions used on the questionnaire were the characteristics used by Hofstede (1980, 2001) for each dimension, modifying them only to construct more clear and complete sentences. Each questionnaire took approximately 20 minutes to complete. Some questionnaires were sent online, if the participant so required.
This study investigates the association between years of work experience and the evaluation of the reliability of internal controls and fraud risk. Our model considers years of work experience as the independent variable and the reliability of a firm’s internal control environment and the perception of the possibility of fraud as the dependent variables. A nonparametric analysis of variance was used (Kruskal-Wallis test) to compare the different sample groups and determine whether there was a difference among the participants in the study of their perception of the reliability of internal controls and their assessment of fraud risk given their years of work experience.
EMPIRICAL RESULTS
Hypothesis 1 predicts that participants will make different decisions regarding their perception of the reliability of a company’s internal controls depending on their years of work experience. Tables 2 through 5 provide the results of questions 1-4 on their perception of the reliability of internal controls for all the scenarios examined. Hypothesis 2 predicts that participants will make different decisions regarding their perception of the potential for fraud in a company depending on their years of work experience. Tables 6 to 9 present the results of questions 5-8 on their perception of the possibility of fraud. The sample was stratified by years of work experience. Group 1 included participants with 0-2 years of work experience; group 2 included participants with 3-5 years of experience; and group 3 included participants with 6 or more years of experience. The Kruskal-Wallis test calculates an average rank of the responses from the participants to examine the difference between the groups. A significance level of 10 percent was established for the perception decisions on the reliability of internal controls and the possibility of fraud. The answer sheet provided to the participants was coded to allow possible answers to the questionnaire’s questions as: a, b, c, d and e. To facilitate the analysis of responses, answers were coded as follows: a = 1, b = 2, c = 3, d = 4 and e = 5.
C. B. Ríos-Figueroa & R. J. Cardona| AT♦ Vol. 5 ♦ No. 2 ♦ 2013
20
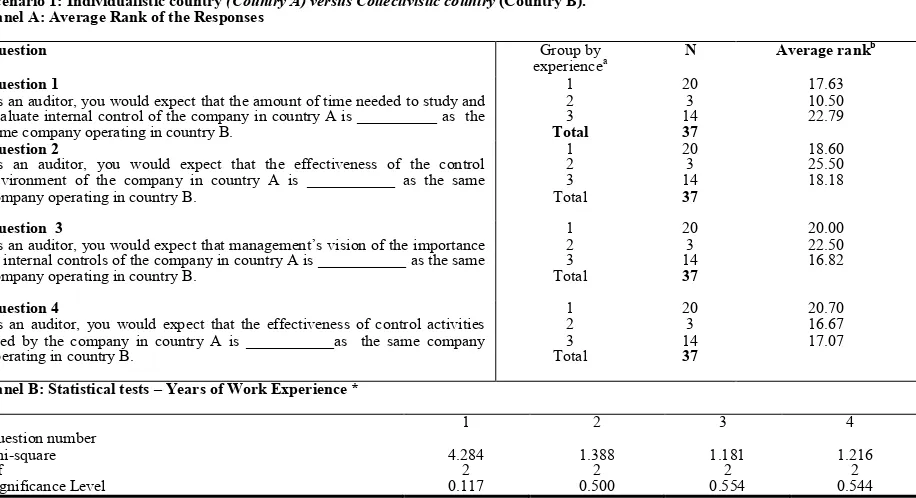
Table 2: Kruskal-Wallis Test to Determine Whether There Is a Difference in the Perception of Auditors Regarding the Reliability of Internal Controls Considering Their Years of Work Experience
Scenario 1: Individualistic country (Country A) versus Collectivistic country (Country B). Panel A: Average Rank of the Responses
Question Group by
experiencea N Average rank
b
Question 1
As an auditor, you would expect that the amount of time needed to study and evaluate internal control of the company in country A is __________ as the same company operating in country B.
1
As an auditor, you would expect that the effectiveness of the control environment of the company in country A is ___________ as the same company operating in country B.
As an auditor, you would expect that management’s vision of the importance of internal controls of the company in country A is ___________ as the same company operating in country B.
As an auditor, you would expect that the effectiveness of control activities used by the company in country A is ___________as the same company operating in country B.
Panel B: Statistical tests – Years of Work Experience *
Question number
1 2 3 4
Chi-square 4.284 1.388 1.181 1.216
Df 2 2 2 2
Significance Level 0.117 0.500 0.554 0.544
This table presents the average rank of the responses obtained from the participants in the study that examined an individualistic country and a collectivistic country and their perceptions of the reliability of internal controls in a firm based on their years of work experience.
(a) Group 1 is 0-2 years of work experience, group 2 is 3-5 years of experience, and group 3 is 6 or more years of experience. (b) Refers to the average rank of the participants' responses. * indicates significance at the 10 percent level.
Question 4 (what an auditor expects regarding the effectiveness of a company’s internal control activities) resulted in an average rank for group 1 of 20.70, Group 2 has a value of 16.67, and group 3 has 17.072. This results in a Chi-square statistic of 1.216 with a significance level of 0.544. The significance level of the average rank for all the questions in the questionnaire suggest no statistically significant difference in the responses obtained from the participants in the groups divided by years of work experience. The lowest significance level, although not deemed to be significant, for question number 1, was related to the amount of time required to evaluate a firm’s system of internal controls.
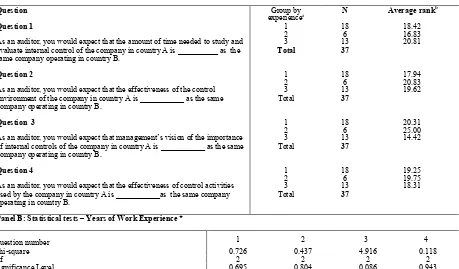
Question 2 (effectiveness of the internal control environment) resulted in an average rank as follows: group 1 has 17.94; group 2 has an average rank of 20.83, and group 3 has an average rank of 19.62. This results in a Chi-square statistic of 0.437 with a significance level of 0.804. Question 3 (management’s vision of the importance of internal controls) resulted in an average rank as follows: group 1 has a value of 20.31, the average rank for group 2 is 25.00 and for group 3 is 14.42. This results in a 4.916 Chi-square statistic with a significance level of 0.086. Question 4 (what an auditor expects related to the effectiveness of internal control activities) resulted in an average rank for group 1 of 19.25, for group 2 it is 19.75 and for group 3 it is 18.31. This results in a Chi-square statistic of 0.118 and a significance level of 0.943.The significance levels of average rank for questions number 1, 2 and 4, suggest no statistically significant difference in the responses from the participants in the groups divided by years of work experience. However, the average rank for question number 3 (management’s vision of the importance of internal controls of a firm) suggests that there is a significant difference in the responses obtained from the participants when they are divided by years of work experience.
21 (amount of time required to study and evaluate a firm’s internal controls) resulted in an average rank for group 1 of 18.42, group 2 has an average rank of 16.83; group 3 has an average rank of 20.81. This results in a Chi-square statistic of 0.726 with a significance level of 0.695.
Table 3: Kruskal-Wallis Test to Determine Whether There is a Difference in the Perception of Auditors Regarding the Reliability of Internal Controls Considering Their Years of Work Experience
Scenario 2: Country with high power distance (Country A) versus Countrywith low power distance. (Country B).
Panel A: Average Rank of the Responses
Question Group by
experiencea N Average rank
b
Question 1
As an auditor, you would expect that the amount of time needed to study and evaluate internal control of the company in country A is __________ as the same company operating in country B.
1
As an auditor, you would expect that the effectiveness of the control environment of the company in country A is ___________ as the same company operating in country B.
As an auditor, you would expect that management’s vision of the importance of internal controls of the company in country A is ___________ as the same company operating in country B.
As an auditor, you would expect that the effectiveness of control activities used by the company in country A is ___________as the same company operating in country B.
Panel B: Statistical tests – Years of Work Experience *
Question number 1 2 3 4
Chi-square 0.726 0.437 4.916 0.118
Df 2 2 2 2
Significance Level 0.695 0.804 0.086 0.943
This table presents the average rank of the responses obtained from the participants in the study that examined a country with high power distance and a country with low power distance and their perceptions of the reliability of internal controls in a firm based on their years of work
experience. (a) Group 1 is 0-2 years of work experience, group 2 is 3-5 years of experience, and group 3 is 6 or more years of experience. (b) Refers to the average rank of the participants' responses. * indicates significance at the 10 percent level.
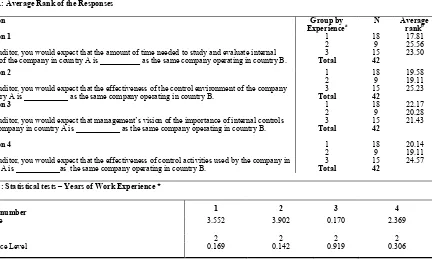
Table 4 presents the results obtained for questions 1-4 from the 42 participants who examined the scenario of a country with a country with a higher degree of uncertainty avoidance and a country with a lower degree of uncertainty avoidance. Question 1 (amount of time required to study and evaluate a firm’s internal controls) resulted in an average rank for group 1 of 17.81, for group 2 it is 25.56 and for group 3 it is 23.50. This results in a Chi-square statistic of 3.552 with a significance level of 0.169.
C. B. Ríos-Figueroa & R. J. Cardona| AT♦ Vol. 5 ♦ No. 2 ♦ 2013
22
The significance levels of average rank for question numbers 1, 2, 3 and 4, suggest no significant difference in the responses obtained from the participants when they are divided by years of work experience.
Table 4: Kruskal-Wallis Test to Determine Whether There is a Difference in the Perception of Auditors Regarding the Reliability of Internal Controls Considering Their Years of Work Experience
Panel A: Average Rank of the Responses
Question Group by
Experiencea N Average rankb
Question 1
As an auditor, you would expect that the amount of time needed to study and evaluate internal control of the company in country A is __________ as the same company operating in country B.
1
As an auditor, you would expect that the effectiveness of the control environment of the company in country A is ___________ as the same company operating in country B.
1
As an auditor, you would expect that management’s vision of the importance of internal controls of the company in country A is ___________ as the same company operating in country B.
1
As an auditor, you would expect that the effectiveness of control activities used by the company in country A is ___________as the same company operating in country B.
1
Panel B: Statistical tests – Years of Work Experience *
Question number 1 2 3 4
Chi-square 3.552 3.902 0.170 2.369
df 2 2 2 2
Significance Level 0.169 0.142 0.919 0.306
* Significant at the 10 percent level.This table presents the average rank of the responses obtained from the participants in the study that examined a country with a higher degree of uncertainty avoidance and a country with a lower degree of uncertainty avoidance and their perceptions of the reliability of internal controls in a firm based on their years of work experience. (a) Group 1 is 0-2 years of work experience, group 2 is 3-5 years of experience, and group 3 is 6 or more years of experience. (b) Refers to the average rank of the participants' responses.
23 Table 5: Kruskal-Wallis Test to Determine Whether There Is a Difference in The Perception of Auditors Regarding the Reliability of Internal Controls Considering Their Years of Work Experience
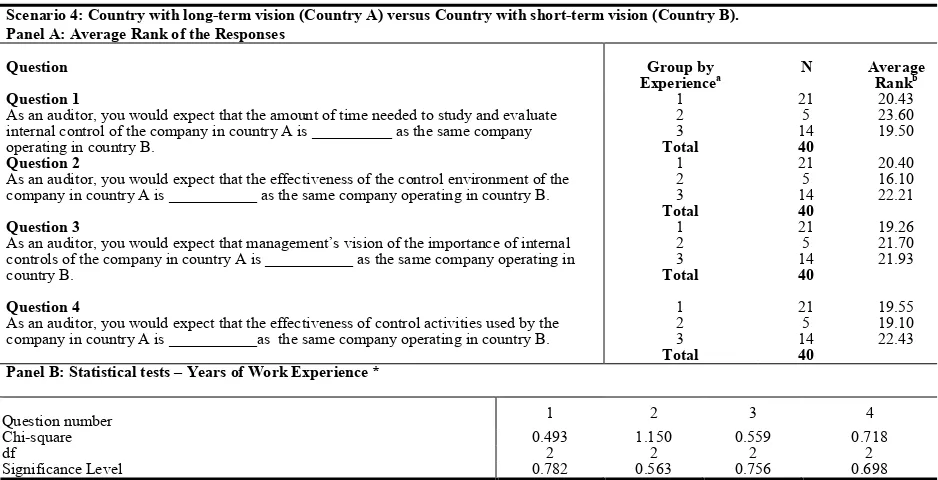
Scenario 4: Country with long-term vision (Country A) versus Country with short-term vision (Country B). Panel A: Average Rank of the Responses
Question Group by
Experiencea N Average Rankb
Question 1
As an auditor, you would expect that the amount of time needed to study and evaluate internal control of the company in country A is __________ as the same company operating in country B.
As an auditor, you would expect that the effectiveness of the control environment of the company in country A is ___________ as the same company operating in country B.
1
As an auditor, you would expect that management’s vision of the importance of internal controls of the company in country A is ___________ as the same company operating in country B.
As an auditor, you would expect that the effectiveness of control activities used by the company in country A is ___________as the same company operating in country B.
1
Panel B: Statistical tests – Years of Work Experience *
Question number 1 2 3 4
Chi-square 0.493 1.150 0.559 0.718
df 2 2 2 2
Significance Level 0.782 0.563 0.756 0.698
* Significant at the 10 percent level. This table presents the average rank of the responses obtained from the participants in the study that examined a country with long-term vision and a country with a short-term vision and their perceptions of the reliability of internal controls in a firm based on their years of work experience. (a) Group 1 is 0-2 years of work experience, group 2 is 3-5 years of experience, and group 3 is 6 or more years of experience(b) Refers to the average rank of the participants' responses.
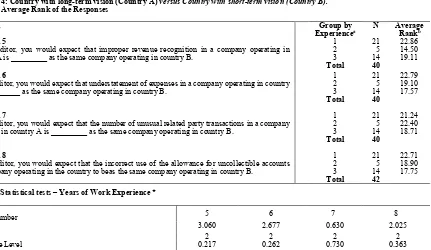
The significance levels for all the scenarios examined (except for one question) do not show a statistically significant difference. Only question number three in Scenario 2, which relates to management’s vision of the importance of a firm’s internal controls, presents a statistically significant difference. Overall, the results obtained and their significance levels do not seem to support the hypothesis that participants will make different decisions regarding their perception of the reliability of a firm’s internal controls depending on their years of work experience.
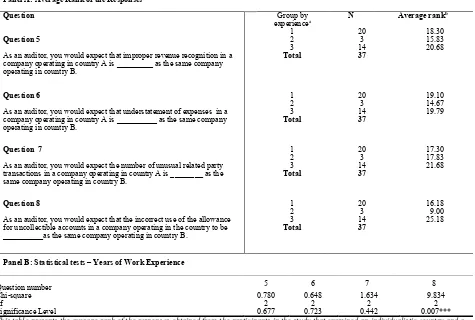
Table 6 presents the results obtained for questions 5-8 from the 37 participants who examined the scenario of an individualistic country and a collectivistic country. Question 5 (what an auditor expects regarding improper revenue recognition in a company) resulted in an average rank for group 1 of 18.30, group 2 has a value of 15.83, and for group 3 it is 20.68. This results in a Chi-square statistic of 0.780 with a significance level of 0.677. Question 6 (what an auditor expects regarding a firm’s understatement of expenses) resulted in an average rank for group 1 of 19.10, for group 2 it is 14.67, and for group 3 it is 19.79. This results in a Chi-square statistic of 0.648 with a significance level of 0.723. Question 7 (what the auditor expects regarding the number of unusual related party transactions in a firm) resulted in an average rank for group 1 of 17.30, group 2 has a value of 17.83, for group 3 it is 21.68. This results in a Chi-square statistic of 1.634 with a significance level of 0.442.